30. Rugo HR, Roche H, Thomas E et al. Ixabepilone–capecitabine vs capecitabine in patients with triple negative tumors: a pooled analysis of patients from two large phase III clinical studies. In San Antonio Breast Cancer Symposium, San Antonio, TX, 2008; Abstract 3057.
31. Sledge G, Miller K, Moisa C et al. Safety and efficacy of capecitabine (C) plus bevacizumab (B) asfirst-line in metastatic breast cancer. J Clin Oncol 2007; 25: 1013.
32. Kotsori AA, Dolly S, Sheri A et al. Is capecitabine efficacious in triple negative metastatic breast cancer? Oncology 2010; 79: 331–336.
Annals of Oncology 24: 1225–1231, 2013 doi:10.1093/annonc/mds604 Published online 9 December 2012
Elevated levels of preoperative CA 15-3 and CEA serum
levels have independently poor prognostic signi
ficance
in breast cancer
J. S. Lee
1,†, S. Park
1,†, J. M. Park
1, J. H. Cho
1, S. I. Kim
1& B.-W. Park
1,2*
1
Department of Surgery;2
Brain Korea 21 Project for Medical Science, Yonsei University College of Medicine, Seoul, Republic of Korea
Received 10 July 2012; revised 8 October 2012; accepted 16 October 2012
Background:
To evaluate the prognostic value of preoperative tumor markers, cancer antigen 15-3 (CA 15-3) and carcinoembryonic antigen (CEA), in breast cancers.Patients and methods:
Preoperative CA 15-3 and CEA levels of 1681 patients were measured. The association of both tumor markers levels with clinicopathological parameters and outcomes was investigated by univariate and multivariate analyses.Results:
Among 1681 patients, elevated preoperative CA15-3 and CEA levels were identified in 176 and 131 patients, respectively. Higher preoperative CA 15-3 and CEA levels were significantly associated with a larger tumor size, axillary node metastases, and advanced stage. Patients with elevated CA 15-3 and CEA levels showed worse survival, even in stage-matched analysis. Patients with normal levels of both CA15-3 and CEA showed better survival than those with one or both markers levels elevated. In multivariate analysis, elevated preoperative CA 15-3 and CEA levels were independent prognostic factors. The statistical significance of elevated preoperative tumor markers levels on survival was solidified with longer follow-up and larger study population.Conclusions:
Elevated preoperative CA 15-3 and CEA levels are associated with tumor burden and showed independent prognostic significance. Therefore, new treatment strategies are necessary for patients with elevated preoperative CA 15-3 and CEA levels in clinical practice.Key words: breast cancer, CA 15-3, CEA, prognostic factor, tumor marker
introduction
Breast cancer is the most frequently occurring cancer in
women from western countries and continues to be the most
common fatal cancer together with lung, bronchus and
colorectum cancers [
1
]. It is also the second most common
malignancy in Korean women [
2
]. Despite the rising incidence
of breast cancer, the survival rates have improved in recent
years due to earlier detection and an increasing use of more
effective systemic treatments based on prognostic factors [
3
].
Therefore, identifying prognostic and predictive factors is
important to assist in decision making about treatment and to
improve survival.
Along with the traditional prognostic factors such as tumor
size, tumor grade, and lymph node status [
4
], the prognostic
value of serum tumor markers has been investigated in breast
cancer [
5
–
8
]. Some studies suggested that elevated
carcinoembryonic antigen (CEA) and cancer antigen 15-3 (CA
15-3) levels provided the signi
ficant prognostic information;
however, others reported no independent value of serum
tumor markers [
5
–
7
]. Recently, Maric et al. [
8
] reviewed the
role of serum tumor markers in breast cancer and they pointed
out con
flicting results of its prognostic value and rather
emphasized the necessity of more extensive investigations for
improved and a more cost-effective management of breast
†Both authors contributed equally to this study.
*Correspondence to: Dr B.-W. Park, Department of Surgery, Yonsei University College of Medicine, 50 Yonsei-ro, Seodaemun-gu, Seoul 120-752, Republic of Korea. Tel: +82-2-2228-2121; Fax: +82-2-313-8289; E-mail: [email protected]
© The Author 2012. Published by Oxford University Press on behalf of the European Society for Medical Oncology. All rights reserved. For permissions, please email: [email protected].
at YONSEI UNIVERSITY MEDICAL LIBRARY on May 14, 2014
http://annonc.oxfordjournals.org/
cancer. The American Society of Clinical Oncology (ASCO)
guidelines do not currently recommend the use of serum CA
15-3 and CEA for breast cancer screening, as a routine
surveillance tool or for therapeutic response monitoring due to
inconsistent
findings of their sensitivity and specificity [
9
].
However, serum tumor markers such as CA 15-3 and CEA are
the most widely used serum tumor markers for surveillance
purposes and treatment response in clinical practice [
10
–
13
].
Previously, we reported that patients with elevated
preoperative levels of CA 15-3 and CEA had worse outcomes
than those with normal levels by stage-matched and
multivariate analyses [
14
]. However, our previous study had a
relatively short follow-up duration and a small sample size.
Therefore, we aimed to recon
firm the prognostic value of
preoperative CA 15-3 and CEA levels while overcoming the
previous limitations. We reinvestigated the data of our previous
study cohort of 740 patients with extended follow-up and then
added consecutively diagnosed breast cancer patients with a
larger sample size.
patients and methods
patients selection
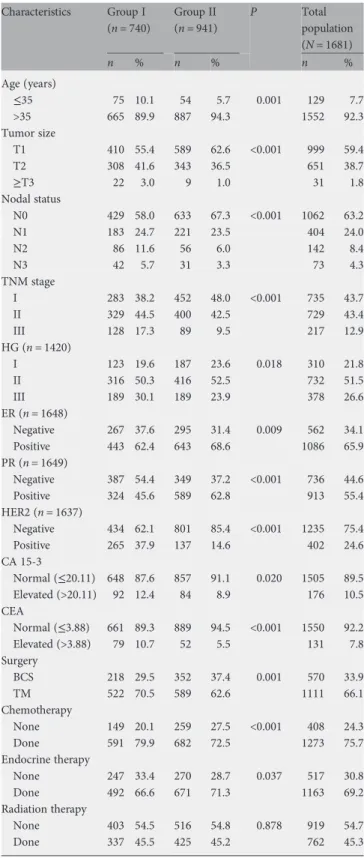
From April 1999 to December 2006, we investigated serum CA 15-3 and CEA concentration levels from a total of 1681 patients who were treated for stage I–III invasive breast cancer at Yonsei University Severance Hospital; 740 patients (group I) who had breast surgery between April 1999 and December 2003 [14] and another 941 patients (group II) who had breast surgery between January 2004 and December 2006. We excluded patients with stage IV disease at diagnosis, carcinoma in situ, unknown TNM stage and receiving neoadjuvant chemotherapy. All data including serum CA 15-3 and CEA levels at the time of diagnosis were obtained from the Severance Hospital Breast Cancer Registry, which is a prospectively maintained database that includes clinical and pathological information, treatment modality, and details of outcomes including disease recurrence and death. Retrospectively to confirm the significance of preoperative serum CA 15-3 and CEA levels in this longer follow-up study, wefirst reinvestigated the survival outcomes of group I and then evaluated the relationship between the level of tumor markers, clinicopathological characteristics and survival outcomes in a larger study population including groups I and II.
Management of all patients was based on international guidelines and adjuvant treatment with radiotherapy, chemotherapy and hormone therapy was not altered according to the marker levels. TNM staging was based on the sixth American Joint Committee on Cancer criteria. To detect local or distant relapse, clinical follow-up was carried out every 6 to 12 months, which included recording patient’s history, physical examination, laboratory tests of CEA, CA 15-3, complete blood counts, and liver function test, chest radiography, mammography, breast and
abdominopelvic ultrasonography, and bone scans. In addition, a computed tomography (CT) scan or afluorine-18 fluorodeoxyglucose positron emission tomography (FDG PET)/CT scan was carried out if necessary.
tumor marker analysis
We measured the concentration of serum tumor markers by using automated immunoanalyzer systems using a chemiluminescent
Table 1. General characteristics of study population Characteristics Group I (n = 740) Group II (n = 941) P Total population (N = 1681) n % n % n % Age (years) ≤35 75 10.1 54 5.7 0.001 129 7.7 >35 665 89.9 887 94.3 1552 92.3 Tumor size T1 410 55.4 589 62.6 <0.001 999 59.4 T2 308 41.6 343 36.5 651 38.7 ≥T3 22 3.0 9 1.0 31 1.8 Nodal status N0 429 58.0 633 67.3 <0.001 1062 63.2 N1 183 24.7 221 23.5 404 24.0 N2 86 11.6 56 6.0 142 8.4 N3 42 5.7 31 3.3 73 4.3 TNM stage I 283 38.2 452 48.0 <0.001 735 43.7 II 329 44.5 400 42.5 729 43.4 III 128 17.3 89 9.5 217 12.9 HG (n = 1420) I 123 19.6 187 23.6 0.018 310 21.8 II 316 50.3 416 52.5 732 51.5 III 189 30.1 189 23.9 378 26.6 ER (n = 1648) Negative 267 37.6 295 31.4 0.009 562 34.1 Positive 443 62.4 643 68.6 1086 65.9 PR (n = 1649) Negative 387 54.4 349 37.2 <0.001 736 44.6 Positive 324 45.6 589 62.8 913 55.4 HER2 (n = 1637) Negative 434 62.1 801 85.4 <0.001 1235 75.4 Positive 265 37.9 137 14.6 402 24.6 CA 15-3 Normal (≤20.11) 648 87.6 857 91.1 0.020 1505 89.5 Elevated (>20.11) 92 12.4 84 8.9 176 10.5 CEA Normal (≤3.88) 661 89.3 889 94.5 <0.001 1550 92.2 Elevated (>3.88) 79 10.7 52 5.5 131 7.8 Surgery BCS 218 29.5 352 37.4 0.001 570 33.9 TM 522 70.5 589 62.6 1111 66.1 Chemotherapy None 149 20.1 259 27.5 <0.001 408 24.3 Done 591 79.9 682 72.5 1273 75.7 Endocrine therapy None 247 33.4 270 28.7 0.037 517 30.8 Done 492 66.6 671 71.3 1163 69.2 Radiation therapy None 403 54.5 516 54.8 0.878 919 54.7 Done 337 45.5 425 45.2 762 45.3
TNM, tumor-node-metastasis; HG, histologic grade; ER, estrogen receptor; PR, progesterone receptor; HER2, human epidermal growth factor receptor 2; CA 15-3, cancer antigen 15-3; CEA, carcinoembryonic angigen; BCS, breast conserving surgery; TM, total mastectomy.
original articles
Annals of Oncology | Lee et al. Volume 24 | No. 5 | May 2013
at YONSEI UNIVERSITY MEDICAL LIBRARY on May 14, 2014
http://annonc.oxfordjournals.org/
immunoassay for CEA (ADVIA Centaur, Bayer HealthCare LLC Diagnostic Division, NY) and CA 15-3 (VITROS ECi Immunodiagnostic System, Ortho-Clinical Diagnostics, Inc., NY). We defined the cut-off values of tumor marker as the 95th percentile of healthy individuals, which was already used in our previous study (CA 15-3: 20.11 U/L, CEA: 3.88 ng/ml) [14]. Tumors with≥10% nuclear-stained cells were considered positive for the estrogen receptor (ER) and progesterone receptor (PR). Human epidermal growth factor receptor 2 (HER2) immunohistochemistry (IHC) was carried out using the HercepTest™ (DAKO, Glostrup, Denmark) and interpreted as 0, 1+, 2+, or 3+. HER2 was considered positive in cases with an IHC 3+ score.
statistical analysis
The difference between proportions was evaluated by the chi-square test. Disease-free survival (DFS) was defined to be from the time of surgery to the locoregional recurrence, distant metastasis, and death before recurrence. Distant relapse-free survival (DRFS) was defined as the time from surgery to the distant recurrence. Overall survival (OS) was defined to be from the time of surgery to death from any cause. DFS and OS were estimated using the Kaplan–Meier method and the group differences in survival time were tested using the log-rank test. Multivariate Cox’s proportional hazard analysis was carried out to compare and identify independent prognostic factors for DFS, DRFS and OS and to calculate hazard ratios. All significant parameters in the univariate analysis were entered into a multivariate model. All reported P values are two-sided, and P values <0.05 were considered significant. SPSS for Windows (version 15.0) was used for all statistical analyses.
results
The median age of the study population was 48 years (range
20
–88 years) and the median follow-up time was 72 months
(range 0.8–143.6 months). The median follow-up duration was
extended to 98.8 months for the previously reported group I
patients and was 63.0 months for the newly added 941 patients
(group II). The general characteristics of the study population
are summarized in Table
1
. Compared with the group I
patients, the group II patients were older, detected earlier, had
favorable characteristics, and a few number of elevated
preoperative tumor marker levels. During follow-up, among
the total study population, recurrence occurred in 208 patients
(
first relapse: local recurrence alone n = 32, systemic recurrence
alone n = 124, both local and systemic recurrences n = 52) and
death occurred in 150 patients.
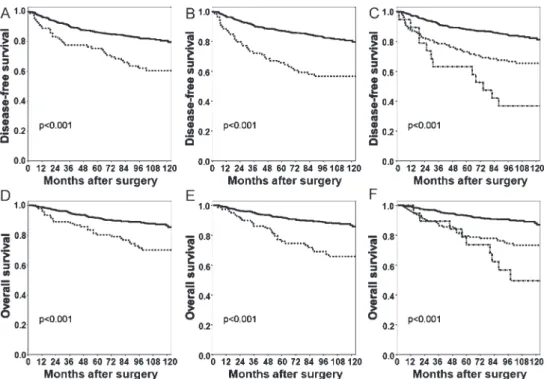
Survival curves of group I with an extended follow-up
duration are shown in Figure
1
. Elevated CA 15-3 or CEA
levels were clearly associated with poor DFS and OS,
respectively (Figure
1
A, B, D, and E). Patients with normal
levels of both CA 15-3 and CEA showed better DFS and OS
than those with elevated either one or both markers levels
(P < 0.001). Elevation of either one marker level was associated
with signi
ficantly better DFS (P = 0.022) and an improved
trend of OS (P = 0.08) than elevation of both markers
(Figure
1
C and F). Using the longer follow-up in this study,
the statistical signi
ficance was reaffirmed from the previous
study [
14
].
Elevated CA 15-3 and CEA levels were identified in 176
(10.5%) and 131(7.8%) patients, respectively, among whole
group I and II patients (Table
1
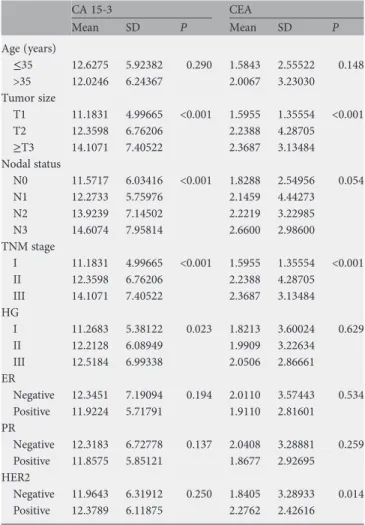
). The correlation between
serum CA 15-3 and CEA levels and clinicopathological
characteristics are shown in Table
2
. Similar to the previous
study [
14
], both CA 15-3 and CEA levels were correlated with
Figure 1. Survival curves of group I with an extended follow-up duration. Disease-free survival (DFS) according to preoperative cancer antigen 15-3 (CA 15-3) (A), carcinoembryonic antigen (CEA) (B), and combination of both markers levels (C) and overall survival (OS) according to preoperative CA 15-3 (D), CEA (E) and combination of both the markers (F). The bold line represents patients with normal levels and dotted line represents patients with elevated levels (A, B, D and E). The bold line represents patients with normal levels of both the markers, the dotted line represents patients with elevated either marker, and the chain line represents patients with elevated both markers (C and F).
Volume 24 | No. 5 | May 2013 doi:10.1093/annonc/mds604 |
at YONSEI UNIVERSITY MEDICAL LIBRARY on May 14, 2014
http://annonc.oxfordjournals.org/
larger tumor size and advanced nodal stage, but not with ER
nor PR expressions. Higher concentration of CA 15-3 was
related to histologic grade III tumors and higher concentration
of CEA was correlated with HER2 positivity in the current
study. Since adjuvant treatment was not determined by tumor
marker levels, there was no difference in adjuvant treatment
according to CA 15-3 and CEA levels, but more patients with
elevated CA15-3 levels received chemotherapy and this was not
statistically signi
ficant (supplementary Table S1, available at
Annals of Oncology online).
In our study population of 1681 patients, elevated CA 15-3
and CEA levels were signi
ficantly associated with worse DFS
and OS (Figure
2
). In this longer follow-up and larger study
population, the statistical significance was more intensified and
the survival curves were distinctively different according to
tumor markers. In tumor stage-matched analysis, patients with
elevated CA 15-3 levels showed signi
ficantly worse DFS and OS
in stages I (P = 0.042 and 0.002, respectively) and II (P < 0.001
and P = 0.034, respectively), but not in stage III (supplementary
Figure S1, available at Annals of Oncology online). By analysis of
CEA levels, an elevated CEA group showed a significantly worse
DFS and OS in all stages I
–III (supplementary Figure S2,
available at Annals of Oncology online).
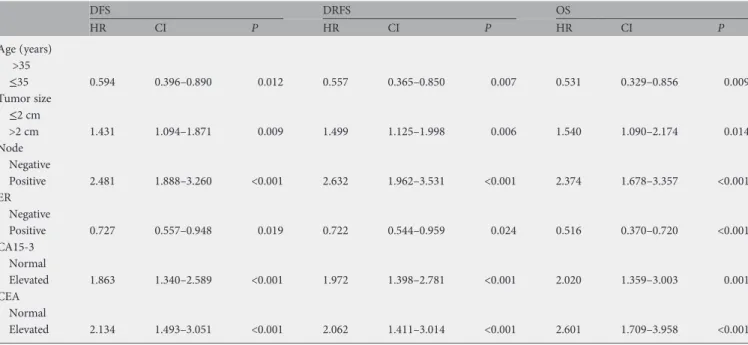
Multivariate analysis adjusting for the most important
conventional prognostic factors revealed that elevated
preoperative CA 15-3 and CEA levels were independent
prognostic factors in DFS, DRFS and OS. Traditional
clinicopathological factors such as age, tumor size, node
metastasis, and ER status also had independent prognostic
power in the Cox
’s models (Table
3
). Both CA 15-3 and CEA
levels were elevated in 28 patients, either CA 15-3 or CEA was
elevated in 251 patients, and the remaining 1402 patients had
normal ranges of both the markers. Patients with normal levels
of both the markers showed the best DFS and OS.
Subsequently, those with either one elevated marker level
demonstrated better survival, and
finally, those with both
elevated markers presented the worst survival (both normal
versus either elevated, P < 0.001 for DFS, and P < 0.001 for OS;
and both normal versus both elevated, P < 0.001 for DFS, and
P < 0.001 for OS) (Figure
3
).
discussion
The prognostic value of preoperative serum tumor marker CA
15-3 and CEA was demonstrated in our previous study, which
included 740 patients with a median follow-up of 37.2 months
[
14
]. Our previous
findings were reconfirmed and even
solidified in the present study with an extended follow-up of
98.8 months (Figure
1
). Nine hundred and forty-one patients
were added to the previous study population of 740, and the
current analysis was carried out in a larger study population of
1681 with a median follow-up of 72 months.
With the activation of a national screening program, the
proportion of screening-detection remarkably increased from
5.0% to 32.6% and the incidence of stage I breast cancer also
increased from 19.6% to 34.8% between 1996 and 2008 in
Korea [
15
]. As expected, the incidence of patients with elevated
preoperative levels of serum CA 15-3 and CEA decreased along
with the increase in early breast cancer patients in the current
study (Table
1
). This
finding supports the proposed association
of tumor burden and elevated levels of serum tumor markers.
The preoperative serum CEA and CA 15-3 levels are associated
with the tumor size and lymph node metastasis which
represents tumor burden [
14
,
16
,
17
] and significantly higher
levels of CEA and CA 15-3 were seen in patients with
advanced disease than in those with locoregional breast cancer
[
9
,
13
,
18
]. The current study also demonstrated the
association of higher levels of CA 15-3 and CEA with tumor
burden such as larger tumor size, node metastases, and
advanced stage in a large study population with longer
follow-up. Although the association of tumor markers and tumor
biological factors is not well established [
19
], the serum CA
15-3 level was related to the poor histological grade in agreement
with the recent study by Molina et al. [
5
,
20
]. The relationship
between higher levels of CEA and HER2 expression needs to
be further investigated.
Since elevated levels of CA 15-3 and CEA are related to the
tumor burden and higher levels may indicate vascularization of
the tumor with an increased likelihood of occult systemic
Table 2. Correlation between serum CA 15-3 and CEA level and clinicopathological factors in a total of 1681 patients
CA 15-3 CEA Mean SD P Mean SD P Age (years) ≤35 12.6275 5.92382 0.290 1.5843 2.55522 0.148 >35 12.0246 6.24367 2.0067 3.23030 Tumor size T1 11.1831 4.99665 <0.001 1.5955 1.35554 <0.001 T2 12.3598 6.76206 2.2388 4.28705 ≥T3 14.1071 7.40522 2.3687 3.13484 Nodal status N0 11.5717 6.03416 <0.001 1.8288 2.54956 0.054 N1 12.2733 5.75976 2.1459 4.44273 N2 13.9239 7.14502 2.2219 3.22985 N3 14.6074 7.95814 2.6600 2.98600 TNM stage I 11.1831 4.99665 <0.001 1.5955 1.35554 <0.001 II 12.3598 6.76206 2.2388 4.28705 III 14.1071 7.40522 2.3687 3.13484 HG I 11.2683 5.38122 0.023 1.8213 3.60024 0.629 II 12.2128 6.08949 1.9909 3.22634 III 12.5184 6.99338 2.0506 2.86661 ER Negative 12.3451 7.19094 0.194 2.0110 3.57443 0.534 Positive 11.9224 5.71791 1.9110 2.81601 PR Negative 12.3183 6.72778 0.137 2.0408 3.28881 0.259 Positive 11.8575 5.85121 1.8677 2.92695 HER2 Negative 11.9643 6.31912 0.250 1.8405 3.28933 0.014 Positive 12.3789 6.11875 2.2762 2.42616
CA 15-3, cancer antigen 15-3; CEA, carcinoembryonic angigen; SD, standard deviation; TNM, tumor-node-metastasis; HG, histologic grade; ER, estrogen receptor; PR, progesterone receptor; HER2, human epidermal growth factor receptor 2.
original articles
Annals of Oncology | Lee et al. Volume 24 | No. 5 | May 2013
at YONSEI UNIVERSITY MEDICAL LIBRARY on May 14, 2014
http://annonc.oxfordjournals.org/
metastases [
21
,
22
], elevated CA 15-3 and CEA concentration
at initial presentation could be predictive of poor breast cancer
outcome [
23
]. In agreement with other studies demonstrating
significant association between the preoperative tumor marker
levels and the survival outcome [
14
,
21
,
24
,
25
], the elevated
preoperative CA 15-3 or CEA levels were signi
ficantly
Figure 2. Disease-free survival (DFS) according to preoperative CA 3 (A) and CEA levels (B) and overall survival (OS) according to preoperative CA 15-3 (C) and CEA levels (D) in group I and II patients. The bold line represents patients with normal levels and the dotted line represents patients with elevated levels.
Table 3. Cox’s regression analysis according to age, stage, estrogen receptor status, and serum markers in a total of 1681 patients
DFS DRFS OS HR CI P HR CI P HR CI P Age (years) >35 ≤35 0.594 0.396–0.890 0.012 0.557 0.365–0.850 0.007 0.531 0.329–0.856 0.009 Tumor size ≤2 cm >2 cm 1.431 1.094–1.871 0.009 1.499 1.125–1.998 0.006 1.540 1.090–2.174 0.014 Node Negative Positive 2.481 1.888–3.260 <0.001 2.632 1.962–3.531 <0.001 2.374 1.678–3.357 <0.001 ER Negative Positive 0.727 0.557–0.948 0.019 0.722 0.544–0.959 0.024 0.516 0.370–0.720 <0.001 CA15-3 Normal Elevated 1.863 1.340–2.589 <0.001 1.972 1.398–2.781 <0.001 2.020 1.359–3.003 0.001 CEA Normal Elevated 2.134 1.493–3.051 <0.001 2.062 1.411–3.014 <0.001 2.601 1.709–3.958 <0.001
DFS, disease-free survival; DRFS, distant recurrence-free survival; OS, overall survival; HR, hazard ratio; CI, confidence interval; ER, estrogen receptor; CA 15-3, cancer antigen 15-3; CEA, carcinoembryonic angigen.
Volume 24 | No. 5 | May 2013 doi:10.1093/annonc/mds604 |
at YONSEI UNIVERSITY MEDICAL LIBRARY on May 14, 2014
http://annonc.oxfordjournals.org/
associated with poor DFS (P < 0.001 and P < 0.001,
respectively) and OS (P < 0.001 and P < 0.001, respectively)
(Figure
2
), even in a stage-matched analysis (supplementary
Figures S1 and S2, available at Annals of Oncology online).
With a longer follow-up and a larger population of the present
study, the prognostic significance of tumor marker elevation
became more con
fident and extended to almost all stages. The
prognostic signi
ficance was also maintained in the multivariate
analysis with the addition of other traditional prognostic
factors such as age, tumor size, lymph node metastasis, and ER
status (Table
3
).
Although the ASCO panel does not recommend therapeutic
decisions be based on the serum tumor marker status [
9
],
several studies showed that the preoperative concentration of
tumor markers could be useful in combination with other
factors in deciding whether adjuvant chemotherapy should be
administered [
5
,
13
,
23
,
26
]. Furthermore, higher levels may
reflect an increased likelihood of occult systemic metastases
[
21
] and the study evaluating early treatment based on
increasing tumor marker concentrations showed improved
outcomes compared with controls [
27
]. Compared with the
results of previous study [
14
], the prognostic value of the
combination of both marker levels was further intensi
fied with
a longer follow-up and with a larger study population. Patients
with either one or both markers elevated showed signi
ficantly
worse survival outcomes than those with both normal ranges
of markers in the current study. Therefore, elevated
preoperative serum tumor markers could be useful in
discriminating high-risk groups and in deciding adjuvant
systemic treatment, for which the hypothesis should be
veri
fied.
In conclusion, our previous
findings of independent
prognostic signi
ficance of elevated preoperative serum CA 15-3
and CEA levels [
14
] are reconfirmed with the extended
follow-up and larger study population in the present analyses.
Preoperative serum CA 15-3 and CEA levels can provide
additional prognostic information and may be useful in
treatment implementation. Therefore, both the markers could
be considered for the risk evaluation and determination of
adjuvant treatment strategies in clinical practice, although this
hypothesis should be further validated. Further clinical trials
based on the tumor marker levels are necessary.
disclosure
The authors have declared no conflicts of interest.
references
1. Jemal A, Siegel R, Ward E et al. Cancer statistics, 2009. CA Cancer J Clin 2009; 59: 225–249.
2. Jung KW, Park S, Kong HJ et al. Cancer statistics in Korea: incidence, mortality, survival, and prevalence in 2009. Cancer Res Treat 2012; 44: 11–24. 3. Lonning PE. Breast cancer prognostication and prediction: are we making
progress? Ann Oncol 2007; 18: viii3–viii7.
4. Elston CW, Ellis IO, Pinder SE. Pathological prognostic factors in breast cancer. Crit Rev Oncol Hematol 1999; 31: 209–223.
5. Molina R, Auge JM, Farrus B et al. Prospective evaluation of carcinoembryonic antigen (CEA) and carbohydrate antigen 15.3 (CA 15.3) in patients with primary locoregional breast cancer. Clin Chem 2010; 56: 1148–1157.
6. Sandri MT, Salvatici M, Botteri E et al. Prognostic role of CA15.3 in 7942 patients with operable breast cancer. Breast Cancer Res Treat 2012; 132: 317–326.
7. Uehara M, Kinoshita T, Hojo T et al. Long-term prognostic study of carcinoembryonic antigen (CEA) and carbohydrate antigen 15-3 (CA 15-3) in breast cancer. Int J Clin Oncol 2008; 13: 447–451.
8. Maric P, Ozretic P, Levanat S et al. Tumor markers in breast cancer—evaluation of their clinical usefulness. Coll Antropol 2011; 35: 241–247.
9. Harris L, Fritsche H, Mennel R et al. American Society of Clinical Oncology 2007 update of recommendations for the use of tumor markers in breast cancer. J Clin Oncol 2007; 25: 5287–5312.
10. Duffy MJ. CA 15-3 and related mucins as circulating markers in breast cancer. Ann Clin Biochem 1999; 36: 579–586.
11. Cheung KL, Graves CR, Robertson JF. Tumour marker measurements in the diagnosis and monitoring of breast cancer. Cancer Treat Rev 2000; 26: 91–102. 12. Nicolini A, Carpi A. Postoperative follow-up of breast cancer patients:
overview and progress in the use of tumor markers. Tumour Biol 2000; 21: 235–248.
13. Duffy MJ. Serum tumor markers in breast cancer: are they of clinical value? Clin Chem 2006; 52: 345–351.
14. Park BW, Oh JW, Kim JH et al. Preoperative CA 15-3 and CEA serum levels as predictor for breast cancer outcomes. Ann Oncol 2008; 19: 675–681. 15. Jung YS, Na KY, Kim KS et al. Nation-wide Korean breast cancer data from 2008
using the breast cancer registration program. J Breast Cancer 2011; 14: 229–236. 16. Gion M, Boracchi P, Dittadi R et al. Prognostic role of serum CA15.3 in 362
node-negative breast cancers. An old player for a new game. Eur J Cancer 2002; 38: 1181–1188.
17. Tampellini M, Berruti A, Gerbino A et al. Relationship between CA 15-3 serum levels and disease extent in predicting overall survival of breast cancer patients with newly diagnosed metastatic disease. Br J Cancer 1997; 75: 698–702. Figure 3. Disease-free survival (DFS) (A) and overall survival (OS) (B) according to the combination of both marker levels in group I and II patients. The bold line represents patients with normal levels of both markers, the dotted line represents patients with elevated either marker, and the chain line represents patients with both markers elevated.
original articles
Annals of Oncology | Lee et al. Volume 24 | No. 5 | May 2013
at YONSEI UNIVERSITY MEDICAL LIBRARY on May 14, 2014
http://annonc.oxfordjournals.org/
18. Molina R, Barak V, van Dalen A et al. Tumor markers in breast cancer- European Group on Tumor Markers recommendations. Tumour Biol 2005; 26: 281–293. 19. Yerushalmi R, Tyldesley S, Kennecke H et al. Tumor markers in metastatic breast
cancer subtypes: frequency of elevation and correlation with outcome. Ann Oncol 2012; 23: 338–345.
20. Molina R, Auge JM, Escudero JM et al. Evaluation of tumor markers (HER-2/neu oncoprotein, CEA, and CA 15.3) in patients with locoregional breast cancer: prognostic value. Tumour Biol 2010; 31: 171–180.
21. Canizares F, Sola J, Perez M et al. Preoperative values of CA 15-3 and CEA as prognostic factors in breast cancer: a multivariate analysis. Tumour Biol 2001; 22: 273–281.
22. Gasparini G, Toi M, Gion M et al. Prognostic significance of vascular endothelial growth factor protein in node-negative breast carcinoma. J Natl Cancer Inst 1997; 89: 139–147.
23. Shering SG, Sherry F, McDermott EW et al. Preoperative CA 15-3 concentrations predict outcome of patients with breast carcinoma. Cancer 1998; 83: 2521–2527. 24. Ebeling FG, Stieber P, Untch M et al. Serum CEA and CA 15-3 as prognostic
factors in primary breast cancer. Br J Cancer 2002; 86: 1217–1222. 25. Molina R, Filella X, Alicarte J et al. Prospective evaluation of CEA and CA 15.3
in patients with locoregional breast cancer. Anticancer Res 2003; 23: 1035–1041.
26. Duffy MJ, Duggan C, Keane R et al. High preoperative CA 15-3 concentrations predict adverse outcome in node-negative and node-positive breast cancer: study of 600 patients with histologically confirmed breast cancer. Clin Chem 2004; 50: 559–563.
27. Nicolini A, Carpi A, Michelassi C et al.‘Tumour marker guided’ salvage treatment prolongs survival of breast cancer patients:final report of a 7-year study. Biomed Pharmacother 2003; 57: 452–459.
Annals of Oncology 24: 1231–1238, 2013 doi:10.1093/annonc/mds625 Published online 27 December 2012
Unbiased quantitative assessment of Her-2 expression
of circulating tumor cells in patients with metastatic
and non-metastatic breast cancer
S. T. Ligthart
1,†, F.-C. Bidard
2,†, C. Decraene
3, T. Bachelot
4, S. Delaloge
5, E. Brain
2,
M. Campone
6, P. Viens
7, J.-Y. Pierga
2& L. W. M. M. Terstappen
1*
1
Medical Cell BioPhysics Group, University of Twente, Enschede, The Netherlands;2
Department of Medical Oncology, Institut Curie, Paris;3
Department of Subcellular Structure and Cellular Dynamics, Institut Curie/CNRS UMR 144, Paris;4
Department of Medical Oncology, Centre Leon Bérard, Lyon;5
Department of Medical Oncology, Institut Gustave Roussy, Villejuif;6
Department of Medical Oncology, Institut de Cancérologie de l’Ouest, Nantes;7
Department of Medical Oncology, Institut Paoli-Calmettes, Marseille, France
Received 11 July 2012; revised 29 October 2012; accepted 30 October 2012
Background:
Circulating tumor cells (CTCs) can provide the basis for a liquid biopsy and may guide the use of targeted therapies. We report on unbiased quantification of Her-2 protein expression of CTCs.Patients and methods:
Her-2 assessment of CTCs was carried out using the CellSearch®system in 103 metastatic (M1) and 88 non-metastatic (M0) breast-cancer patients. Expression of Her-2 on CTCs was determined by a manual review and an automated algorithm using Her-2-fluorescein isothiocyanate (FITC) fluorescence of leukocytes to determine the Her-2-expression threshold in each sample.Results:
Her-2 expression of CTCs varied greatly within and among patients compared with Her-2 expression of leukocytes. In M1 patients, a threshold of 75% of Her-2 positive CTCs in patients with≥5 CTCs was set. Applying this threshold, 9% of M1 patients with Her-2-negative primary tumors had Her-2-positive CTC status and 29% of M1 patients with Her-2-positive primary tumors had Her-2-negative CTC status. No Her-2 discrepancy was observed between CTCs and primary tumors in M0 patients.Conclusions:
Ourfindings demonstrate that Her-2 expression is heterogeneous among CTCs within each patient. We show the feasibility of unbiased quantitative and reproducible assessment of treatment targets on CTCs, opening a path towards personalized treatment.Key words: automated analysis, breast cancer, circulating tumor cells, Her-2, quantitative assessment
†Both authors contributed equally to this work.
*Correspondence to: Prof. L. W. M. M. Terstappen: Department of Medical Cell BioPhysics, MIRA Institute, University of Twente, Carre Room C4437, Hallenweg 23, 7522 NH Enschede, The Netherlands. Tel: +31-53-489-2425; Fax: +31-53-489-3511; E-mail: [email protected]
© The Author 2012. Published by Oxford University Press on behalf of the European Society for Medical Oncology. All rights reserved. For permissions, please email: [email protected].
at YONSEI UNIVERSITY MEDICAL LIBRARY on May 14, 2014
http://annonc.oxfordjournals.org/