Contents lists available atScienceDirect
Nuclear Materials and Energy
journal homepage:www.elsevier.com/locate/nmeThe effect of beryllium oxide on retention in JET ITER-like wall tiles
C. Makepeace
a,⁎, C. Pardanaud
b, P. Roubin
b, I. Borodkina
c,d, C. Ayres
e, P. Coad
e,
A. Baron-Wiechec
e, I. Jepu
f, K. Heinola
g, A. Widdowson
e, S. Lozano-Perez
a, J.E.T. Contributors
h,1 aDepartment of Materials, University of Oxford, Parks Road, Oxford OX1 3PH, UKbAix-Marseille Universite, CNRS, PIIM UMR 7345, 13397, Marseille, France
cNational Research Nuclear University MEPHI, Moscow, 115409, Kashirskoe sh. 31, Russia dForschungszentrum Julich GMbH, Wilhelm-Johnen-Strasse, 52428 Julich, Germany eCCFE, Culham Science Centre, Abingdon, OX14 3DB, UK
fNational Institute for Laser Plasma and Radiation Physics, Bucharest-Magurele 077125, Romania gUniversity of Helsinki, PO Box 64, FI-00560 Helsinki, Finland
hEUROfusion Consortium, JET, Culham Science Centre, Abingdon, OX14 3DB, UK
A B S T R A C T
Preliminary results investigating the microstructure, bonding and effect of beryllium oxide formation on retention in the JET ITER-like wall beryllium tiles, are presented. The tiles have been investigated by several techniques: Scanning Electron Microscopy (SEM) equipped with Energy Dispersive X-ray (EDX), Transmission Electron microscopy (TEM) equipped with EDX and Electron Energy Loss Spectroscopy (EELS), Raman Spectroscopy and Thermal Desorption Spectroscopy (TDS). This paper focuses on results from melted materials of the dump plate tiles in JET. From our results and the literature, it is concluded, beryllium can form micron deep oxide islands contrary to the nanometric oxides predicted under vacuum conditions. The deepest oxides analyzed were up to 2-micron thicknesses. The beryllium Deuteroxide (BeOxDy) bond was found with Raman Spectroscopy. Application of EELS confirmed the oxide presence and stoichiometry. Literature suggests these oxides form at temperatures greater than 700 °C where self-diffusion of beryllium ions through the surface oxide layer can occur. Further oxidation is made possible between oxygen plasma impurities and the beryllium ions now present at the wall surface. Under Ultra High Vacuum (UHV) nanometric Beryllium oxide layers are formed and passivate at room temperature. After continual cyclic heating (to the point of melt formation) in the presence of oxygen impurities from the plasma, oxide growth to the levels seen experimentally (approximately two microns) is proposed. This retention mechanism is not considered to contribute dramatically to overall retention in JET, due to low levels of melt formation. However, this mechanism, thought the result of operation environment and melt formation, could be of wider concern to ITER, dependent on wall temperatures.
1. Introduction
Beryllium is the material of choice for the International Thermonuclear Experimental Reactor (ITER) and therefore the subject of ongoing research surrounding fuel retention to meet ITER's safety case. Tritium, a radioactive isotope of hydrogen and one of two hy-drogen isotopes used in the fusion reaction, has an operational safety limit of 700 g within the reactor vessel. The beryllium wall area, will equate to ∼700 m2. Beryllium was chosen as the first wall cladding due to: reduced chemical erosion (compared to previous carbon counter-parts); a high melting point; a low Z number; and good oxygen gettering from the plasma. The Joint European Torus (JET) moved to an ITER-like wall with beryllium limiters and a tungsten divertor in late 2010 and saw a factor of 20 reductions [1]of retained hydrogen isotopes compared to carbon walls. Since then three ITER-like wall campaigns have occurred producing reactor relevant materials for post mortem
analysis. This paper focuses on work from the first campaign and melted beryllium materials originating from the apex of JET which are compared against JET's midplane beryllium wall limiters tiles (which have not undergone melting). The apex of JET (the ‘dump plate’ tiles) is an area where comparably larger volumes of melted material are pro-duced. Melted material appears to increase the propensity of beryllium oxidation, due to increased diffusion of beryllium to the surface, whereby oxygen from the plasma can react once more[2, 3]. Despite beryllium's often touted claim of ‘good oxygen gettering’, the result of oxidation on retention is widely discussed[4]. Data from controlled laboratory experiments lead to a complicated understanding of hy-drogen retention and oxidation. The results are briefly summarized. Early reports from [5] found that both water and oxygen can in-dependently oxidize beryllium to ∼3 monolayer thick islands. If both H2O and oxygen are present coincidently, further growth can occur to ∼6 monolayer depths[6,7]. However, formation of OH bonds at the
https://doi.org/10.1016/j.nme.2019.02.022
Received 1 August 2018; Received in revised form 14 February 2019; Accepted 14 February 2019 ⁎Corresponding author.
E-mail address:[email protected](C. Makepeace). 1See the author list of “X. Litaudon et al. 2017 Nucl. Fusion 57 102001″.
Available online 18 March 2019
2352-1791/ © 2019 Published by Elsevier Ltd. This is an open access article under the CC BY-NC-ND license (http://creativecommons.org/licenses/BY-NC-ND/4.0/).
surface was not discovered. Retention decreased when oxidized ber-yllium was exposed to hydrogen, compared to clean berber-yllium [8]. Desorption of H occurred at 320 K for BeO surface and 450 K for the clean surface. Zalkind promoted oxide islands formation by nucleation at oxygen coverages above 2–3 monolayers, followed by lateral growth. Ion implantation was seen to double the oxygen sticking coefficient and increase the oxidation rate significantly[9]. Similarly, pre-adsorbed H significantly reduced the quantity of adsorbed oxygen on the surface. At T > 700 °C oxygen nucleates without chemisorption. Thermal deso-rption data, above all must be considered carefully[10]. The ease at which beryllium can oxidize, even under ultra-high vacuum conditions, has led authors to suggest samples were free of oxidation, when more likely partial oxide layers had already formed[11].
2. Experimental method
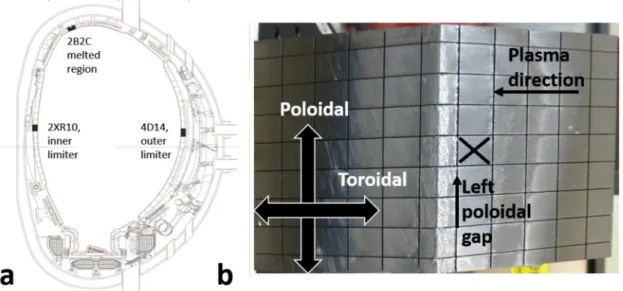
Tiles taken from the first ITER-like wall campaign (2011–12) were cut into individual castellations as previously described in[12]to avoid sample heating and produce thermal desorption relevant samples (1 cm2× 250 mm). All samples listed and discussed were originally 'maker layer' tiles designed to enable measurement of deposition and erosion. The tiles were prepared with bulk beryllium substrates upon which 3 µm Ni and a further 8 µm Beryllium (at the surface) were de-posited with a thermionic vacuum arc [13,14]. Dump plate tiles or-ientated at the top of the vessel are indicated inFig. 1; including the 2B2C dump plate photo (right) showing surface melting along the central ridge. For comparison, limiter tiles 2XR10 and 4D14 from the mid plane of the inner and outer walls respectively are also indicated in Fig. 1(a). A Tescan Mira XMH SEM equipped with an Oxford Instru-ments X-Max 80 EDS detector was used for imaging and analysis of tiles’ surface chemistries using 5, 10 and 20 kV accelerating voltages. The Casino software [15]was applied to provide a rough estimate of the corresponding interaction volumes from which characteristic X-Rays are produced, and therefore an estimate of the depth of the oxides present. Further image analysis was undertaken using Image-J to gain an estimate of the average oxide island size and distribution [16]. Raman Spectroscopy was untaken on both the limiter and dump plate tiles in back-scattering geometry, using a Horiba-Jobin Yvon LabRAM apparatus (×100 objective, 0.9 numerical aperture, laser wavelength of 514.4 nm and laser power of ∼1 mWµm−2). The Raman Map discussed in this report was taken with a lateral resolution of 500 nm and is fo-cused on one area, which lead to the discovery of the Be-OD bond. Further information can be found in the publication by Kumar et al.
[17]. Transmission electron microscopy lamella of a cross section through the Raman mapped area (and other areas additionally) were prepared via Focused Ion Beam (FIB) on a dual beam FEI Helios. The preparation route was standard to beryllium materials[18], involving platinum surface deposition; initially with an electron beam followed by a low current ion beam, until a protective layer of 2 µm is present. A 30 kV gallium ion beam was used to trench around the area of interest, followed by undercutting. The beam current was 22 nA and 9 nA re-spectively. Lastly the area is lifted out and attached to a semi-circular omni probe copper mount, where the sample is thinned to ∼100 nm. Further low energy cleaning occurred to achieve sub 100 nm thick-nesses. Samples were transferred to a Jeol-ARM200F TEM (cold-FEG, operated at 200 kV). Scanning TEM (STEM) was used predominantly and in conjunction with Energy Dispersive X-ray (EDX) in a Jeol Cen-turio detector and Electron Energy Loss Spectroscopy (EELS) in a Gatan Quantim GIF. Due to the limitations of EDX in detecting beryllium, EELS can be used to good effect to understand the stoichiometry's present between Be and O with future work continuing to investigate the presence of H isotopes in the low loss region of the spectra. Thermal desorption spectroscopy (TDS) data were collected on samples from similar locations along the tiles. The results are collected on a Hiden TPD workstation type 640,100. The process back heats a sample with a 10 °C/min thermal ramp under vacuum. The gaseous species desorbed from the surface are measured via an analytical HAL/3F RC 1051-9 PIC quadrupole mass spectrometer at line-of-sight orientation for direct detection.
3. Experimental results and discussion
SEM studies of the beryllium surfaces were initially undertaken at lower magnifications to survey and compare the level of oxidation at different positions around JET, prior to TEM analysis. SEM voltages of 5, 10 and 20 kV were used alongside the Casino software to model the depth of the interaction volume, which corresponded to 250 nm, 400 nm and 2000 nm respectively. Included inTable 1is the compar-ison among the reactor positions of a 20 kV SEM beam corresponding to ∼2 µm depth. Via image analysis of EDX oxide maps, a qualitative comparison of oxide number densities which extend to 2 µm depths is given inTable 1.Table 1compares the outer and inner limiters with the dump plates. The outer limiters experienced lower operational tem-peratures than the inner limiters, whilst the dump plates experienced the highest temperatures and melt events (Fig. 1(b)). The average surface area and number density of oxide islands are greatest on the
Fig. 1. Image of a) poloidal cross section of JET, showing the position of the 2B2C dump plate tile, and b) the 2B2C tile with melted central ridge. Figures include
dump plates suggesting melt events influence oxidation behaviour. The outer poloidal limiter deposition zone, as the only position other than the dump plate nearing similar oxide island number densities and areas, occurs as an outlier. This outer limiter position experiences the coolest operational temperatures and is the most advantageous environment for deposition layers to form, with thicknesses up to 15 μm. These de-posits are complex multi-layered structures of beryllium, oxygen, tungsten, nickel, nitrogen and hydrogen contaminates. InSection 3.1 EELS is used to show that the deposits have a different oxide structure to the metallic oxidation that forms under melting (Table 2). 3.1. Analysis of melting on fuel retention
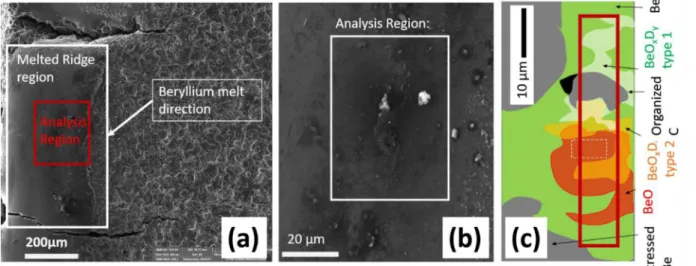
An in-depth analysis of a specific region of the melted castellation, first studied by Raman Spectroscopy follows.Fig. 2shows a region of melted material. This region is positioned at the left poloidal castella-tion gap of the dump plate tile and appears to be the result of erosion across the face of the castellation from right to left toroidally, (Fig. 1(b)) consistent with the plasma direction. The area to the right of the melted ridge has a micron sized crack network connecting islands of eroded
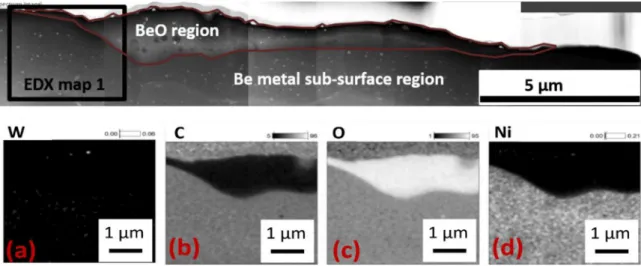
material. Larger macro-scale cracks are seen along all edges of the castellation, bridging regions of melted material (mounds) to the lower eroded zones. Cracking is likely in response to large thermal shocks received during operation. Presence of oxidation and the differences in thermal expansion between the oxide and S65C beryllium will increase the level of stress present in the material[7,17]. Unfortunately, marker layers complicate material chemistry due to mixing at high tempera-tures. Nevertheless, the oxides formed are free of nickel contaminants (Fig. 3(b)).
Raman analysis of the melted region showed the presence of the BeOxDy bond confirmed by comparison to Infra-Red studies of HOBeOH, HBeOH and HBeOBeH[19]. Further calculations using both DFT and BeO samples have confirmed the wurtzite structure, however the exact stoichiometry of the Be-OD bond is yet to be confirmed[20]. The Raman measurement was undertaken in many areas across the surface of the sample, however Be-OD retention was found solely on the melted region. The average surface roughness of the sample varied greatly, due to the limitations of the technique (attenuation of the Raman signal into the surface being ∼30–50 nm in beryllium)[21], it is not apparent whether the sample's roughness is responsible for the absence of Be-OD bonding elsewhere across the sample's surface area. The Raman schematic in Fig. 2(c), shows the complex nature of the surface chemistry present without exception in all JET tiles [22]. Analysis of the Raman spectra eluded to the presence of multiple forms (up to 3 forms) of the Be-OD bond with varying stoichiometries. For further analysis of the Raman technique see Kumar et al. [17]. A Transmission Electron Microscopy (TEM) lamella of the region was produced to explore the bonding present at greater depths and confirm the structure of the oxidation. The area the lift-out was taken from is shown inFig. 2(c) by the red box.Fig. 3shows the extent of oxidation in the Raman analysis region, spanning ∼20 µm laterally (outlined in
Table 1
Comparison of oxidation levels between limiter tiles and melted dump plate tile.
Position of beryllium castellation in JET Energy Dispersive X-Ray results of oxides on the surface of beryllium materials from JET with a 20 kV accelerating voltage, interacting with ∼2 µm depths.
Number of oxide particles (mm−²) Average oxide particle size (µm) Percentage Oxide Area (mm−2)
Outer poloidal limiter eroded 57 0.17 1.0
Outer poloidal limiter deposited 20,899 8.60 18.0
Inner poloidal limiter eroded 619 0.12 7.2
Inner poloidal limiter deposited 429 0.16 7.5
Dump plate melted material 31,700 6.30 19.9
Table 2
List of beryllium and oxygen stoichiometries at oxidized points listed inFig. 4. Point in Melted Region EELS atomic-%
maps (Fig. 4) Beryllium atomic% Oxygen atomic%
1 53.8 46.2
2 65.5 34.5
3 79.1 20.9
4 98.6 1.4
5 90.2 9.8
Fig. 2. a) SEM secondary electron image of melted ridge (left poloidal edge of the castellation), and b) the analysis region at higher magnification (0.8kx), and c)
Raman schematic of the region after analysis, showing surface chemistry contributions spatially. The red box indicates the area of the TEM lift-out. Figures include some use of colour. The reader is referred to the online version of the paper.
red), and at greatest depth ∼2 µm. The EDX of the sample shows a clear oxidation boundary, however in-depth EELS of the region showed oxidation variability independent of grain orientation (Fig. 4).
Fig. 4(a) and (b) show the extent of oxidation present in the first 5 μm of the melted samples’ surface. The grains are clearly oxidized to different extents with 3 grains clearly seen as almost pure beryllium in Fig. 4(a) (white) and correspondingly black inFig. 4(b). The extent of oxidation appears unrelated to the grain orientation. The extracted spectra (Fig. 5(a) and (b)), show subtle changes occurring in the fine structure. The 570 eV EELS edge maxima shifts position relative to the
grain's percentage oxidation, whilst the intensity changes in 537 eV and 543 eV peaks. The beryllium fine structure at higher oxidation, loses the 113 eV edge. Instead, under oxidation 2 new peaks at 120 and 125 eV occur with intensity varying with oxidation levels. These peak varia-tions are consistent with the fine structures reported in[23]. Analysis of the zero-loss region may provide evidence of hydrogen isotopes in the samples[24]. Currently an edge at 19–20 eV agrees with deuterium presence in[24], however whether this is the result of deuterium; or a beryllium or oxide plasmon remains to be seen.
Fig. 3. Top) Scanning Transmission Electron Micrograph HAADF image (overview of lamella), a) background subtracted tungsten EDX map, b) background
sub-tracted carbon EDX map, c) background subsub-tracted oxygen EDX map, and d) background subsub-tracted nickel EDX map. Figures include some use of colour. The reader is referred to the online version of the paper.
Fig. 4. EELS atomic percentage maps showing variations in stoichiometries of the Beryllium and oxygen edges of the melted region (a) and (b); and Beryllium and
Oxygen edges from a co-deposited area of the limiter tile 2XR10 (inner poloidal limiter) (c) and (d). The extracted spectra from positions 1–5 of the melted dump plate and positions 6–8 of the codeposit are shown inFig. 5. Figures include some use of colour. The reader is referred to the online version of the paper.
Fig. 5. EELS spectra extracted from:Fig. 4showing the fine structures of the melted regions (a and b) and codeposited regions (c and d) respectively. Figure 5a) the beryllium ∼113 eV edge in oxidised grains (positions 1 and 2) and less oxidised grains (positions 3 and 4) and b) corresponding oxide edges at ∼540 eV of positions 1–4. Figure 5c) beryllium 113 eV edge of the codeposit and d) the oxide edge of the codeposit. Figures include use of colour. The reader is referred to the online version of the paper.
3.2. Oxidation in co-deposits
Comparatively, results from deposits formed on the inner wall limiter deposition zone (the shadowed wing region) show approxi-mately 2 µm of deposit formed above the surface of a surface oxide. The two oxide phases clearly show the differences in oxidation between metallic oxidation at the surface, and surface co-deposition.Fig. 5(c) and (d), show the fine edge structures extracted from position 6 (the deposit), position 7 (the crystalline oxide) and position 8 (the original beryllium surface). The fine structure of the oxide edge is significantly changed between deposits containing 20–35at% O and crystalline BeO, oxidized at the surface. The two oxide edges at ∼539 and 545 eV are much broader and less intense at the co-deposit site, whilst the broader peak at ∼570 eV is not visible. The co-deposit's beryllium fine structure (Fig. 5(c)) (position 6) retains greater likeness with bulk beryllium than a metallic oxide; maintaining the 113 eV edge.
The melted region occurs with grains ranging from no oxidation, to ∼10%, ∼20, ∼30% and ∼46% oxidation (Table 2). The level of oxi-dation within the deposit is more uniform, within 20–35%. The de-posited region shows an amorphous nature with ring patterns in the TEM under selected area diffraction. The deposited material appears much less ordered with at best nanometric scale horizontal regions of BeO far from stoichiometric ratios of 1:1.
3.3. Thermal desorption
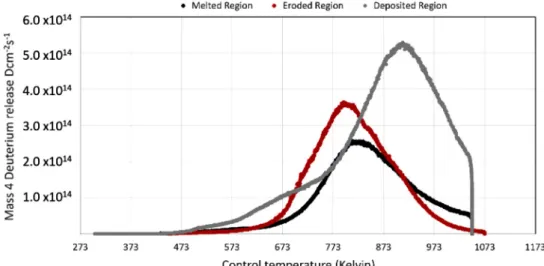
TEM has shown eroded central regions of the limiter tiles are the most ordered. Preliminary TEM found a low density of dislocations present in the material, almost no surface oxidation, and large uniform 1–3 µm grains in eroded regions (Fig. 6(b)). The relative micro-structural simplicity of eroded materials (compared to melted and co-deposited regions), provides the best starting point for modelling des-orption of fuel from TDS measurements via the Tritium Migration Analysis Program (TMAP7). Data from Ion Beam Analysis (IBA) are compiled to give a starting distribution of implanted Deuterium, with the main segment of the code being a beryllium block. Diffusion is enabled throughout the block structure and recombination limited re-lease governs at the surface. Agreement between experimental data and the code has been successful, however on application of the same ap-proach to the deposited material, almost no agreement stands between the desorption peak position and the modelled result. A similar ex-perience has occurred with the oxidation seen in melted material. Early efforts to apply a surface binding energy to the oxide equivalent to that of the Be-OD bond energy have been attempted. The comparative raw data of desorption between an eroded region, a melted region and a deposited region of the 2010–12 campaign are given for completeness (Fig. 7). The melted region has comparably lower retention levels than
those seen in both the eroded and deposited regions. The deposited material remains the highest mechanism of retention. The highly porous sedimentary like structure of the deposit (Fig. 6(a)) with respect to the eroded surface, suggests that the desorption kinetics of the ma-terial are significantly altered from crystalline beryllium. It is suggested physical processes such as surface area and surface tension have greater effect on the trapping behaviour in these materials than diffusivities. Further investigation of these traits with TMAP7 is planned and will be published in the future. From the raw data, the desorption peak position of the melted material has shifted to higher temperatures of ∼825 K, than its eroded counterpart. The deposited material has an initial re-lease at ∼675 K followed by a much larger rere-lease at 925 K; compared to the single peak release of both the eroded and melted materials. Finally, desorption in the deposited material is incomplete at the maximum operating temperature of the TDS, prior to beryllium eva-poration.
4. Conclusion
The first results of EELS analysis following the discovery of the Be-OD bond with Raman have been reported [17]. The EELS results compliment those seen with Raman. Complex oxidation is present in the sample with two or more phases present. Ongoing modelling work, and EELS with standardised BeO materials is occurring to determine the influence of deuterium presence on the EELS fine structure and enable further stoichiometric characterisation of the BeOxDybond. EELS unlike Raman can view the sub-surface structure beyond 50 nm. Early appli-cation of these microstructural findings to desorption data continue. The results of desorption modelling will be the subject of future pub-lication. Whilst the discovery of the Be-OD bond is interesting, overall retention resulting from its formation appears limited in JET due to low levels of melted material. In 2010–11 (ILW1) ∼19 g of melted material is estimated in the dump plate region, 134 g in 2012–13 (ILW2), and ∼30 g in 2014–15 (ILW3). Retention in the first 0–3 µm of these limited wall areas is unlikely to significantly contribute to overall hydrogen retained across the reactor. Nevertheless, if operation conditions in ITER enable higher wall temperatures for longer periods in steady state, with greater ELMs and displacement events, oxide formation and che-mical retention could be substantial[25]. The raw TDS data suggests the presence of an oxide bond at the surface has led to higher deso-rption peak temperatures relative to eroded surface regions. Post dy-namic out-gassing; a situation could exist under higher temperature operation, where an increase in diffusion is seen into the bulk [25], alongside creation of a surface barrier. A previous study[26]found oxidation did not lead to a desorption barrier. Whilst JET's desorption results show some similarities, with similar peak desorption tempera-tures between the melted region and their oxidised samples (with a reasonable range of uncertainty)[27]; no early release is seen, enabling the possibility of barrier behaviour. Other factors such as cracking could decrease retention overall and expediate release mechanisms. The overall outcome of chemical bond formation on desorption is therefore complex. JET's current TDS data shows melted materials re-tain lower levels of deuterium than co-deposited counterparts. How-ever, the desorption appears incomplete and a tail into higher tem-peratures could exist with the possibility of longer and higher temperature programmed desorption required, which could affect ITER baking operations.
Funding statement
“This work has been carried out within the framework of the EUROfusion Consortium and has received funding from the Euratom research and training programme 2014–2018 under grant agreement no 633053. The views and opinions expressed herein do not necessarily reflect those of the European Commission.”
“The research used UKAEA's Materials Research Facility, which has
Fig. 6. a) Porous structure of the deposit, showing nanoscale voids potentially
enabling D2gas retention, b) TEM bright field image of eroded material, showing gas filled cavities along grain boundaries in crystalline metallic ber-yllium. Figures include some use of colour. The reader is referred to the online version of the paper.
been funded by and is part of the UK's National Nuclear User Facility and Henry Royce Institute for Advanced Materials.”
Supplementary materials
Supplementary material associated with this article can be found, in the online version, atdoi:10.1016/j.nme.2019.02.022.
References
[1] K. Heinola, A. Widdowson, J. Likonen, E. Alves, N. Barradas, S. Brezinsek, N. Catarino, P. Coad, S. Koivuranta, S. Krat, G.F. Matthews, M. Mayer, P. Petersson, J.E.T. Contributors, Long-term fuel retention in JET ITER- like wall, Phys. Scr. T167 (2016) 1–7.
[2] J. Roth, R. Doerner, M. Baldwin, T. Dittmar, H. Xu, K. Sugiyama, M. Reinelt, C. Linsmeier, M. Oberkofler, Oxidation of beryllium and exposure of beryllium oxide to deuterium plasmas in PISCES B, J. Nucl. Mater. 438 (Suppl) (2013) 1044–1047.
[3] D.W. Aylmore, S.J. Gregg, W.B. Jepson, The high temperature oxidation of ber-yllium. Part I. In dry oxygen, J. Nucl. Mater. 2 (2) (1960) 169–175.
[4] A. Allouche, Quantum modeling of hydrogen retention on partially oxidized ber-yllium, J. Nucl. Mater. 415 (1 Suppl) (2011) S721–S723.
[5] S. Zalkind, M. Polak, N. Shamir, Adsorption of hydrogen on clean and oxidized beryllium studied by direct recoil spectrometry, Appl. Surf. Sci. 115 (3) (1997) 273–278.
[6] S. Zalkind, M. Polak, and N. Shamir, “The adsorption of H2O vs O2 on Beryllium,” vol. 385, pp. 318–327, 1997.
[7] D.A. Petti, G.R. Smolik, R.A. Anderl, On the mechanisms associated with the che-mical reactivity of Be in steam, J. Nucl. Mater. 283–287 (Part II) (2000) 1390–1395. [8] S. Zalkind, M. Polak, N. Shamir, Effects of preadsorbed hydrogen on the adsorption
of O2, CO and H2O on beryllium, Surf. Sci. 539 (1–3) (2003) 81–90. [9] S. Zalkind, M. Polak, N. Shamir, Oxidation of ion-bombarded vs. annealed
ber-yllium, Surf. Sci. 513 (3) (2002) 501–510.
[10] A. Allouche, M. Oberkofler, M. Reinelt, C. Linsmeier, Quantum modeling of hy-drogen retention in beryllium bulk and vacancies, J. Phys. Chem. C 114 (8) (2010) 3588–3598.
[11] A. Allouche, Quantum modeling of hydrogen retention on partially oxidized ber-yllium, J. Nucl. Mater. 415 (1 Suppl) (2011) S721–S723.
[12] A. Widdowson, A. Baron-Wiechec, P. Batistoni, E. Belonohy, J.P. Coad, P. Dinca, D. Flammini, F. Fox, K. Heinola, I. Jepu, J. Likonen, S. Lilley, C.P. Lungu, G.F. Matthews, J. Naish, O. Pompilian, C. Porosnicu, M. Rubel, R. Villari, Experience of handling beryllium, tritium and activated components from JET ITER like wall, Phys. Scr. T167 (1) (2016) 014057.
[13] M. Rubel, J.P. Coad, A. Widdowson, G.F. Matthews, H.G. Esser, T. Hirai, J. Likonen,
J. Linke, C.P. Lungu, M. Mayer, L. Pedrick, C. Ruset, Overview of erosion-deposition diagnostic tools for the ITER-Like Wall in the JET tokamak, J. Nucl. Mater. 438 (Suppl) (2013) S1204–S1207.
[14] C. Lungu, I. Mustata, V. Zaroschi, A. Lungu, A. Anghel, P. Chiru, M. Rubel, P. Coad, G. Matthews, Beryllium coatings on metals for marker tiles at JET:development of process and characterization of layers, Physica Scripta T128 (2007) 157–161. [15] P. Hovington, D. Drouin, R. Gauvin, CASINO: a new Monte Carlo code in C language
for electron beam interaction -part I: description of the program, Scanning 19 (1) (2006) 1–14.
[16] J. Schindelin, I. Arganda-Carreras, E. Frise, V. Kaynig, M. Longair, T. Pietzsch, S. Preibisch, C. Rueden, S. Saalfeld, B. Schmid, J.-Y. Tinevez, D.J. White, V. Hartenstein, K. Eliceiri, P. Tomancak, A. Cardona, Fiji: an open-source platform for biological-image analysis, Nat. Methods 9 (7) (Jul. 2012) 676–682. [17] M. Kumar, C. Makepeace, C. Pardanaud, E.Hodille Y.Ferro, C. Martin, P. Roubin,
A. Widdowson, T. Dittmar, Ch. Linsmeier, C.P. Lungu, C. Porosnicu, I. Jepu, P. Dinca, M. Lungu, O.G. Pompilian, Identification of BeO and BeOxDy in melted zones of the JET Be limiter tiles: raman study using comparison with laboratory samples, Nucl. Mater. Energy 17 (2018) 295–301.
[18] M. Schaffer, B. Schaffer, Q. Ramasse, “Sample preparation for atomic-resolution STEM at low voltages by FIB,” vol. 114, pp. 62–71, 2012.
[19] C.A. Thompson and L. Andrews, “Reactions of laser ablated Be atoms with H2O : infrared spectra and density functional calculations of HOBeOH, HBeOH, and HBeOBeH,” vol. 1, no. 96, pp. 12214–12221, 1996.
[20] E.A. Hodille, Y. Ferro, Z.A. Piazza, C. Pardanaud, Hydrogen in beryllium oxide investigated by DFT: on the relative stability of charged-state atomic versus mole-cular hydrogen, J. Phys. Condens. Matter 30 (30) (Aug. 2018) 305201. [21] C. Pardanaud, C. Martin, C. Pardanaud, C. Martin, and P. Roubin, “Raman
Microscopy: a suitable tool for characterizing surfaces in interaction with plasmas in the field of nuclear fusion,” in Raman Spectrosc. Appl., p. 30. 2017.
[22] C. Pardanaud, M.I. Rusu, G. Giacometti, C. Martin, Y. Addab, P. Roubin, C.P. Lungu, C. Porosnicu, I. Jepu, P. Dinca, M. Lungu, O.G. Pompilian, R. Mateus, E. Alves, and M. Rubel, “Raman microscopy investigation of beryllium materials,” 2016. [23] H.H. Madden, R. Landers, G.G. Kleiman, D.M. Zehner, Oxygen-induced changes in
electron-energy-loss spectra for Al, Be and Ni, J. Vac. Sci. Technol. A 17 (5) (1999) 2719–2730.
[24] V.P. Afanas'ev, A.S. Gryazev, P.S. Kaplya, M. Köppen, O.Y. Ridzel, N.Y. Subbotin, P. Hansen, Investigation of deuterium implantation into beryllium sample by electron energy loss spectroscopy, J. Phys. Conf. Ser. 891 (1) (Nov. 2017) 012303. [25] R.W. Conn, R.P. Doerner, J. Won, Beryllium as the plasma-facing material in fusion energy systems—experiments, evaluation, and comparison with alternative mate-rials, Fusion Eng. Des. 37 (4) (1997) 481–513.
[26] P. Zhang, J. Zhao, B. Wen, Retention and diffusion of H, He, O, C impurities in Be, J. Nucl. Mater. 423 (1–3) (2012) 164–169.
[27] J. Roth, W.R. Wampler, M. Oberkofler, S. van Deusen, S. Elgeti, Deuterium reten-tion and out-gassing from beryllium oxide on beryllium, J. Nucl. Mater. 453 (1–3) (2014) 27–30.
Fig. 7. Thermal Desorption data of an eroded, melted and deposited castellation. The deposited region release is limited by the maximum operating temperature of