Abstract. Mesenchymal stromal cells (MSCs) are a potential cell source for the development of therapeutic products. Recent studies have shown that the transplantation of MSCs to damaged organs, including the heart, liver and kidneys, results in the restoration of the damaged tissues. However, the mechanisms underlying this regeneration process have yet to be clearly characterized. Consequently, in this study, we focused on the therapeutic potential of MSCs in injured liver tissue by evaluating the gene expression profiles of MSCs in the presence of injured liver and normal liver cells using a microarray chip containing 44,000 genes. In order to mimic the state of liver cell regeneration in vitro, we respectively co-cultured MSCs with CCl4-injured liver cells and normal liver cells from C57BL/6 female mice. After 48 h of co-culturing, MSCs were collected and the RNA was extracted for micro-array analysis. Under conditions of co-culture with normal liver cells, upregulated expression of CXCR6, CCR3, IL-2, IL-11, CD34, CD74, procollagen, FMS-like tyrosine kinase, neuregulin 4, Wnt2 and catenins was noted. Under conditions of co-culture with the CCl4-injured liver cells, expression of CXCL2, cytoglobin, erythropoietin, v-Erb, hypoxia-inducible factor 3 (·subunit), retinoic acid receptor ß and Vav2 was upregulated. Our research provides information regarding the differential molecular mechanisms that regulate the properties of MSCs in the regeneration of injured liver tissue.
Introduction
Bone marrow (BM) contains heterogenous cells consisting of hematopoietic stem cells (HSCs) and stromal cells, which support the development of HSCs. Among such cells, multipotent stromal cells, or mesenchymal stromal cells (MSCs), perform a supportive role as stromal cells in BM, and also possess the potential to differentiate into a variety of cell types, including osteocytes, chondrocytes, adipocytes
and neuronal cells. Recently, the differentiation of MSCs into hepatic cell lineages has been reported. This implies that MSCs might potentially be employed as a source of cell-based therapy for the purpose of tissue regeneration (1,2).
MSCs of this type residing in the BM can differentiate into hepatic cells, which express the liver-specific markers albumin, ·-fetoprotein and cytokeratin 18 as a result of stimulation with stem cell factor, epidermal growth factor and hepatocyte growth factor (3). MSCs can also be differentiated into hepatic lineage cells by co-culturing with liver tissues. In previous studies, MSCs were co-cultured with fetal liver cells (1) or liver cells, and were shown to differentiate into functional liver cells secreting albumin and urea after 48 h of co-culture (2).
We previously reported that BM cells ameliorate the pathologic conditions of CCl4-induced liver injury in mice (4). As MSCs derived from BM are one source of stem cells toward hepatic lineage, they principally differentiate into functional hepatocytes and may contribute to the regeneration of injured liver tissues. Therefore, we analyzed the gene expression profile of MSCs co-cultured with liver cells that mimicked the liver microenvironment in vitro. The gene expression profiles of MSCs were assessed after co-culturing with normal liver cells or with liver cells from CCl4-injected mice via a microarray technique.
Materials and methods
Mice. Six-week-old C57BL/6 mice were purchased from Koatec (Pyung-Taek, Korea). All mice were bred and housed under specific pathogen-free conditions. All procedures were approved by the Animal Care and Use Committee of the Ewha Womans University School of Medicine.
Cell culture
Isolation and culture of MSCs. Six- to eight-week-old C57BL/6 female mice were sacrificed by cervical dislocation and their limbs were removed. The BM was flushed from the medullary cavities of both the femurs and tibias with serum-free RPMI-1640 medium (Gibco BRL, Carlsbad, CA) using a 25-gauge needle, filtrated through nylon meshes and centri-fugated for 5 min at 1,200 rpm. Isolated BM cells were then incubated in RBC lysis solution (0.15 M NH4Cl, 10 mM NaHCO3, 10 mM EDTA) and washed twice with phosphate-buffered saline (PBS). The cells were then plated at 1x10⁷cells/ 100 culture dishes in Iscove's Modified Dulbecco's Medium (IMDM; Sigma, St. Louis, MO) with 10% heat-inactivated
Gene expression profile of mesenchymal stromal cells
after co-culturing with injured liver tissue
KYUNG-AH CHO1, SUN-YOUNG JU1, KYUNG-HA RYU2 and SO-YOUN WOO1
Departments of 1Microbiology, and 2Pediatrics, School of Medicine, Ewha Womans University, Seoul, Korea Received September 19, 2008; Accepted November 10, 2008
DOI: 10.3892/mmr_00000061
_________________________________________
Correspondence to:Dr So-Youn Woo, Department of Microbiology, School of Medicine, Ewha Womans University, 911-1 Mok-6-Dong, Yang-chun-gu, 158-710 Seoul, Korea
E-mail: soyounwoo@ewha.ac.kr
Key words:mesenchymal stromal cells, liver injury, microarray, gene expression
fetal bovine serum (FBS). After 48 h, non-adherent cells were removed via aspiration, and the Mesencult basal medium with 10% mesenchymal stem cell stimulatory supplement (Stem Cell Technologies, Vancouver, Canada; cat. nos. 05501 and 05502) was replenished. Three weeks from the BM isolation, all MSCs used in this study were at 4 passages.
Adipogenic differentiation. MSCs cultured for 3 weeks following primary culture were plated on Mesencult basal medium containing 10% adipogenic stimulatory supplement (Stem Celfigl Technologies; cat. no. 05401). The medium was replenished once every 3 days for 2 weeks.
Liver cell isolation. Six-week-old mice were injected once a day with 10% CCl4(10 μl per gram) in mineral oil via the intraperitoneal route for two consecutive days. After 1 week, the mice were sacrificed and their liver tissues were collected aseptically followed by 30 min of collagenase treatment (0.5 mg/ml in RPMI-1640 with 10% FBS; Roche, Indianapolis, IN) at 37˚C. Liver cells were isolated from the collagenase-treated liver tissue following filtration through nylon meshes. For the co-culturing of liver cells and MSCs, the MSCs (5x10⁵cells/well) were plated onto the lower chambers of transwell culture plates (Falcon, Bedford, MA), while the liver cells (3x10⁵/well) were introduced into the inserted upper-chamber (3 μm in pore size) with Dulbecco's modified Eagle's medium (Fig. 1H). After 48 h of co-culture, the inserted upper chambers were removed, and the MSCs in the lower chamber were collected for RNA isolation.
Flow cytometry. MSCs were analyzed for cell surface marker expression after culturing for 3 weeks. The cells were washed with PBS and stained at 4˚C for 30 min with a combination of the following antibodies: FITC-anti-mouse CD106, FITC-anti-mouse CD34, FITC-anti-mouse CD31, PE-anti-mouse CD73, PE-anti-mouse CD105, PE-anti-mouse CD45. All antibodies were purchased from BD Pharmingen with the exception of PE-anti-mouse CD105, which was obtained from R&D Systems (Minneapolis, MN). Flow cyto-metric analysis was performed using FACSCalibur and CellQuest software (BD).
Tissue preparation. The liver was perfused via the heart with 4% paraformaldehyde to flush out blood cells, then incubated with 4% paraformaldehyde overnight at room temperature for fixation. After washing twice with water, fixed livers were stored in 70% ethanol at 4˚C and embedded in paraffin. Sections were stained with hematoxylin and eosin. Cell staining
Albumin staining. MSCs co-cultured with liver cells or not, as described above, were fixed for 10 min in ice-cold methanol. The cells were treated with 1% BSA in PBST (0.05% Tween-20 in PBS) for 30 min to block the unspecific binding of antibodies, then incubated overnight in primary antibody against albumin (Abcam; cat. no. ab19196) at 4˚C (1:800). The next day, the secondary antibody, biotinylated anti-rabbit IgG (DakoCytomation, Denmark) was applied for 30 min. Albumin expression was detected via the streptovidin-HRP/DAB substrate (DakoCytomation) reaction.
Giemsa staining. After 14 days of MSC culture, colony forming units of fibroblasts (CFU-F) were assessed after Giemsa staining. Cells fixed in methanol for 5 min were completely dried, and Giemsa stain solution was added.
Adipocyte staining. Adipocytes differentiated from MSCs were stained with Oil Red O solution. First, the cells were fixed for 5 min in 10% formalin and incubated for 1 h in newly changed 10% formalin. After washing with 60% isopropanol, the cells were dried completely and treated for 1 h with Oil Red O solution.
Isolation of total RNA. Total RNA was extracted from adherent MSCs co-cultured with normal liver tissue or liver tissue from CCl4-injected mice, as well as from MSCs without co-culture, using TRIzol solution (Invitrogen, Carlsbad, CA) in accordance with the manufacturer's instructions. RNA samples were stored at -70˚C until future use.
Microarray analysis. Two-color microarray-based Agilent chips containing 44,000 mouse genes (Digital Genomics, Seoul, Korea) were utilized. Total RNA (50 μg) was prepared from 3 groups of MSCs: the MSC group (untreated MSCs), the liver group (from MSCs co-cultured with normal liver cells) and the CCl4liver group (from MSCs co-cultured with the livers of CCl4-injected mice). Samples from the MSC group were labeled with Cy5 while samples from the liver group were labeled with Cy3, and RNA samples from the MSC group were utilized as RNA references for the compar-ison of gene expression profiles. These microarray experiments were repeated three times for the different RNA batches. Genes were selected on the basis of differential Cy3/Cy5 expression ratios ≥2 in response. Gene clustering was generated from the gene expression data using Cluster and TreeView software (Eisen Lab; http://rana.lbl.gov/EisenSoftware.htm). Additional filtering was applied with a 2-fold change minimum to analyze the genes expressed in mouse liver tissue using Ingenuity Pathway Analysis (IPA) software (Ingenuity Systems, Redwood City, CA; http://www.ingenuity.com/).
Results
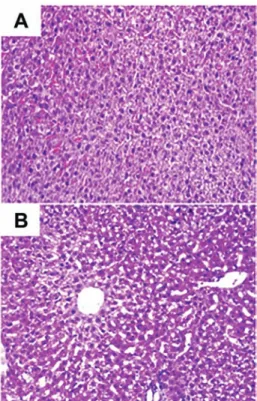
Before the liver cells from CCl4-injected mice were isolated, liver tissue from the normal (control) and CCl4-injected mice was fixed and stained with H&E (Fig. 1) so that differences between the two groups might be examined. Fig. 1A and B show characteristic features of the mouse liver, such as aniso-cytosis (an uneven size of liver cells) and anisokaryosis (an uneven size of liver cell nuclei). In Fig. 1B, a liver section from a CCl4-injected mouse exhibits vacuolization of the liver cells, indicating that the cells were damaged by the CCl4injection.
In order to characterize the MSCs from the liver group, a CFU-F assay was performed (Fig. 2B) and the isolated MSCs were induced to differentiate into adipocytes (Fig. 2C) to confirm their multipotential differentiation. Additionally, CD73, CD105 and CD106 expression, as well as the negative expression of CD31, CD34 and CD45, was observed (Fig. 2D).
To assess the gene expression profiles of the MSCs from the liver and CCl4liver groups, we co-cultured liver cells in the upper chamber and MSCs in the lower chamber of transwell plates (Fig. 3). After 48 h of transwell culture, the upper chamber was removed and the cells from the lower chamber, containing MSCs stimulated by liver cells or injured liver cells, were collected. Next, RNAs from the cells of the lower chamber were isolated. Co-culture and RNA isolation was
repeated three times for each of the experimental groups, and the expression profile was presented as the mean values from these three microchip assay analyses.
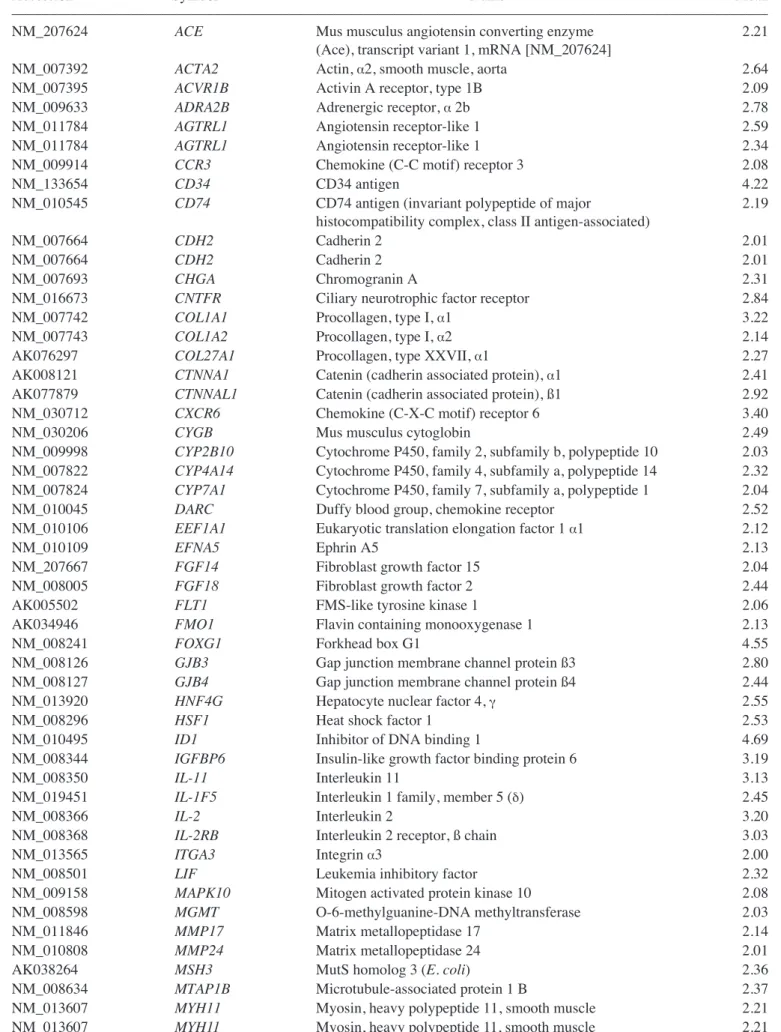
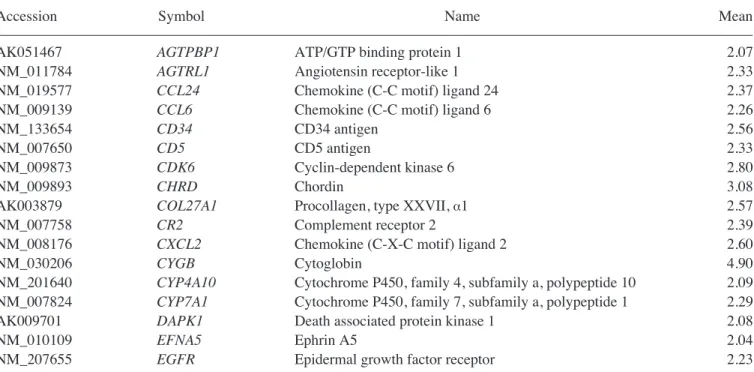
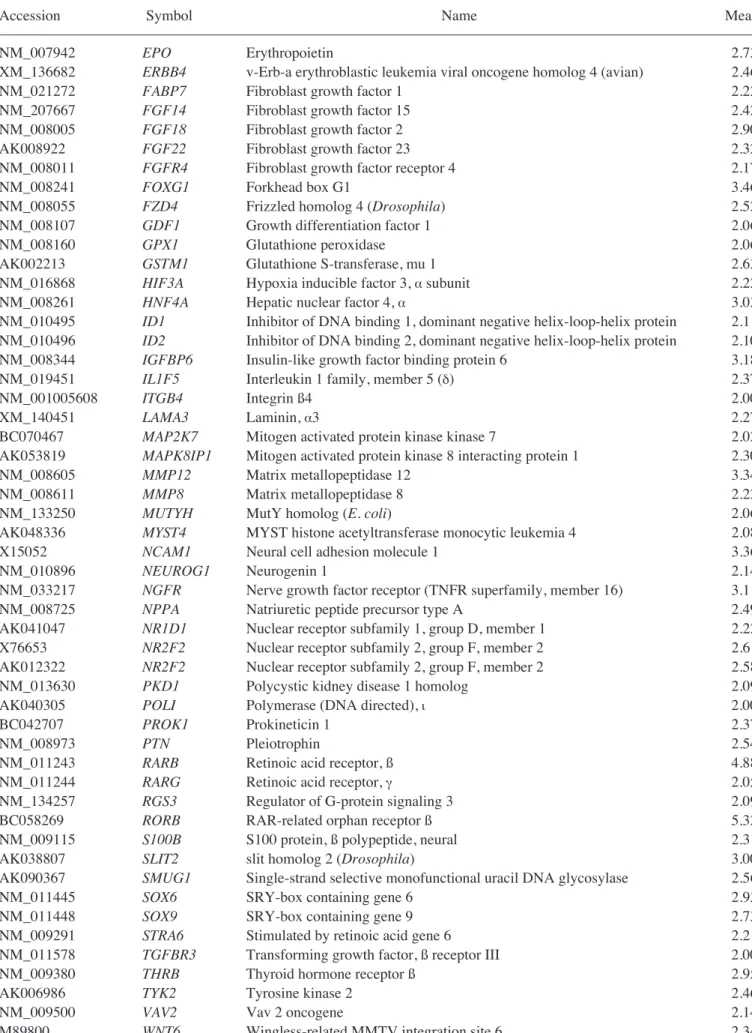
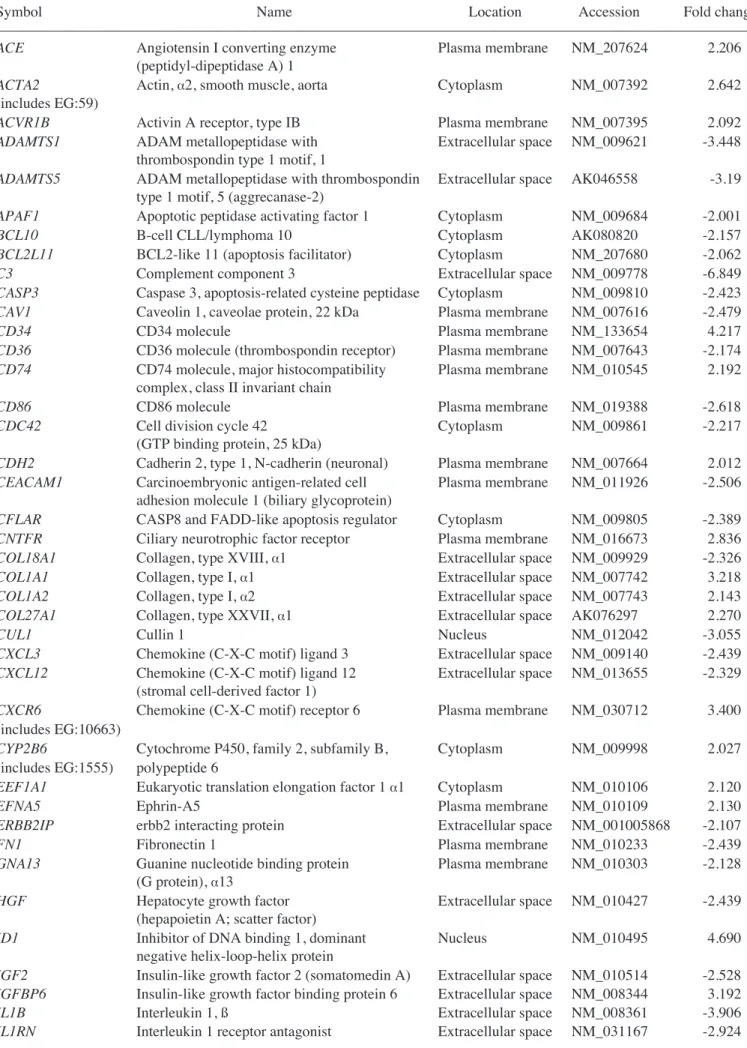
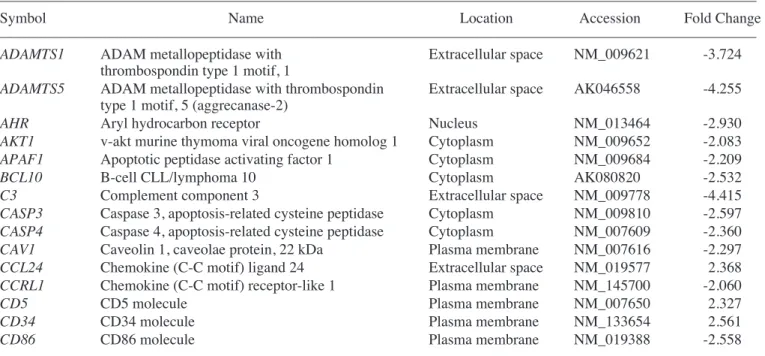
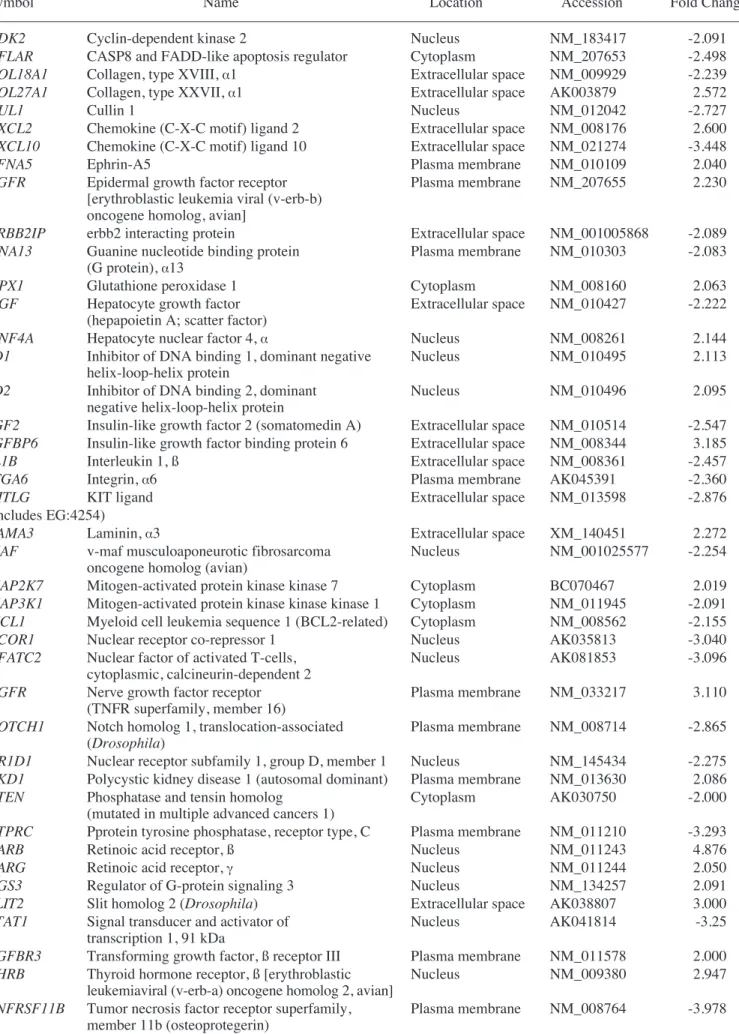
Genes upregulated in the liver group as compared with the untreated MSC group are listed in Table I. Genes upregulated in the CCl4liver group as compared with the MSC group are shown in Table II. In addition, Tables III and IV show IPA-filtered genes that evidenced a >2-fold change in the gene expression of MSCs from the liver and CCl4liver groups, respectively. The results of microarray analysis of MSCs from the liver group demonstrate that inhibitor of DNA binding 1, Forkhead box G1, Wnt2, CD34, CXCR6 (receptor for CXCL16), tissue inhibitor of metalloproteinase 3, periostin, procollagen type 1, IL-2, neuregulin 4, CCR3 (receptor for RANTES, MCP-2, -3, -4), IL-11, CD74 (Ii chain of class II MHC molecules) and catenins were upregu-lated. When co-cultured with the CCl4-injured liver cells, the expression of RAR-related orphan receptor ß, retinoic acid receptor ß, forkhead box G1, neural cell adhesion molecule 1, matrix metallopeptidase 12, insulin-like growth factor binding protein 6, nerve growth factor receptor, chordin, CXCL2, cytoglobin, erythropoietin, v-Erb, hypoxia inducible factor 3 (·subunit), Vav2 and hepatic nuclear factor 4·was upregulated.
Immunostaining analysis of albumin was conducted on MSCs co-cultured with liver cells from mice treated or untreated with CCl4. After 48 h of co-culture with CCl4-treated liver cells, the MSCs expressed albumin (Fig. 4). Therefore, MSCs derived from BM cells seemed to differentiate into functional hepatocytes under the specific conditions provided by a damaged liver.
Figure 1. Representative sections of liver tissue stained with hematoxylin and eosin. (A) Normal liver. (B) Injured liver from a mouse 8 days after 2 consecutive injections of CCl4. White punctuated space among the liver cells
from CCl4-injected mice can be seen. (Original magnification, x200).
Figure 2. Preparation and characterization of isolated MSCs. The newly planted bone marrow cells were divided into adherent and non-adherent cells after 48 h of culture. (A) Adherent cells, or MSCs, proliferated and formed CFU-F. (B) This was confirmed by Giemsa staining on day 14. (C) MSCs cultured for 3 weeks were differentiated into adipocytes and stained red with Oil Red O (original magnification A-C, x100). (D) For the phenotypic markers, the MSC markers (CD73, CD105 and CD106) were positive. In contrast, the hematopoietic (CD34 and CD45) and endothelial (CD31) cell markers were not detectable in the cells after 21 days of culture.
Figure 3. Co-culturing of MSCs and liver cells in transwell plates. (A) MSCs and injured livers were established according to the indicated co-culture schedule. (B) MSCs co-cultured with normal or CCl4-injured liver cells on
the transwell insert co-culture system.
Figure 4. Albumin detection in co-cultured MSCs by immunocytochemistry. MSCs cultured alone (A) or co-cultured with normal liver cells (B) did not express albumin. However, MSCs co-cultured with CCl4-injected liver cells
Table I. Genes upregulated in MSCs co-cultured with normal liver cells.
–––––––––––––––––––––––––––––––––––––––––––––––––––––––––––––––––––––––––––––––––––––––––––––––––––––
Accession Symbol Name Mean
–––––––––––––––––––––––––––––––––––––––––––––––––––––––––––––––––––––––––––––––––––––––––––––––––––––
NM_207624 ACE Mus musculus angiotensin converting enzyme 2.21
(Ace), transcript variant 1, mRNA [NM_207624]
NM_007392 ACTA2 Actin, ·2, smooth muscle, aorta 2.64
NM_007395 ACVR1B Activin A receptor, type 1B 2.09
NM_009633 ADRA2B Adrenergic receptor, ·2b 2.78
NM_011784 AGTRL1 Angiotensin receptor-like 1 2.59
NM_011784 AGTRL1 Angiotensin receptor-like 1 2.34
NM_009914 CCR3 Chemokine (C-C motif) receptor 3 2.08
NM_133654 CD34 CD34 antigen 4.22
NM_010545 CD74 CD74 antigen (invariant polypeptide of major 2.19
histocompatibility complex, class II antigen-associated)
NM_007664 CDH2 Cadherin 2 2.01
NM_007664 CDH2 Cadherin 2 2.01
NM_007693 CHGA Chromogranin A 2.31
NM_016673 CNTFR Ciliary neurotrophic factor receptor 2.84
NM_007742 COL1A1 Procollagen, type I, ·1 3.22
NM_007743 COL1A2 Procollagen, type I, ·2 2.14
AK076297 COL27A1 Procollagen, type XXVII, ·1 2.27
AK008121 CTNNA1 Catenin (cadherin associated protein), ·1 2.41
AK077879 CTNNAL1 Catenin (cadherin associated protein), ß1 2.92
NM_030712 CXCR6 Chemokine (C-X-C motif) receptor 6 3.40
NM_030206 CYGB Mus musculus cytoglobin 2.49
NM_009998 CYP2B10 Cytochrome P450, family 2, subfamily b, polypeptide 10 2.03
NM_007822 CYP4A14 Cytochrome P450, family 4, subfamily a, polypeptide 14 2.32
NM_007824 CYP7A1 Cytochrome P450, family 7, subfamily a, polypeptide 1 2.04
NM_010045 DARC Duffy blood group, chemokine receptor 2.52
NM_010106 EEF1A1 Eukaryotic translation elongation factor 1 ·1 2.12
NM_010109 EFNA5 Ephrin A5 2.13
NM_207667 FGF14 Fibroblast growth factor 15 2.04
NM_008005 FGF18 Fibroblast growth factor 2 2.44
AK005502 FLT1 FMS-like tyrosine kinase 1 2.06
AK034946 FMO1 Flavin containing monooxygenase 1 2.13
NM_008241 FOXG1 Forkhead box G1 4.55
NM_008126 GJB3 Gap junction membrane channel protein ß3 2.80
NM_008127 GJB4 Gap junction membrane channel protein ß4 2.44
NM_013920 HNF4G Hepatocyte nuclear factor 4, Á 2.55
NM_008296 HSF1 Heat shock factor 1 2.53
NM_010495 ID1 Inhibitor of DNA binding 1 4.69
NM_008344 IGFBP6 Insulin-like growth factor binding protein 6 3.19
NM_008350 IL-11 Interleukin 11 3.13
NM_019451 IL-1F5 Interleukin 1 family, member 5 (‰) 2.45
NM_008366 IL-2 Interleukin 2 3.20
NM_008368 IL-2RB Interleukin 2 receptor, ß chain 3.03
NM_013565 ITGA3 Integrin ·3 2.00
NM_008501 LIF Leukemia inhibitory factor 2.32
NM_009158 MAPK10 Mitogen activated protein kinase 10 2.08
NM_008598 MGMT O-6-methylguanine-DNA methyltransferase 2.03
NM_011846 MMP17 Matrix metallopeptidase 17 2.14
NM_010808 MMP24 Matrix metallopeptidase 24 2.01
AK038264 MSH3 MutS homolog 3 (E. coli) 2.36
NM_008634 MTAP1B Microtubule-associated protein 1 B 2.37
NM_013607 MYH11 Myosin, heavy polypeptide 11, smooth muscle 2.21
Table I. Continued.
–––––––––––––––––––––––––––––––––––––––––––––––––––––––––––––––––––––––––––––––––––––––––––––––––––––
Accession Symbol Name Mean
–––––––––––––––––––––––––––––––––––––––––––––––––––––––––––––––––––––––––––––––––––––––––––––––––––––
X15052 NCAM1 Neural cell adhesion molecule 1 2.25
NM_010875 NCAM1 Neural cell adhesion molecule 1 2.14
NM_010900 NFATC2IP Nuclear factor of activated T-cells, cytoplasmic, 2.10
calcineurin-dependent 2 interacting protein
NM_008700 NKX2-5 NK2 transcription factor related, locus 5 (Drosophila) 2.60
AK012322 NR2F2 Nuclear receptor subfamily 2, group F, member 2 2.91
X76653 NR2F2 Nuclear receptor subfamily 2, group F, member 2 2.40
NM_032002 NRG4 Neuregulin 4 3.19
NM_008814 PDX1 Pancreatic and duodenal homeobox 1 2.30
NM_015784 POSTN Periostin, osteoblast specific factor 3.28
NM_008969 PTGS1 Prostaglandin-endoperoxide synthase 1 2.31
NM_008973 PTN Pleiotrophin 2.76
NM_011243 RARB Retinoic acid receptor,ß 3.06
NM_009084 RPL37A Ribosomal protein L37a 2.10
NM_009115 S100B S100 protein, ß polypeptide, neural 2.55
NM_011347 SELP Selectin, platelet 2.07
AK038807 SLIT2 slit homolog 2 (Drosophila) 2.20
AK020817 SMUG1 Single-strand selective monofunctional uracil DNA glycosylase 2.14
NM_009235 SOX15 SRY-box containing gene 15 2.00
NM_011443 SOX2 SRY-box containing gene 2 2.56
NM_025285 STMN2 Stathmin-like 2 3.03
NM_019507 TBX21 T-box 21 2.20
NM_011595 TIMP3 Tissue inhibitor of metalloproteinase 3 3.31
NM_021406 TREM1 Triggering receptor expressed on myeloid cells 1 2.22
AK048623 TRP63 Transformation related protein 63 2.19
AK006986 TYK2 Tyrosine kinase 2 2.70
NM_011707 VTN Vitronectin 2.07
NM_023653 WNT2 Wingless-related MMTV integration site 2 4.22
NM_009523 WNT4 Wingless-related MMTV integration site 4 2.56
–––––––––––––––––––––––––––––––––––––––––––––––––––––––––––––––––––––––––––––––––––––––––––––––––––––
Table II. Genes upregulated in MSCs co-cultured with CCl4-injured liver cells.
–––––––––––––––––––––––––––––––––––––––––––––––––––––––––––––––––––––––––––––––––––––––––––––––––––––
Accession Symbol Name Mean
–––––––––––––––––––––––––––––––––––––––––––––––––––––––––––––––––––––––––––––––––––––––––––––––––––––
AK051467 AGTPBP1 ATP/GTP binding protein 1 2.07
NM_011784 AGTRL1 Angiotensin receptor-like 1 2.33
NM_019577 CCL24 Chemokine (C-C motif) ligand 24 2.37
NM_009139 CCL6 Chemokine (C-C motif) ligand 6 2.26
NM_133654 CD34 CD34 antigen 2.56
NM_007650 CD5 CD5 antigen 2.33
NM_009873 CDK6 Cyclin-dependent kinase 6 2.80
NM_009893 CHRD Chordin 3.08
AK003879 COL27A1 Procollagen, type XXVII, ·1 2.57
NM_007758 CR2 Complement receptor 2 2.39
NM_008176 CXCL2 Chemokine (C-X-C motif) ligand 2 2.60
NM_030206 CYGB Cytoglobin 4.90
NM_201640 CYP4A10 Cytochrome P450, family 4, subfamily a, polypeptide 10 2.09
NM_007824 CYP7A1 Cytochrome P450, family 7, subfamily a, polypeptide 1 2.29
AK009701 DAPK1 Death associated protein kinase 1 2.08
NM_010109 EFNA5 Ephrin A5 2.04
Table II. Continued.
–––––––––––––––––––––––––––––––––––––––––––––––––––––––––––––––––––––––––––––––––––––––––––––––––––––
Accession Symbol Name Mean
–––––––––––––––––––––––––––––––––––––––––––––––––––––––––––––––––––––––––––––––––––––––––––––––––––––
NM_007942 EPO Erythropoietin 2.73
XM_136682 ERBB4 v-Erb-a erythroblastic leukemia viral oncogene homolog 4 (avian) 2.46
NM_021272 FABP7 Fibroblast growth factor 1 2.22
NM_207667 FGF14 Fibroblast growth factor 15 2.42
NM_008005 FGF18 Fibroblast growth factor 2 2.90
AK008922 FGF22 Fibroblast growth factor 23 2.32
NM_008011 FGFR4 Fibroblast growth factor receptor 4 2.17
NM_008241 FOXG1 Forkhead box G1 3.46
NM_008055 FZD4 Frizzled homolog 4 (Drosophila) 2.52
NM_008107 GDF1 Growth differentiation factor 1 2.06
NM_008160 GPX1 Glutathione peroxidase 2.06
AK002213 GSTM1 Glutathione S-transferase, mu 1 2.63
NM_016868 HIF3A Hypoxia inducible factor 3, ·subunit 2.22
NM_008261 HNF4A Hepatic nuclear factor 4, · 3.03
NM_010495 ID1 Inhibitor of DNA binding 1, dominant negative helix-loop-helix protein 2.11 NM_010496 ID2 Inhibitor of DNA binding 2, dominant negative helix-loop-helix protein 2.10
NM_008344 IGFBP6 Insulin-like growth factor binding protein 6 3.18
NM_019451 IL1F5 Interleukin 1 family, member 5 (‰) 2.37
NM_001005608 ITGB4 Integrin ß4 2.00
XM_140451 LAMA3 Laminin, ·3 2.27
BC070467 MAP2K7 Mitogen activated protein kinase kinase 7 2.02
AK053819 MAPK8IP1 Mitogen activated protein kinase 8 interacting protein 1 2.30
NM_008605 MMP12 Matrix metallopeptidase 12 3.34
NM_008611 MMP8 Matrix metallopeptidase 8 2.22
NM_133250 MUTYH MutY homolog (E. coli) 2.06
AK048336 MYST4 MYST histone acetyltransferase monocytic leukemia 4 2.08
X15052 NCAM1 Neural cell adhesion molecule 1 3.36
NM_010896 NEUROG1 Neurogenin 1 2.14
NM_033217 NGFR Nerve growth factor receptor (TNFR superfamily, member 16) 3.11
NM_008725 NPPA Natriuretic peptide precursor type A 2.49
AK041047 NR1D1 Nuclear receptor subfamily 1, group D, member 1 2.22
X76653 NR2F2 Nuclear receptor subfamily 2, group F, member 2 2.61
AK012322 NR2F2 Nuclear receptor subfamily 2, group F, member 2 2.58
NM_013630 PKD1 Polycystic kidney disease 1 homolog 2.09
AK040305 POLI Polymerase (DNA directed), È 2.00
BC042707 PROK1 Prokineticin 1 2.37
NM_008973 PTN Pleiotrophin 2.54
NM_011243 RARB Retinoic acid receptor, ß 4.88
NM_011244 RARG Retinoic acid receptor, Á 2.05
NM_134257 RGS3 Regulator of G-protein signaling 3 2.09
BC058269 RORB RAR-related orphan receptor ß 5.32
NM_009115 S100B S100 protein, ß polypeptide, neural 2.31
AK038807 SLIT2 slit homolog 2 (Drosophila) 3.00
AK090367 SMUG1 Single-strand selective monofunctional uracil DNA glycosylase 2.56
NM_011445 SOX6 SRY-box containing gene 6 2.93
NM_011448 SOX9 SRY-box containing gene 9 2.73
NM_009291 STRA6 Stimulated by retinoic acid gene 6 2.21
NM_011578 TGFBR3 Transforming growth factor, ß receptor III 2.00
NM_009380 THRB Thyroid hormone receptor ß 2.95
AK006986 TYK2 Tyrosine kinase 2 2.46
NM_009500 VAV2 Vav 2 oncogene 2.14
M89800 WNT6 Wingless-related MMTV integration site 6 2.34
Table III. Gene expression profiles in MSCs co-cultured with normal liver cells.
–––––––––––––––––––––––––––––––––––––––––––––––––––––––––––––––––––––––––––––––––––––––––––––––––––––
Symbol Name Location Accession Fold change
–––––––––––––––––––––––––––––––––––––––––––––––––––––––––––––––––––––––––––––––––––––––––––––––––––––
ACE Angiotensin I converting enzyme Plasma membrane NM_207624 2.206
(peptidyl-dipeptidase A) 1
ACTA2 Actin, ·2, smooth muscle, aorta Cytoplasm NM_007392 2.642
(includes EG:59)
ACVR1B Activin A receptor, type IB Plasma membrane NM_007395 2.092
ADAMTS1 ADAM metallopeptidase with Extracellular space NM_009621 -3.448
thrombospondin type 1 motif, 1
ADAMTS5 ADAM metallopeptidase with thrombospondin Extracellular space AK046558 -3.19
type 1 motif, 5 (aggrecanase-2)
APAF1 Apoptotic peptidase activating factor 1 Cytoplasm NM_009684 -2.001
BCL10 B-cell CLL/lymphoma 10 Cytoplasm AK080820 -2.157
BCL2L11 BCL2-like 11 (apoptosis facilitator) Cytoplasm NM_207680 -2.062
C3 Complement component 3 Extracellular space NM_009778 -6.849
CASP3 Caspase 3, apoptosis-related cysteine peptidase Cytoplasm NM_009810 -2.423
CAV1 Caveolin 1, caveolae protein, 22 kDa Plasma membrane NM_007616 -2.479
CD34 CD34 molecule Plasma membrane NM_133654 4.217
CD36 CD36 molecule (thrombospondin receptor) Plasma membrane NM_007643 -2.174
CD74 CD74 molecule, major histocompatibility Plasma membrane NM_010545 2.192
complex, class II invariant chain
CD86 CD86 molecule Plasma membrane NM_019388 -2.618
CDC42 Cell division cycle 42 Cytoplasm NM_009861 -2.217
(GTP binding protein, 25 kDa)
CDH2 Cadherin 2, type 1, N-cadherin (neuronal) Plasma membrane NM_007664 2.012
CEACAM1 Carcinoembryonic antigen-related cell Plasma membrane NM_011926 -2.506
adhesion molecule 1 (biliary glycoprotein)
CFLAR CASP8 and FADD-like apoptosis regulator Cytoplasm NM_009805 -2.389
CNTFR Ciliary neurotrophic factor receptor Plasma membrane NM_016673 2.836
COL18A1 Collagen, type XVIII, ·1 Extracellular space NM_009929 -2.326
COL1A1 Collagen, type I, ·1 Extracellular space NM_007742 3.218
COL1A2 Collagen, type I, ·2 Extracellular space NM_007743 2.143
COL27A1 Collagen, type XXVII, ·1 Extracellular space AK076297 2.270
CUL1 Cullin 1 Nucleus NM_012042 -3.055
CXCL3 Chemokine (C-X-C motif) ligand 3 Extracellular space NM_009140 -2.439
CXCL12 Chemokine (C-X-C motif) ligand 12 Extracellular space NM_013655 -2.329
(stromal cell-derived factor 1)
CXCR6 Chemokine (C-X-C motif) receptor 6 Plasma membrane NM_030712 3.400
(includes EG:10663)
CYP2B6 Cytochrome P450, family 2, subfamily B, Cytoplasm NM_009998 2.027
(includes EG:1555) polypeptide 6
EEF1A1 Eukaryotic translation elongation factor 1 ·1 Cytoplasm NM_010106 2.120
EFNA5 Ephrin-A5 Plasma membrane NM_010109 2.130
ERBB2IP erbb2 interacting protein Extracellular space NM_001005868 -2.107
FN1 Fibronectin 1 Plasma membrane NM_010233 -2.439
GNA13 Guanine nucleotide binding protein Plasma membrane NM_010303 -2.128
(G protein), ·13
HGF Hepatocyte growth factor Extracellular space NM_010427 -2.439
(hepapoietin A; scatter factor)
ID1 Inhibitor of DNA binding 1, dominant Nucleus NM_010495 4.690
negative helix-loop-helix protein
IGF2 Insulin-like growth factor 2 (somatomedin A) Extracellular space NM_010514 -2.528
IGFBP6 Insulin-like growth factor binding protein 6 Extracellular space NM_008344 3.192
IL1B Interleukin 1, ß Extracellular space NM_008361 -3.906
Table III. Continued.
–––––––––––––––––––––––––––––––––––––––––––––––––––––––––––––––––––––––––––––––––––––––––––––––––––––
Symbol Name Location Accession Fold change
–––––––––––––––––––––––––––––––––––––––––––––––––––––––––––––––––––––––––––––––––––––––––––––––––––––
ITGA3 Integrin, ·3 (antigen CD49C, Plasma membrane NM_013565 2.002
·3 subunit of VLA-3 receptor)
ITGA6 Integrin, ·6 Plasma membrane AK045391 -2.551
KITLG KIT ligand Extracellular space NM_013598 -2.171
(includes EG:4254)
MAF v-maf musculoaponeurotic fibrosarcoma Nucleus NM_001025577 -2.309
oncogene homolog (avian)
MAPK9 Mitogen-activated protein kinase 9 Cytoplasm NM_207692 -2.003
MCL1 Myeloid cell leukemia sequence 1 (BCL2-related) Cytoplasm NM_008562 -2.547
MMP17 Matrix metallopeptidase 17 (membrane-inserted) Extracellular space NM_011846 2.142
MMP24 Matrix metallopeptidase 24 (membrane-inserted) Extracellular space NM_010808 2.012
NFATC2 Nuclear factor of activated T-cells, Nucleus AK081853 -2.237
cytoplasmic, calcineurin-dependent 2
NR3C1 Nuclear receptor subfamily 3, group C, Nucleus NM_008173 -2.134
member 1 (glucocorticoid receptor)
PTGS1 Prostaglandin-endoperoxide synthase 1 Cytoplasm NM_008969 2.310
(prostaglandin G/H synthase and cyclooxygenase)
PTPRC Protein tyrosine phosphatase, receptor type, C Plasma membrane NM_011210 -3.067
PTX3 Pentraxin-related gene, rapidly induced by IL-1 ß Extracellular space NM_008987 -2.182
RARB Retinoic acid receptor, ß Nucleus NM_011243 3.058
SELP Selectin P (granule membrane protein Plasma membrane NM_011347 2.070
140 kDa, antigen CD62)
SLIT2 Slit homolog 2 (Drosophila) Extracellular space AK038807 2.200
SOCS3 Suppressor of cytokine signaling 3 Cytoplasm NM_007707 -2.268
SPP1 Secreted phosphoprotein 1 Extracellular space NM_009263 -2.060
(osteopontin, bone sialoprotein I, early T-lymphocyte activation 1)
TNFRSF9 Tumor necrosis factor receptor Plasma membrane AK019885 -2.000
superfamily, member 9
TNFRSF11B Tumor necrosis factor receptor superfamily, Plasma membrane NM_008764 -2.538
member 11b (osteoprotegerin)
UBA1 Ubiquitin-like modifier activating enzyme 1 Cytoplasm NM_009457 -2.660
VTN Vitronectin Extracellular space NM_011707 2.070
–––––––––––––––––––––––––––––––––––––––––––––––––––––––––––––––––––––––––––––––––––––––––––––––––––––
Table IV. Gene expression profiles in MSCs co-cultured with CCl4-injured liver cells.
–––––––––––––––––––––––––––––––––––––––––––––––––––––––––––––––––––––––––––––––––––––––––––––––––––––
Symbol Name Location Accession Fold Change
–––––––––––––––––––––––––––––––––––––––––––––––––––––––––––––––––––––––––––––––––––––––––––––––––––––
ADAMTS1 ADAM metallopeptidase with Extracellular space NM_009621 -3.724
thrombospondin type 1 motif, 1
ADAMTS5 ADAM metallopeptidase with thrombospondin Extracellular space AK046558 -4.255
type 1 motif, 5 (aggrecanase-2)
AHR Aryl hydrocarbon receptor Nucleus NM_013464 -2.930
AKT1 v-akt murine thymoma viral oncogene homolog 1 Cytoplasm NM_009652 -2.083
APAF1 Apoptotic peptidase activating factor 1 Cytoplasm NM_009684 -2.209
BCL10 B-cell CLL/lymphoma 10 Cytoplasm AK080820 -2.532
C3 Complement component 3 Extracellular space NM_009778 -4.415
CASP3 Caspase 3, apoptosis-related cysteine peptidase Cytoplasm NM_009810 -2.597
CASP4 Caspase 4, apoptosis-related cysteine peptidase Cytoplasm NM_007609 -2.360
CAV1 Caveolin 1, caveolae protein, 22 kDa Plasma membrane NM_007616 -2.297
CCL24 Chemokine (C-C motif) ligand 24 Extracellular space NM_019577 2.368
CCRL1 Chemokine (C-C motif) receptor-like 1 Plasma membrane NM_145700 -2.060
CD5 CD5 molecule Plasma membrane NM_007650 2.327
CD34 CD34 molecule Plasma membrane NM_133654 2.561
Table IV. Continued.
–––––––––––––––––––––––––––––––––––––––––––––––––––––––––––––––––––––––––––––––––––––––––––––––––––––
Symbol Name Location Accession Fold Change
–––––––––––––––––––––––––––––––––––––––––––––––––––––––––––––––––––––––––––––––––––––––––––––––––––––
CDK2 Cyclin-dependent kinase 2 Nucleus NM_183417 -2.091
CFLAR CASP8 and FADD-like apoptosis regulator Cytoplasm NM_207653 -2.498
COL18A1 Collagen, type XVIII, ·1 Extracellular space NM_009929 -2.239
COL27A1 Collagen, type XXVII, ·1 Extracellular space AK003879 2.572
CUL1 Cullin 1 Nucleus NM_012042 -2.727
CXCL2 Chemokine (C-X-C motif) ligand 2 Extracellular space NM_008176 2.600
CXCL10 Chemokine (C-X-C motif) ligand 10 Extracellular space NM_021274 -3.448
EFNA5 Ephrin-A5 Plasma membrane NM_010109 2.040
EGFR Epidermal growth factor receptor Plasma membrane NM_207655 2.230
[erythroblastic leukemia viral (v-erb-b) oncogene homolog, avian]
ERBB2IP erbb2 interacting protein Extracellular space NM_001005868 -2.089
GNA13 Guanine nucleotide binding protein Plasma membrane NM_010303 -2.083
(G protein), ·13
GPX1 Glutathione peroxidase 1 Cytoplasm NM_008160 2.063
HGF Hepatocyte growth factor Extracellular space NM_010427 -2.222
(hepapoietin A; scatter factor)
HNF4A Hepatocyte nuclear factor 4, · Nucleus NM_008261 2.144
ID1 Inhibitor of DNA binding 1, dominant negative Nucleus NM_010495 2.113
helix-loop-helix protein
ID2 Inhibitor of DNA binding 2, dominant Nucleus NM_010496 2.095
negative helix-loop-helix protein
IGF2 Insulin-like growth factor 2 (somatomedin A) Extracellular space NM_010514 -2.547
IGFBP6 Insulin-like growth factor binding protein 6 Extracellular space NM_008344 3.185
IL1B Interleukin 1, ß Extracellular space NM_008361 -2.457
ITGA6 Integrin, ·6 Plasma membrane AK045391 -2.360
KITLG KIT ligand Extracellular space NM_013598 -2.876
(includes EG:4254)
LAMA3 Laminin, ·3 Extracellular space XM_140451 2.272
MAF v-maf musculoaponeurotic fibrosarcoma Nucleus NM_001025577 -2.254
oncogene homolog (avian)
MAP2K7 Mitogen-activated protein kinase kinase 7 Cytoplasm BC070467 2.019
MAP3K1 Mitogen-activated protein kinase kinase kinase 1 Cytoplasm NM_011945 -2.091
MCL1 Myeloid cell leukemia sequence 1 (BCL2-related) Cytoplasm NM_008562 -2.155
NCOR1 Nuclear receptor co-repressor 1 Nucleus AK035813 -3.040
NFATC2 Nuclear factor of activated T-cells, Nucleus AK081853 -3.096
cytoplasmic, calcineurin-dependent 2
NGFR Nerve growth factor receptor Plasma membrane NM_033217 3.110
(TNFR superfamily, member 16)
NOTCH1 Notch homolog 1, translocation-associated Plasma membrane NM_008714 -2.865
(Drosophila)
NR1D1 Nuclear receptor subfamily 1, group D, member 1 Nucleus NM_145434 -2.275
PKD1 Polycystic kidney disease 1 (autosomal dominant) Plasma membrane NM_013630 2.086
PTEN Phosphatase and tensin homolog Cytoplasm AK030750 -2.000
(mutated in multiple advanced cancers 1)
PTPRC Pprotein tyrosine phosphatase, receptor type, C Plasma membrane NM_011210 -3.293
RARB Retinoic acid receptor, ß Nucleus NM_011243 4.876
RARG Retinoic acid receptor, Á Nucleus NM_011244 2.050
RGS3 Regulator of G-protein signaling 3 Nucleus NM_134257 2.091
SLIT2 Slit homolog 2 (Drosophila) Extracellular space AK038807 3.000
STAT1 Signal transducer and activator of Nucleus AK041814 -3.25
transcription 1, 91 kDa
TGFBR3 Transforming growth factor, ß receptor III Plasma membrane NM_011578 2.000
THRB Thyroid hormone receptor, ß [erythroblastic Nucleus NM_009380 2.947
leukemiaviral (v-erb-a) oncogene homolog 2, avian]
TNFRSF11B Tumor necrosis factor receptor superfamily, Plasma membrane NM_008764 -3.978
member 11b (osteoprotegerin)
Discussion
In this study, we focused on the therapeutic potential of MSCs in injured liver tissues. Using a microarray containing 44,000 genes, we assessed the gene expression profiles of MSCs in the presence of injured liver cells and normal liver cells. The results demonstrate that MSC gene responses to co-culturing with liver cells occurred in a condition-specific manner.
The results of the microarray analysis of MSCs co-cultured with normal liver cells demonstrate that genes associated with the inflammatory process were upregulated; e.g., CXCR6 (receptor for CXCL16), CCR3 (receptor for RANTES, MCP-2, -3, -4), IL-MCP-2, IL-11, CD34 and CD74 (Ii chain of class II MHC molecules). Although CXCR6 (5), IL-11 (6) and CD34 (7) were reportedly expressed in human MSCs, these genes were also upregulated in mice MSCs co-cultured with normal liver cells. It is also worth noting that the expression of CD74, an invariant chain of class II MHC molecules, was upregulated. CD74 is required for the macrophage migration inhibitory factor-induced activation of the extracellular signal-regulated kinase-1/2 MAP kinase cascade, cell proliferation and PGE2production (8). The procollagen (type 1 and ·1) gene was also upregulated and is believed to be associated with the tissue repair process. Neuregulin 4 is one of the neuregulins, a diverse family of EGF-like ligands that are sensitive to ADAM (a disintegrin and metalloproteinase) for the cleavage of the extracellular domain (9). Wnt signaling affects the developmental process of stem cells, including MSCs. In MSCs, signaling via the Wnt/ß-catenin pathway stimulates osteoblastogenesis and inhibits adipogenesis by regulating the relative levels of tissue-specific transcription factors (10). It has also been reported that the Wnt/ß-catenin pathway contributes to the activation of liver progenitor cells (11). Therefore, in MSCs co-cultured with normal liver cells, Wnt2 and catenin were also upregulated and may be associated with differentiation into hepatocytes.
The results of the microarray analysis of MSCs co-cultured with liver cells from CCl4-injected mice demonstrate that genes associated with hypoxia response were upregu-lated; e.g., cytoglobin, hypoxia inducible factor 3 (·subunit) and erythropoietin. Cytoglobin, the gene involved in cell proliferation _ possibly via collagen synthesis _ and expressed predominantly in fibroblasts and associated cell types, is significantly elevated under hypoxic conditions (12). In this study, cytoglobin was upregulated in both the liver and CCl4liver groups. Hypoxia also induces the upregulation of erythropoietin, Sox6, and particularly Sox9, which is a key regulator of the differentiation of MSCs into chondrocytes. Another upregulated gene in the CCl4liver group was Vav2, the guanine nucleotide exchange factor. The primary function of this gene is the regulation of collagen phagocytosis, which is an ·2ß1 integrin-dependent extracellular remodeling process (13). CXCL2 (Groß) is a ligand of CXCR2 and contributes to the rapid mobilization of HSCs with enhanced engraftment properties (14). Upregulation of the v-Erb gene can be consid-ered in the context of epidermal growth factor receptors. In particular, it is noticeable that the expression of hepatic nuclear factor 4·, a critical transcription factor in hepatocyte differentiation (15), was upregulated.
MSCs co-cultured with liver cells from CCl4-injected mice evidenced elevated levels of several growth factors, including epidermal growth factors. The observed up-regulation of frizzled homolog 4 reflects the possibility that the Wnt/ß-catenin pathway is relevant to the co-culturing of MSCs with liver cells.
Several genes were upregulated in common in the liver and CCl4liver groups; e.g., angiotensin receptor-like 1, CD34, procollagen type XXVII, cytochrome P450, fibroblast growth factor, forkhead box G1, hepatocyte nuclear factor 4, inhibitor of DNA binding 1, IL-1, matrix metallopeptidases, retinoic acid receptor ß, S100 protein ß, slit homologue 2 and tyrosine kinase 2. As well, several genes were downregulated in both groups; e.g., C3, CCR2, ADAM metallopepidase with thrombospondin type 1 and 5, CD86, cullin 1, Erbb2 inter-acting protein, GNA13, hepatocyte growth factor, integrin ·6, NFATc2 and protein tyrosine phosphatase receptor type C. In the liver group, Socs3 was downregulated. Socs3 is a key inhibitor of cytokines that utilize gp130 (e.g., IL-23R and IL-6R), whereas Socs1 is believed to inhibit any cytokines that utilize Ác (16). In the CCl4liver group, PTEN was down-regulated compared to the untreated MSCs. PTEN is a tumor suppressor gene and functions as a lipid phosphatase that decreases the PI3K signaling pathway. In the absence of PTEN, HSCs are driven into the cell cycle; the loss of PTEN frequently promotes the formation of a variety of tumors (17).
In summary, MSCs co-cultured with normal liver cells exhibited the potential for differentiation into functional liver cells via upregulation of the genes associated with inflam-matory response. MSCs co-cultured with CCl4liver cells differentiated into functional liver cells and upregulated genes related to hypoxic stress. In the CCl4-injected mice, hypoxic-induced responses were involved in the regeneration process of liver cells via MSCs. We suggest that a diverse repairing pathway contributes to the regeneration process of liver cells by MSCs.
Acknowledgements
This work was supported by a Korea Research Foundation Grant funded by the Korean government (KOEHRD, Basic Research Promotion Fund) (KRF-2007-531-E00061). References
1. Lange C, Bruns H, Kluth D, Zander AR and Fiegel HC: Hepa-tocytic differentiation of mesenchymal stem cells in cocultures with fetal liver cells. World J Gastroenterol 12: 2394-2397, 2006.
2. Ong SY, Dai H and Leong KW: Hepatic differentiation potential of commercially available human mesenchymal stem cells. Tissue Eng 12: 3477-3485, 2006.
3. Talens-Visconti R, Bonora A, Jover R, Mirabet V, Carbonell F, Castell JV and Gomez-Lechon MJ: Hepatogenic differentiation of human mesenchymal stem cells from adipose tissue in comparison with bone marrow mesenchymal stem cells. World J Gastroenterol 12: 5834-5845, 2006.
4. Jung YJ, Ryu KH, Cho SJ, Woo SY, Seoh JY, Chun CH, Yoo K, Moon IH and Han HS: Syngenic bone marrow cells restore hepatic function in carbon tetrachloride-induced mouse liver injury. Stem Cells Dev 15: 687-695, 2006.
5. Honczarenko M, Le Y, Swierkowski M, Ghiran I, Glodek AM and Silberstein LE: Human bone marrow stromal cells express a distinct set of biologically functional chemokine receptors. Stem Cells 24: 1030-1041, 2006.
6. Majumdar MK, Thiede MA, Mosca JD, Moorman M and Gerson SL: Phenotypic and functional comparison of cultures of marrow-derived mesenchymal stem cells (MSCs) and stromal cells. J Cell Physiol 176: 57-66, 1998.
7. Wagner W, Wein F, Seckinger A, Frankhauser M, Wirkner U, Krause U, Blake J, Schwager C, Eckstein V, Ansorge W and Ho AD: Comparative characteristics of mesenchymal stem cells from human bone marrow, adipose tissue, and umbilical cord blood. Exp Hematol 33: 1402-1416, 2005.
8. Leng L, Metz CN, Fang Y, Xu J, Donnelly S, Baugh J, Delohery T, Chen Y, Mitchell RA and Bucala R: MIF signal transduction initiated by binding to CD74. J Exp Med 197: 1467-476, 2003. 9. Hayes NV and Gullick WJ: The neuregulin family of genes and
their multiple splice variants in breast cancer. J Mammary Gland Biol Neoplasia 13: 205-214, 2008.
10. Bennett CN, Longo KA, Wright WS, Suva LJ, Lane TF, Hankenson KD and MacDougald OA: Regulation of osteo-blastogenesis and bone mass by Wnt10b. Proc Natl Acad Sci USA 102: 3324-3329, 2005.
11. Yang W, Yan HX, Chen L, Liu Q, He YQ, Yu LX, Zhang SH, Huang DD, Tang L, Kong XN, Chen C, Liu SQ, Wu MC and Wang HY: Wnt/beta-catenin signaling contributes to activation of normal and tumorigenic liver progenitor cells. Cancer Res 68: 4287-4295, 2008.
12. Burmester T, Gerlach F and Hankeln T: Regulation and role of neuroglobin and cytoglobin under hypoxia. Adv Exp Med Biol 618: 169-180, 2007.
13. Arora PD, Marignani P and McCulloch CA: Collagen phago-cytosis is regulated by the guanine nucleotide exchange factor Vav2. Am J Physiol Cell Physiol 295: C130-C137, 2008. 14. Pelus LM and Fukuda S: Peripheral blood stem cell
mobilization: the CXCR2 ligand GRObeta rapidly mobilizes hematopoietic stem cells with enhanced engraftment properties. Exp Hematol 34: 1010-1020, 2006.
15. Kyrmizi I, Hatzis P, Katrakili N, Tronche F, Gonzalez FJ and Talianidis I: Plasticity and expanding complexity of the hepatic transcription factor network during liver development. Genes Dev 20: 2293-2305, 2006.
16. O'Shea JJ and Murray PJ: Cytokine signaling modules in inflammatory responses. Immunity 28: 477-487, 2008.
17. Rossi DJ and Weissman IL: Pten, tumorigenesis, and stem cell self-renewal. Cell 125: 229-231, 2006.