J Korean Acad Community Health Nurs (지역사회간호학회지) https://doi.org/10.12799/jkachn.2021.32.1.95
The Relationship between Unmet Healthcare Needs Due to Financial
Reasons and the Experience of Catastrophic Health Expenditures
Kang, Jeong-Hee
1· Kim, Chul-Woung
21Assistant Professor, Department of Nursing Science, U1 University, Yeongdong
2Professor, Department of Preventive Medicine, College of Medicine ․ Research Institute for Medical Sciences,
Chungnam National University, Daejeon, Korea
Purpose: The purpose of this study is to investigate the association between unmet healthcare needs due to financial reasons and catastrophic health expenditures. Methods: This study used secondary data from the 2014~2015 Korean Health Panel survey. The subjects of this study were 21,495 people aged 20 or older, and of them, there were 16,227 people aged 20 to 64 and 5,268 people aged 65 or older, which were surveyed between 2014 and 2015. The association between unmet healthcare needs due to financial reasons and catastrophic health expenditures was analyzed through logistic regression. Results: In 2015, 1.7% of people aged 20~64 years and 7.9% of those aged 65 or older experienced unmet healthcare needs due to financial reasons. In the 20~64 age group, people who repeatedly experienced catastrophic health expenditures (=10%,=20%) were less likely to experience unmet healthcare needs due to financial reasons than those who did not experience catastrophic health expenditures for two years (OR=0.50, OR=0.41). However, in the 65-or-older group, people who repeatedly experienced catastrophic health expenditures (=20%) were more likely to experience unmet healthcare needs due to financial reasons than those who did not experience catastrophic health expenditures for two years (OR=1.68). Conclusion: A greater percentage of the elderly repeatedly faced both catastrophic health expenditures and unmet healthcare needs due to financial reasons compared to the non-elderly.
Key Words: Health expenditures; Health services needs; Employment
Corresponding author: Kim, Chul-Woung
Department of Preventive Medicine, College of Medicine, Chungnam National University, 266 Munhwa-ro, Jung-gu, Daejeon, 35015, Korea. Tel: +82-42-580-8268, Fax: +82-42-583-7561, E-mail: [email protected]
- This study was supported by a research fund from Chungnam National University.
Received: May 19, 2020 / Revised: Feb 14, 2021 / Accepted: Feb 14, 2021
This is an open access article distributed under the terms of the Creative Commons Attribution Non-Commercial License (http://creativecommons.org/licenses/ by-nc/3.0), which permits unrestricted non-commercial use, distribution, and reproduction in any medium, provided the original work is properly cited.
INTRODUCTION
Korea's health insurance system allows all citizens to use medical services regardless of income or ability to pay, but even if there is a need for medical services, it cannot be used due to financial burden. In 2012, 16.2% of Korean adults aged 19 or older experienced unmet healthcare needs during the previous year. In other words, they had healthcare needs but could not utilize healthcare services [1]. The most common reason for unmet healthcare needs is "financial reasons" [2]. The rate of unmet healthcare needs due to the burden of treatment costs is 4.5% in Korea [3], more than double that of the mean rate in the Euro-pean Union (2.2%) [4].
In Korea, the percentage of healthcare costs paid out- of-pocket averages about 36.8%, about 1.8 times higher than the Organization for Economic Cooperation and Development (OECD) average of 20.3% [5]. In addition, about 3.48% of total household expenditures were spent on healthcare, and 26.8% of households spent at least 3 million KRW on health services (including out-of-pocket costs and non-covered services) for a household member over a six-month period [6]. As demonstrated here, the high out-of-pocket costs for healthcare seem to lead to high rates of unmet healthcare needs [7].
In previous studies, education level, type of health in-surance, chronic disease, job type, private health insu-rance, self-reported health, type of healthcare expenditure,
household income, employment status, stress from finan-cial difficulties, stress from family conflict, and depression have all been associated with unmet healthcare needs due to financial reason [1,3,8]. Particularly, catastrophic health expenditures experience is associated with unmet health-care needs due to financial reasons [3].
The definition and criteria of catastrophic health ex-penditures vary. The World Health Organization define catastrophic health expenditure as a household's health expenditure that exceeds 40% of the household's capacity to pay [9]. Previous studies performed international com-parisons of catastrophic health expenditures by defining them as out-of-pocket spending that exceeds 40% of a household's capacity to pay [10-12]. In a study comparing catastrophic health expenditures in 59 countries, a cata-strophic health expenditure is a health expenditure that exceeds 40% of the household's capacity to pay, excluding food expenses, and the rate of catastrophic health ex-penditures was 1.73% in Korea. This is similar to the rate in Mexico (1.54%), lower than that in Brazil (10.27%) and Vietnam (10.45%), but higher than that of European coun-tries such as the United Kingdom (0.04%) and Sweden (0.18%) [10]. In addition, the rate of catastrophic health ex-penditures in Korea increased to 2.9% in 2006 [11], and the rate of catastrophic health expenditures in the econom-ically active population aged 20~64 was 2.5% in 2012 and 2.1% in 2013 [12]. Most domestic studies that systemati-cally examined the literature on catastrophic health ex-penditures defined out-of-pocket spending (total house-hold income) excluding food expenses as the househouse-hold's capacity to pay [11,12]. Although each study defined a household's capacity to pay in the same way, if the exceed-ing criteria differed, the rates of catastrophic health ex-penditure were different across studies [13]. Previous stu-dies that used the household's capacity to pay excluding food expenses classified the exceeding criteria as 10%, 20%, 30%, and 40% [10,14,15]. In a previous study that amined the association between catastrophic health ex-penditures and unmet healthcare needs due to financial reasons, catastrophic health expenditures were defined as out-of-pocket healthcare spending that exceeds 10% of a household's capacity to pay [3]. In addition, these studies did not consider the Charlson Comorbidity Index (CCI), an index for chronic disease and disease severity, as a fac-tor that impacts unmet healthcare needs [16].
In addition, an increase in healthcare service use occurs as people get older, resulting in increased healthcare ex-penditure [17]. On the other hand, the elderly population has less income due to their decreased economic activity and exhibits a significant drop in private health insurance
purchases [18]. Therefore, the elderly is more likely to ex-perience unmet healthcare needs due to the increase in their use of healthcare services and the higher financial burden of medical expenses.
Therefore, in this study, we classify healthcare spend-ing as≥10%,≥20%,≥30%, and≥40% of income and also consider income levels and the CCI, which reflects disease severity. Moreover, because the reasons for unmet health-care needs differ across age groups, we classify subjects as elderly or non-elderly to identify the factors that affect un-met healthcare needs due to financial reasons within these groups.
METHODS
1. Study design
This study is a descriptive research study to investigate the relationship between the experience of catastrophic health expenditures and the experience of unmet health-care needs due to financial reasons using nationwide Korea Health Panel (KHP) data.
2. Participants
Data from the 2014~2015 annual KHP (version 1.4) con-ducted by the Korea Institute for Health and Social Affairs (KIHASA) and National Health Insurance Service (NHIS) were used for this study.
The subjects of this study were 21,495 people aged 20 or older, 16,227 people aged 20 to 64 and 5,268 people aged 65 or older, which were surveyed between 2014 and 2015.
The data were obtained from the KHP conducted by the KIHASA and NHIS. Permission to use the data set was granted by the KIHASA after reviewing the proposal for this study. This study obtained approval from the institu-tional review boards of the U1 University (Approval no. U1IRB2019-14).
3. Measures
The dependent variable of this study is an experience of unmet healthcare needs due to financial reasons in 2015. Participants were considered to have experienced unmet healthcare needs due to financial reasons if they answered "financial reasons (the cost was too high)" to the question "What is the most important reason that you could not seek treatment or test at a hospital or clinic during the last year?". The independent variables were sex, age, education lev-el, employment status, income levlev-el, type of private
in-surance, self-reported health status, CCI, and experience of a catastrophic health expenditure. Employment status were classified regular workers, non-regular workers, self-employed, and not economically active. Regarding in-come level, total annual household inin-come was divided by the square root of the number of household members and was presented in quintiles. The first quintile includes the bottom 20%, while the fifth quintile includes the top 20%. Types of private health insurance were classified as no pri-vate health insurance or fixed-benefit, indemnity, or mixed (fixed-benefit and indemnity) insurance. Self-re-ported health was measured based on the responses ("very good"=1, "very bad"=5) to the question "How do you rate your current health?". The CCI was developed by a tool for predicting one-year mortality in breast cancer patients, and it is a validated tool for comorbidity adjust-ment [19,20]. Using the diagnosis codes in the KHP data, a weighted score of 1~6 was added depending on disease severity, and total scores were classified as 0, 1, 2, and ≥3 [19,21]. Therefore, in the present study, we used the diag-nosis codes reported in the questionnaire and weighted 15 disease groups with scores of 1~6 to compute the CCI. For the 20~64 age group, the CCI was classified as 0, 1, 2, and ≥3, and for the 65-or-older group, the CCI was classified as 3, 4, and ≥5. Catastrophic health expenditure measures healthcare spending against a household's capacity to pay. A household's capacity to pay is represented by their total household income minus food expenses. Total household income is the sum of total earned income and income from assets within the household, and food expenses are the costs for food excluding costs for dining out. Healthcare expenditure is the direct healthcare costs for emergency medical service, inpatient medical service, outpatient me-dical service, and prescription drugs (emergency, inpati-ent, and outpatient prescriptions) [22].
In this study, 2014 and 2015 catastrophic health expen-ditures were classified as ≥40%, ≥30%, ≥20%, and ≥ 10% of a household's capacity to pay, and as 0 for no cata-strophic health expenditures over the two years, 1 for one catastrophic health expenditure, and 2 for two catastro-phic health expenditures.
4. Data Analysis
In present study, the distribution of unmet healthcare needs due to financial and others reasons and catastrophic healthcare expenditures were analyzed through frequen-cy test. The difference in unmet healthcare needs due to fi-nancial and other reasons in the 20~64 age group and the 65-or-older group were analyzed through chi-squared test
and one-way ANOVA (Scheffé test).
The focus of this study is to compare those who have ex-perienced unmet healthcare needs due to financial reasons with those who have not. Thus, when using logistic re-gression analysis, we excluded those who experienced un-met healthcare needs due to other reasons. And, the asso-ciations between catastrophic health expenditures and the experience of unmet healthcare needs due to financial rea-sons in the 20~64 age group and the 65-or-older group were analyzed through logistic regression. For the 65-or- older group, no regular workers had experienced unmet healthcare needs due to financial reasons, so we excluded employment status from the analysis.
RESULTS
1. Distribution of Unmet Healthcare Needs due to
Finan-cial Reasons and Catastrophic Health Expenditures by
Type and Group
In 2015, 13.3% of the subjects had unmet healthcare needs: 11.8% in the 20~64 age group and 17.8% in the 65- or-older group. In 2015, 3.2% of the subjects had unmet healthcare needs due to financial reasons: 1.7% in the 20~ 64 age group and 7.9% in the 65-or-older group.
In 2014, the rate of catastrophic health expenditures ≥ 10%, ≥20%, ≥30%, and ≥40% were 16.4%, 6.4%, 3.2%, and 1.7%, respectively, in the 20~64 age group, and 41.7%, 21.4%, 13.4%, and 9.2%, respectively, in the 65-or-older group. In 2015, the rate of catastrophic health expendi-tures ≥10%, ≥20%, ≥30%, and ≥40% were 17.1%, 6.7%, 3.1%, and 1.9%, respectively, in the 20~64 age group, and 45.7%, 25.7%, 15.8%, and 11.1%, respectively, in the 65-or- older group.
The percentages of subjects who experienced more than one catastrophic health expenditure ≥10%, ≥20%, ≥30%, and ≥40% in 2014~2015 were 4.6%, 1.4%, 0.6%, and 0.3%, respectively, in the 20~64 age group, and 24.2%, 9.7%, 4.9%, and 2.7%, respectively, in the 65-or-older group. In addition, percentages of subjects who had only one cata-strophic health expenditure ≥10%, ≥20%, ≥30%, and ≥ 40% in 2014~2015 were 18.9%, 8.2%, 4.2%, and 2.6%, re-spectively, in the 20~64 age group, and 32.8%, 24.4%, 17.4%, and 13.5%, respectively, in the 65-or-older group (Table 1).
2. Differences in the Rate of Unmet Healthcare Needs
due to Financial Reasons
un-Table 1. Distribution of Unmet Healthcare Needs due to Financial Reasons and Catastrophic Healthcare Expenditures Variables Categories Total (N=21,495) 20~64 years (n=16,227) 65 years or older (n=5,268) n (%) n (%) n (%)
Unmet healthcare needs Met Unmet 17,951 2,761 (86.7) (13.3) 13,671 1,834 (88.2) (11.8) 4,280 927 (82.2) (17.8) Reasons for unmet
healthcare needs Met Financial Others 18,716 693 2,068 (87.1) (3.2) (9.6) 14,379 277 1,557 (88.7) (1.7) (9.6) 4,337 416 511 (82.4) (7.9) (9.7) CHE (2014) ≥40% ≥30% ≥20% ≥10% 627 990 1,733 3,819 (3.9) (6.1) (10.9) (23.6) 202 372 746 1,900 (1.7) (3.2) (6.4) (16.4) 425 618 987 1,919 (9.2) (13.4) (21.4) (41.7) CHE (2015) ≥40% ≥30% ≥20% ≥10% 758 1,122 2,017 4,200 (4.6) (6.8) (12.2) (25.4) 225 364 785 2,009 (1.9) (3.1) (6.7) (17.1) 533 758 1,232 2,191 (11.1) (15.8) (25.7) (45.7) CHE ≥10% 0 1 2 12,804 4,281 1,869 (67.6) (22.6) (9.9) 10,628 2,621 644 (76.5) (18.9) (4.6) 2,176 1,660 1,225 (43.0) (32.8) (24.2) CHE ≥20% 0 1 2 15,894 2,370 690 (83.9) (12.5) (3.6) 12,561 1,133 199 (90.4) (8.2) (1.4) 3,333 1,237 491 (65.9) (24.4) (9.7) CHE ≥30% 0 1 2 17,166 1,464 324 (90.6) (7.7) (1.7) 13,234 582 77 (95.3) (4.2) (0.6) 3,932 882 247 (77.7) (17.4) (4.9) CHE ≥40% 0 1 2 17,742 1,039 173 (93.6) (5.5) (0.9) 13,502 355 36 (97.2) (2.6) (0.3) 4,240 684 137 (83.8) (13.5) (2.7) CHE=catastrophic health expenditures; 2014 and 2015 catastrophic health expenditures were classified as 0 for no catastrophic health expenditures over the two years, 1 for one catastrophic health expenditure, and 2 for two catastrophic health expenditures.
Missing data: Total, unmet healthcare needs (783); reasons for unmet healthcare needs (18); CHE (2014)≥10% (5,291), CHE (2014)≥20%, 320%, ≥40% (5,279); CHE (2015)≥10%, ≥20%, ≥30%, ≥40% (4,958); CHE ≥10%, CHE ≥20%, CHE ≥30%, CHE ≥40% (2,541). For ages 20~64, unmet healthcare needs (722); reasons for unmet healthcare needs (14); CHE (2014) ≥10%, ≥20%, ≥30% (4,622), CHE (2014) ≥40% (4,629), CHE (2015) ≥10%, ≥20%, ≥30%, ≥40% (4,488); CHE ≥10%, CHE ≥20%, CHE ≥30%, CHE ≥40% (2,334). For those over 65, unmet healthcare needs (61); reasons for unmet healthcare needs (4); CHE (2014) ≥10%, ≥20%, ≥30% (657), CHE (2014) ≥40% (667), CHE (2015) ≥10%, ≥20%, ≥30%, ≥40% (470); CHE ≥10%, CHE ≥20%, CHE ≥30%, CHE ≥40% (207).
met healthcare needs due to financial reasons (p<.001), and the rate of unmet healthcare needs due to financial reasons increased as education and income levels de-creased (p<.001). Non-regular workers and not econom-ically active had the highest rate of unmet healthcare needs due to financial reasons, followed by individuals who were self-employed workers, and regular workers (p<.001). Individuals without private health insurance had the highest rate of unmet healthcare needs due to fi-nancial reasons, followed by individuals with mixed, fixed- benefit, and indemnity insurance (p<.001). The rate of un-met healthcare needs due to financial reasons increased with
poorer self-reported health (p<.001), higher CCI score (p< .001), more experiences of catastrophic health expenditures ≥10% and ≥20% (p<.001). Individuals who had only one catastrophic health expenditure had the highest rate of un-met healthcare needs due to financial reasons, followed by individuals who experienced two catastrophic health ex-penditure, and individuals who experience no catastro-phic health expenditure (≥30%) (p=.026) (Table 2).
In the 65-or-older group, more women than men had unmet healthcare needs due to financial reasons (p<.001). Non-regular workers had the highest rate of unmet health-care needs due to financial reasons, followed by
indivi-Table 2. Difference in Unmet Healthcare Needs due to Financial and Others Reasons for 20~64 Years Old Population (N=16,227)
Variables Categories
Meta Unmet Total
p Scheffé́́ Financialb Othersc n (%) or M±SD n (%) or M±SD n (%) or M±SD n Gender Male Female 6,959 (90.1) 7,420 (87.4) 104 (1.3) 173 (2.0) 660 (8.5) 897 (10.6) 7,723 8,490 <.001 Age (year) 41.23±13.99 49.13±12.70 44.39±12.40 16,213 <.001 a<b, c
Education level Graduate more
High school Middle school
Less than primary school
7,912 (90.9) 4,346 (88.2) 1,192 (85.3) 929 (78.4) 75 (0.9) 87 (1.8) 45 (3.2) 70 (5.9) 717 (8.2) 494 (10.0) 160 (11.5) 186 (15.7) 8,704 4,927 1,397 1,185 <.001
Employment status Regular worker Non-regular worker Self-employ
Not economically active
3,612 (89.8) 3,034 (86.0) 2,194 (84.6) 5,539 (91.2) 14 (0.3) 79 (2.2) 49 (1.9) 135 (2.2) 397 (9.9) 413 (11.7) 350 (13.5) 397 (6.5) 4,023 3,526 2,593 6,071 <.001 Income quintile 5 4 3 2 1 5,051 (91.8) 3,811 (89.1) 3,023 (87.1) 1,922 (85.9) 572 (79.0) 11 (0.2) 33 (0.8) 63 (1.8) 91 (4.1) 79 (10.9) 442 (8.0) 434 (10.1) 383 (11.0) 225 (10.1) 73 (10.1) 5,504 4,278 3,469 2,238 724 <.001
Private health insurance No private health insurance Fixed benefic type Indemnity type Mixed type 258 (81.9) 9,746 (89.1) 1,016 (90.5) 2,787 (87.8) 10 (3.2) 158 (1.4) 13 (1.2) 59 (1.9) 47 (14.9) 1,029 (9.4) 94 (8.4) 329 (10.4) 315 10,933 1,123 3,175 <.001
Self-reported health status 2.48±0.74 3.18±0.80 2.75±0.73 15,234 <.001
a<b, c CCI score 0 1 2 3 or more 6,411 (91.6) 2,953 (87.2) 2,932 (85.2) 2,083 (87.3) 55 (0.8) 48 (1.4) 91 (2.6) 83 (3.5) 535 (7.6) 384 (11.3) 419 (12.2) 219 (9.2) 7,001 3,385 3,442 2,385 <.001 CHE≥10% 0 1 2 9,425 (88.8) 2,308 (88.1) 568 (88.3) 162 (1.5) 68 (2.6) 24 (3.7) 1,031 (9.7) 244 (9.3) 51 (7.9) 10,618 2,620 643 <.001 CHE≥20% 0 1 2 11,160 (88.9) 965 (85.2) 176 (88.9) 211 (1.7) 36 (3.2) 7 (3.5) 1,180 (9.4) 131 (11.6) 15 (7.6) 12,551 1,132 198 <.001 CHE≥30% 0 1 2 11,735 (88.7) 498 (85.6) 68 (89.5) 232 (1.8) 20 (3.4) 2 (2.6) 1,256 (9.5) 64 (11.0) 6 (7.9) 13,223 582 76 .026 CHE≥40% 0 1 2 11,963 (88.7) 306 (86.2) 32 (91.4) 240 (1.8) 13 (3.7) 1 (2.9) 1,288 (9.5) 36 (10.1) 2 (5.7) 13,491 355 35 .097
CCI=Charlson comorbidity index; CHE=catastrophic health expenditures; 2014 and 2015 catastrophic health expenditures were classified as 0 for no catastrophic health expenditures over the two years, 1 for one catastrophic health expenditure, and 2 for two catastrophic health expenditures. Missing data: Gender, age, education level, Employment status, Income Quintile, CCI score (14); Self-reported health status (993); Private health insurance (681CHE ≥10%, CHE ≥20%, CHE ≥30%, CHE ≥40% (2,346).
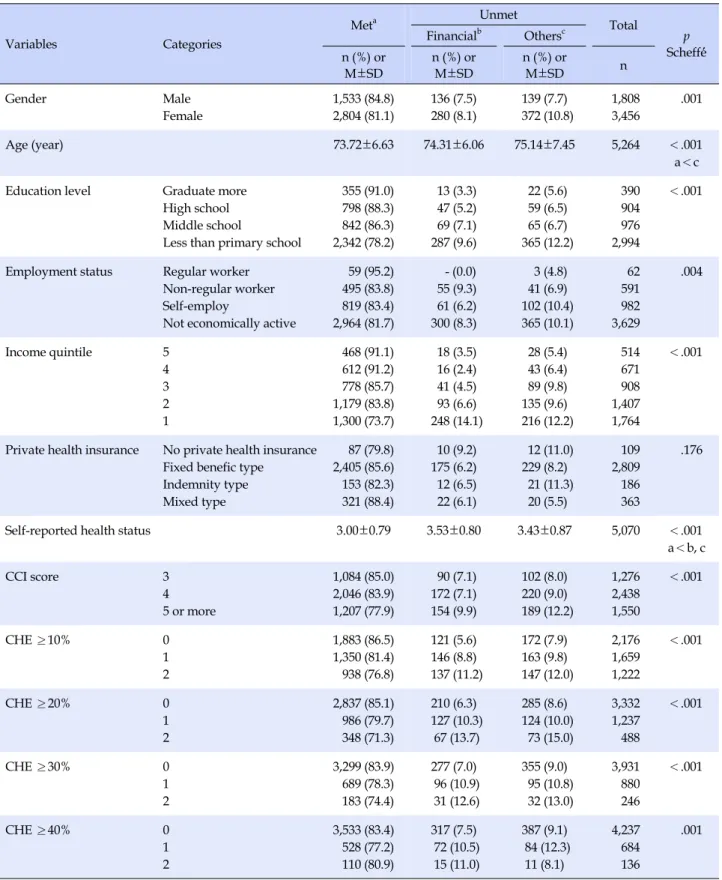
Table 3. Difference in Unmet Healthcare Needs due to Financial and Others Reasons for Population Over Age 65 (N=5,268)
Variables Categories
Meta Unmet Total
p Scheffé́́ Financialb Othersc n (%) or M±SD n (%) or M±SD n (%) or M±SD n Gender Male Female 1,533 (84.8) 2,804 (81.1) 136 (7.5) 280 (8.1) 139 (7.7) 372 (10.8) 1,808 3,456 .001 Age (year) 73.72±6.63 74.31±6.06 75.14±7.45 5,264 <.001 a<c
Education level Graduate more
High school Middle school
Less than primary school
355 (91.0) 798 (88.3) 842 (86.3) 2,342 (78.2) 13 (3.3) 47 (5.2) 69 (7.1) 287 (9.6) 22 (5.6) 59 (6.5) 65 (6.7) 365 (12.2) 390 904 976 2,994 <.001
Employment status Regular worker Non-regular worker Self-employ
Not economically active
59 (95.2) 495 (83.8) 819 (83.4) 2,964 (81.7) - (0.0) 55 (9.3) 61 (6.2) 300 (8.3) 3 (4.8) 41 (6.9) 102 (10.4) 365 (10.1) 62 591 982 3,629 .004 Income quintile 5 4 3 2 1 468 (91.1) 612 (91.2) 778 (85.7) 1,179 (83.8) 1,300 (73.7) 18 (3.5) 16 (2.4) 41 (4.5) 93 (6.6) 248 (14.1) 28 (5.4) 43 (6.4) 89 (9.8) 135 (9.6) 216 (12.2) 514 671 908 1,407 1,764 <.001
Private health insurance No private health insurance Fixed benefic type Indemnity type Mixed type 87 (79.8) 2,405 (85.6) 153 (82.3) 321 (88.4) 10 (9.2) 175 (6.2) 12 (6.5) 22 (6.1) 12 (11.0) 229 (8.2) 21 (11.3) 20 (5.5) 109 2,809 186 363 .176
Self-reported health status 3.00±0.79 3.53±0.80 3.43±0.87 5,070 <.001
a<b, c CCI score 3 4 5 or more 1,084 (85.0) 2,046 (83.9) 1,207 (77.9) 90 (7.1) 172 (7.1) 154 (9.9) 102 (8.0) 220 (9.0) 189 (12.2) 1,276 2,438 1,550 <.001 CHE ≥10% 0 1 2 1,883 (86.5) 1,350 (81.4) 938 (76.8) 121 (5.6) 146 (8.8) 137 (11.2) 172 (7.9) 163 (9.8) 147 (12.0) 2,176 1,659 1,222 <.001 CHE ≥20% 0 1 2 2,837 (85.1) 986 (79.7) 348 (71.3) 210 (6.3) 127 (10.3) 67 (13.7) 285 (8.6) 124 (10.0) 73 (15.0) 3,332 1,237 488 <.001 CHE ≥30% 0 1 2 3,299 (83.9) 689 (78.3) 183 (74.4) 277 (7.0) 96 (10.9) 31 (12.6) 355 (9.0) 95 (10.8) 32 (13.0) 3,931 880 246 <.001 CHE ≥40% 0 1 2 3,533 (83.4) 528 (77.2) 110 (80.9) 317 (7.5) 72 (10.5) 15 (11.0) 387 (9.1) 84 (12.3) 11 (8.1) 4,237 684 136 .001
CCI=Charlson comorbidity Index; CHE=catastrophic health expenditures; 2014 and 2015 catastrophic health expenditures were classified as 0 for no catastrophic health expenditures over the two years, 1 for one catastrophic health expenditure, and 2 for two catastrophic health expenditures. Missing data: Gender, age, education level, Employment status, Income Quintile, CCI score (4); Private health insurance (1,801); Self-reported health status (198); CHE ≥10%, CHE ≥20%, CHE ≥30%, CHE ≥40% (221).
duals who were not economically active, and self-employ-ed workers (p=.004). The rate of unmet healthcare neself-employ-eds due to financial reasons increased with decreasing educa-tion levels and income levels (p<.001), poorer self-reported health (p<.001) and with higher CCI score (p<.001). Final-ly, the rate of unmet healthcare needs due to financial reasons increased with more experiences of catastrophic health expenditures ≥10%, ≥20%, ≥30% (p<.001), and ≥40% (p=.001) (Table 3).
3. Factors Affecting the Rate of Unmet Healthcare Needs
due to Financial Reasons
In the 20~64 age group, factors that affected the rate of unmet healthcare needs due to financial reasons were em-ployment status, income level, type of private health in-surance, self-reported health, CCI score, catastrophic health expenditure ≥10%, ≥20%. Regarding catastrophic health expenditures ≥10% and ≥20%, those who experienced two catastrophic health expenditures over two years were 0.50 and 0.41 times less likely to experience unmet health-care needs due to financial reasons than those who did not experience catastrophic health expenditures (Table 4).
In the 65-or-older group, factors affected the rate of un-met healthcare needs due to financial reasons were income level, self-reported health, and catastrophic health expen-diture ≥20%. Regarding catastrophic health expenexpen-ditures ≥20%, those who experienced two catastrophic health ex-penditures over two years were 1.68 times more likely to experience unmet healthcare needs due to financial rea-sons than those who did not experience catastrophic health expenditures (Table 5).
DISCUSSION
In the present study, the rate of people with unmet healthcare needs due to financial reasons among who those have unmet healthcare needs was greater than the mean rate in the European Union in 2014 (5.9%) [23].
Also, the rate of catastrophic health expenditures great-er than 40% was 4.6% in 2015, highgreat-er than that of any othgreat-er country. According to OECD Health Working Papers, the rate of people experiencing catastrophic health expendi-tures greater than 40% in South Korea was the highest in 2013 (3.7%), which was higher than 2.0% in the United States, 1.6% in Ireland, 0.5% in Hungary, and 0.1% in Finland [24].
Among the elderly, the rate of unmet healthcare needs was 17.8% and that of unmet healthcare needs due to fi-nancial reasons was 7.9%. On the other hand, the rate of
unmet healthcare needs among the non-elderly was 11.8% and that of unmet healthcare needs due to financial rea-sons was 1.7%. The rate of unmet healthcare needs among the elderly is 6.0%p higher than that among the non-eld-erly, presumably due to the 6.2%p difference in the rates of unmet healthcare needs due to financial reasons.
As shown here, the elderly experienced more unmet healthcare needs due to financial reasons than non-elderly. There was minimal association between socioeconomic factors, namely income and education level, and unmet healthcare needs due to financial reasons. Education level had no association with unmet healthcare needs due to fi-nancial reasons at all. Regarding income, only the 1st quin-tile (bottom 20%) among the elderly was associated with unmet healthcare needs due to financial reasons. Among the non-elderly, all income quintiles were associated with unmet healthcare needs due to financial reasons, and in particular, the bottom 20% is more likely to experience un-met healthcare needs due to financial reasons than the top 20%.
According to data from the 2013 National Health Statis-tics, the incidence of unmet healthcare needs due to finan-cial reasons was 4.2 times higher among the lowest income group (5.0%) than in the highest income group (1.2%) [25]. Further, this aligns with a previous finding concerning adults aged 65 or older, in which those with a low average monthly households income were found to be more likely to experience unmet healthcare needs due to financial rea-sons [26].
Employment status, an indicator of economic activity that impacts income, was significantly associated with un-met healthcare needs due to financial reasons among the non-elderly. In the present study, the incidence of unmet healthcare needs due to financial reasons was higher among non-regular workers, the self-employed, and in-dividuals who were not economically active compared to regular workers. This is similar to a previous finding, and in the existing studies, wage workers are less likely to ex-perience unmet healthcare needs due to financial reasons than unemployed [3]. In a prior study on the economically active population aged 20~64, the incidence of unmet healthcare needs due to financial reasons was higher among non-regular workers, such as temporary workers and day laborers, than among regular workers [12].
The association of unmet healthcare needs due to finan-cial reasons with self-reported health status and CCI score is weaker in the elderly than in the non-elderly. In the present study, the incidence of unmet healthcare needs due to financial reasons was about 2.5 times higher among those with poorer self-reported health status in the non-
Table 4. Factors affecting Unmet Healthcare Needs due to Financial Reasons of 20~64 Years Old Population (N=16,227)
Variables Categories OR (95% CI) OR (95% CI) OR (95% CI) OR (95% CI)
Gender Male (ref.)
Female 1.17 (0.85~1.61) 1.17 (0.84~1.61) 1.16 (0.84~1.60) 1.15 (0.84~1.59) Age (year) 0.98 (0.96~1.01) 0.98 (0.96~1.01) 0.98 (0.96~1.01) 0.98 (0.96~1.01) Education level Graduate more (ref.)
High school Middle school
Less than primary school
0.79 (0.52~1.21) 0.87 (0.51~1.47) 1.26 (0.74~2.16) 0.79 (0.52~1.22) 0.86 (0.51~1.46) 1.27 (0.74~2.17) 0.79 (0.52~1.21) 0.84 (0.50~1.43) 1.25 (0.73~2.14) 0.78 (0.51~1.20) 0.84 (0.49~1.42) 1.24 (0.73~2.13) Employment status
Regular worker (ref.) Non-regular worker Self-employ
Not economically active
2.93 (1.50~5.73) 2.97 (1.49~5.94) 2.54 (1.32~4.87) 2.91 (1.49~5.70) 2.98 (1.49~5.95) 2.56 (1.33~4.91) 2.93 (1.50~5.74) 3.00 (1.50~6.00) 2.61 (1.36~5.01) 2.93 (1.50~5.73) 2.98 (1.49~5.95) 2.57 (1.34~4.94) Income quintile 5 (ref.)
4 3 2 1 2.74 (1.35~5.54) 6.28 (3.25~12.16) 10.12 (5.24~19.54) 32.90 (16.39~66.02) 2.67 (1.32~5.39) 6.01 (3.11~11.61) 9.68 (5.03~18.65) 30.66 (15.38~61.14) 2.67 (1.32~5.40) 5.95 (3.08~11.50) 9.49 (4.93~18.26) 31.18 (15.64~62.18) 2.67 (1.32~5.39) 5.93 (3.07~11.45) 9.31 (4.84~17.94) 29.35 (14.76~58.34) Private health insurance
No private health insurance (ref.) Fixed benefic type
Indemnity type Mixed type 0.45 (0.22~0.94) 0.42 (0.17~1.08) 0.66 (0.30~1.43) 0.45 (0.22~0.94) 0.42 (0.16~1.06) 0.66 (0.30~1.43) 0.46 (0.22~0.96) 0.42 (0.17~1.08) 0.68 (0.31~1.47) 0.45 (0.21~0.93) 0.40 (0.16~1.01) 0.65 (0.30~1.42) Self-reported health status 2.57 (2.11~3.12) 2.55 (2.10~3.09) 2.50 (2.06~3.03) 2.47 (2.04~3.00) CCI score 0 (ref.)
1 2 3 or more 1.60 (0.86~2.98) 3.03 (1.39~6.58) 2.42 (1.00~5.87) 1.64 (0.88~3.04) 3.09 (1.42~6.72) 2.40 (0.99~5.82) 1.64 (0.88~3.06) 3.01 (1.39~6.54) 2.34 (0.97~5.66) 1.67 (0.90~3.10) 3.07 (1.42~6.66) 2.37 (0.98~5.72) CHE≥10% 0 (ref.) 1 2 0.76 (0.54~1.06) 0.50 (0.29~0.85) CHE≥20% 0 (ref.) 1 2 0.74 (0.49~1.12) 0.41 (0.17~0.99) CHE≥30% 0 (ref.) 1 2 0.65 (0.38~1.11) 0.17 (0.02~1.31) CHE≥40% 0 (ref.) 1 2 0.71 (0.37~1.38) -OR=odds ratio; CI=confidence intervals; ref.=reference; CCI=Charlson comorbidity Index; CHE=catastrophic health expenditures; 2014 and 2015 catastrophic health expenditures were classified as 0 for no catastrophic health expenditures over the two years, 1 for one catastrophic health expenditure, and 2 for two catastrophic health expenditures.
elderly, but only 1.9 times higher in the elderly. This result was supported by a previous study on older adults aged 65 years or older, in which the incidence of unmet health-care needs due to financial reasons increased with poorer self-reported health [3]. Further, among the non-elderly, the incidence of unmet healthcare needs due to financial reasons was about three times higher among those with a
CCI score of 2 than among those with a CCI score of 0. We could not find previous studies on the association of un-met healthcare needs due to financial reasons with CCI score in the elderly. Further research is needed in the fu-ture to answer the reason that the association of unmet healthcare needs due to financial reasons with CCI score is not significant in the elderly.
Table 5. Factors affecting Unmet Healthcare Needs due to Financial Reasons of People Over 65 Years of Age (N=5,268)
Variables Categories OR (95% CI) OR (95% CI) OR (95% CI) OR (95% CI)
Gender Male (ref.)
Female 0.82 (0.59~1.15) 0.82 (0.59~1.15) 0.81 (0.58~1.12) 0.81 (0.58~1.12)
Age (year) 1.00 (0.97~1.03) 1.00 (0.97~1.03) 1.00 (0.97~1.03) 1.00 (0.97~1.03)
Education level Graduate more (ref.) High school Middle school
Less than primary school
0.98 (0.42~2.29) 1.22 (0.54~2.72) 1.69 (0.77~3.69) 1.00 (0.43~2.33) 1.24 (0.55~2.76) 1.70 (0.78~3.72) 0.97 (0.42~2.24) 1.20 (0.54~2.68) 1.67 (0.76~3.64) 0.96 (0.41~2.23) 1.21 (0.54~2.69) 1.67 (0.76~3.64) Income quintile 5 (ref.)
4 3 2 1 0.47 (0.21~1.04) 0.82 (0.43~1.58) 1.21 (0.66~2.21) 2.65 (1.43~4.91) 0.48 (0.22~1.06) 0.87 (0.46~1.66) 1.28 (0.71~2.33) 2.82 (1.55~5.15) 0.48 (0.22~1.06) 0.88 (0.46~1.68) 1.37 (0.76~2.48) 3.31 (1.82~6.02) 0.48 (0.22~1.06) 0.88 (0.46~1.68) 1.37 (0.76~2.48) 3.30 (1.83~5.94) Private health insurance
No private health insurance (ref.) Fixed benefic type
Indemnity type Mixed type 1.07 (0.50~2.30) 1.52 (0.57~4.00) 1.39 (0.57~3.37) 1.08 (0.51~2.30) 1.60 (0.61~4.19) 1.43 (0.59~3.45) 1.15 (0.54~2.44) 1.68 (0.64~4.38) 1.49 (0.62~3.60) 1.15 (0.54~2.44) 1.67 (0.64~4.36) 1.48 (0.61~3.57) Self-reported health status 1.85 (1.52~2.25) 1.86 (1.52~2.26) 1.89 (1.55~2.30) 1.89 (1.55~2.30) CCI score 3 (ref.)
4 5 or more 0.71 (0.47~1.07) 0.70 (0.44~1.12) 0.71 (0.47~1.06) 0.71 (0.45~1.12) 0.75 (0.50~1.12) 0.78 (0.49~1.23) 0.74 (0.50~1.11) 0.78 (0.50~1.24) CHE ≥10% 0 (ref.) 1 2 1.25 (0.87~1.81) 1.42 (0.93~2.18) CHE ≥20% 0 (ref.) 1 2 1.06 (0.73~1.52) 1.68 (1.05~2.71) CHE ≥30% 0 (ref.) 1 2 0.92 (0.62~1.35) 0.86 (0.40~1.81) CHE ≥40% 0 (ref.) 1 2 0.91 (0.60~1.38) 0.67 (0.23~1.95) OR=odds ratio; CI=confidence intervals; ref.=reference; CCI=Charlson Comorbidity Index; CHE=catastrophic health expenditures; 2014 and 2015 catastrophic health expenditures were classified as 0 for no catastrophic health expenditures over the two years, 1 for one catastrophic health expenditure, and 2 for two catastrophic health expenditures.
Type of private health insurance was associated with unmet healthcare needs due to financial reasons among the non-elderly but not in the elderly. Non-elderly who had fixed-benefit private health insurance showed a lower rate of unmet healthcare needs due to financial reasons compared to those without private health insurance. These results were in line with a previous finding that people with private health insurance had a lower rate of unmet healthcare needs due to financial reasons than those with-out private health insurance [3].
In the present study, 23.6% and 25.4% of participants ex-perienced a catastrophic health expenditure ≥10% in 2014 and 2015, respectively. This rate was higher than those
found in previous studies, and higher than the average rate in 133 countries (11.7%), higher than the average in Asian countries (12.8%), and higher than the average in European (7.2%) and Oceanian countries (3.9%) [27]. In previous studies [27], catastrophic healthcare expenditure was calculated as the ratio of out-of-pocket health spend-ing to total household consumption, which may be differ-ent from this study. Despite this difference, South Korea has higher out-of-pocket health spending than any OECD country [5] and an extremely low upper limit on out-of- pocket health spending [28]. Therefore, people are more likely to experience catastrophic healthcare expenditure and thus face a higher chance of experiencing unmet
healthcare needs.
In particular, the rate of catastrophic health expenditure was higher among the elderly than among the non-elderly. The rate of catastrophic health expenditures ≥10% was about two times higher among the elderly than among the non-elderly, and the rate of catastrophic health expen-ditures ≥40% was about five times higher among the eld-erly than among the non-eldeld-erly. Eldeld-erly people are less economically active than their young counterparts, result-ing in a decreased ability to pay medical expenses. In contrast, they tend to rely more on medical services than young people, resulting in higher medical expenses. There-fore, the elderly is more likely to experience catastrophic healthcare expenditure than others. Because the private health insurance purchase rate is higher among the non- elderly, it seems that the rate of unmet healthcare needs due to financial reasons was lower among the non-elderly due to their higher private health insurance purchase rate, and so they resolve healthcare costs using their private health insurance. According to the KHP data, private health purchase rates in 2014 were highest among people in their 30s~50s (82.9~84.1%) and began to decrease among peo-ple in their 60s or older, with a 70.6% rate among those in their 60s, 31.6% among those in their 70s, and 5.6% among those 80 or older [29].
However, the association between catastrophic health expenditures and unmet healthcare needs due to financial reasons is unclear. Among the elderly, the odds ratio (OR) of experiencing unmet healthcare needs due to financial reasons was 1.06 for people with one catastrophic health expenditure (≥20%) and 1.68 for people with two cata-strophic health expenditures (≥20%), and only the OR of 1.68 for the latter group was significant. On the other hand, among the non-elderly, the OR of experiencing un-met healthcare needs due to financial reasons was 0.76 for people with one catastrophic health expenditure (≥10%). Only the OR of 0.50 for the latter group was significant. In a previous study, people who experienced a catastrophic health expenditure (≥10%) only in the preceding year and those who experienced an additional catastrophic health expenditure (≥10%) in the current year were more likely to experience unmet healthcare needs due to financial rea-sons [3]. However, the study in question excluded income from the independent variables and did not classify partic-ipants into different age groups, so it is not appropriate to compare their findings with ours.
In the present study, there may be two reasons for the result that facing catastrophic health expenditures low-ered the rate of unmet healthcare needs due to financial reasons, both of which seem to be related to our study's
limitations. First, sufficient utilization of healthcare serv-ices for various reasons may increase one's likelihood of facing catastrophic health expenditures. Because the expe-rience of catastrophic health expenditures and unmet healthcare needs due to financial reasons are surveyed ev-ery year, the high variability of these variables is reflected unlike for socioeconomic status, and it is unclear which of the two variables precedes the other. Second, theoretically, catastrophic health expenditures lead to a failure to ad-equately utilize necessary healthcare services, and thus is highly likely to result in unmet healthcare needs. In partic-ular, people with severe disease who face catastrophic health expenditures may be more likely to experience un-met healthcare needs. However, an individual's current experience of unmet healthcare needs was measured based on a self-reported response to a question about one's fail-ure to utilize healthcare services, despite wanting to do so, due to financial reasons in the past year. Further, most of the subjects had a mild, as opposed to severe, disease. Hence, this study is limited in its ability to empirically an-alyze the association between catastrophic health ex-penditures and unmet healthcare needs.
This study found no causal relationship between unmet healthcare needs due to financial reasons and the experi-ence of catastrophic health expenditure ≥30% and ≥40% by elderly and non-elderly people. This result may be as-sociated with the study limitation of most subjects being mildly ill rather than severely ill. Therefore, further re-search on the relationship between unmet healthcare needs and the experience of catastrophic health expenditure by severely ill patients is recommended.
The limitation of this study is that when using logistic regression analysis, we excluded those who experienced unmet healthcare needs due to other reasons. The associa-tion between unmet healthcare needs due to financial rea-sons and those who have not, which is of interest in this paper may be different in case of those who experienced unmet healthcare needs due to other reasons. This should be taken into account when interpreting the results. Thus, Further research is needed on the relevance of catastrophic health expenditures to unmet healthcare needs experience groups for other reasons.
CONCLUSION
Compared to the non-elderly, the elderly is more likely to experience unmet healthcare needs due to financial rea-sons and more likely to experience repeated catastrophic health expenditures. To reduce the incidence of unmet healthcare needs due to financial reasons, the non-elderly
need income security and stable jobs, while the elderly need income security, particularly for low-income indivi-duals, and policies that support people repeatedly facing catastrophic health expenditures.
REFERENCES
1. Song HY, Choi JW, Park EC. The effect of economic partic-ipatory change on unmet needs of health care among Korean adults. Health Policy and Management. 2015;25(1):11-21. https://doi.org/10.4332/KJHPA.2015.25.1.11
2. Jeong YH. Activity restrictions and unmet healthcare needs based on Korea health panel data [Internet]. Health and Social Welfare issue & focus. Sejong: Korea Institute Health and Social Affairs; 2012 [cited 2019 September 12]. Available from: https://www.kihasa.re.kr/web/publication/periodical/issue _view.do?pageIndex=26&keyField=&searchStat=&menuId= 50&key=&tid=38&bid=21&searchForm=&aid=120&ano=1 3. Jung HW, LeeJH. Effect of experience of catastrophic health
expenditure on unmet medical need caused by economic reason. The KoreanJournal of Health Economics and Policy. 2017;23(1):27-51.
4. Eurostat. Self-reported unmet needs for medical examination by sex, age, main reason declared and groups of country of cit-izenship [Internet]. Luxembourg: European Commission; 2016 [cited 2019 November 20]. Available from:
https://ec.europa.eu/eurostat/data/database
5. Korea Institute for Health and Social Affairs/Ministry of Health & Welfare. OECD health statistics 2017[Internet]. Sejong: Ko-rea Institute for Health and Social Affairs/Ministry of Health & Welfare; 2017 [cited 2019 September 12]. Available from: http://www.mohw.go.kr/react/jb/sjb030301vw.jsp?PAR_ME NU_ID=03&MENU_ID=032901&CONT_SEQ=341573&page=1 6. Huh SI. Trend of medical expenses burden by income level
[Internet]. Health and Social Welfare Forum. Sejong: Korea Institute Health and Social Affairs; 2009 [cited 2019 November 20]. Available from: https://www.kihasa.re.kr/web/publication/periodical/sear ch_view.do?menuId=48&tid=38&bid=19&searchForm=Y& keyField=title&key=%EC%86%8C%EB%93%9D+%EA%B3% 84%EC%B8%B5%EB%B3%84+%EC%9D%98%EB%A3%8C% EB%B9%84+%EB%B6%80%EB%8B%B4%EC%9D%98+%EC %B6%94%EC%9D%B4&aid=154&ano=6
7. Huh SI, Kim CB. An evaluation of benefit extension strategies of the Korea National Health Insurance. Health Policy and Ma-nagement. 2009;19(3):142-165.
8. Lee SY, Kim CW, KangJH, Seo NK. Unmet healthcare needs depending on employment status. Health Policy. 2015;119(7): 899-906. https://doi.org/10.1016/j.healthpol.2014.09.007 9. Xu K. Distribution of health payments and catastrophic
ex-penditures methodology [Internet]. Geneva: World Health Organization; 2005 [cited 2019 November 20]. Available from: https://apps.who.int/iris/handle/10665/69030
10. Xu K, Evans DB, Kawabata K, Zeramdini R, KlavusJ, Murray JL. Household catastrophic health expenditure: A multicountry analysis. Lancet. 2013;362(9378):111-117.
https://doi.org/10.1016/S0140-6736(03)13861-5
11. Kim YH, Yang BM. Relationship between catastrophic health expenditures and household incomes and expenditure pat-terns in South Korea. Health Policy. 2011;100(2-3):239-246. https://doi.org/10.1016/j.healthpol.2010.08.008
12. KangJH, Kim CW. Relationship between catastrophic health expenditures and income quintile decline. Osong Public Health and Research Perspectives. 2018;9(2):73-80.
https://doi.org/10.24171/j.phrp.2018.9.2.06
13. Jung YI, Lee HJ, Lee TJ, Kim HS. Measures of household cata-strophic health expenditure: Systematic review and implica-tions. The KoreanJournal of Health Economics and Policy. 2013;19(4):1-27.
14. Sohn SI, Shin YJ, Kim CY. Factors influencing household cata-strophic health expenditure of the poor. Health and Social Welfare Review. 2010;30(1):92-110.
15. ChoiJK,Jeong HS, ShinJW, YeoJY. Effects of the benefit ex-tension policy on the burdening of health care expenditure for households with patients of chronic or serious case. Health Policy and Management. 2011;21(2):159-178.
https://doi.org/10.4332/KJHPA.2011.21.2.159
16. LimJH. Analysis of unmet medical need status based on the Korean health panel. Health and Social Science. 2013;34:237- 256.
17. Kim HA. A research on factors influencing medical use and expenditure of patients with chronic diseases [dissertation]. [Seoul]: Ewha Womans University; 2019. 71 p.
18. Yoon HS, Kwon YJ. Private medical insurance subscription and current status of medical use [Internet]. Sejong: KDI Policy Forum; 2008 [Cited 2019 November 20]. Available from: http://www.kdi.re.kr/research/subjects_view.jsp?pub_no= 10534&pg=10&pp=10&mcd=001003002
19. Charlson ME, Pompei P, Ales KL, MacKenzie CR. A new meth-od of classifying prognostic comorbidity in longitudinal stud-ies: Development and validation.Journal of Chronic Disease. 1987;40(5):373-383.
https://doi.org/10.1016/0021-9681(87)90171-8
20. Melfi C, Holleman E, Arthur D, Katz B. Selecting a patient cha-racteristics index for the prediction of medical outcomes using administrative claims data.Journal of Clinical Epidemiology. 1995;48(7):917-926.
https://doi.org/10.1016/0895-4356(94)00202-2
21. Kim KH. Comparative study on three algorithms of the ICD-10 Charlson comorbidity index with myocardial infarction
pati-ents.Journal of Preventive Medicine and Public Health. 2010; 43(1):42-49. https://doi.org/10.3961/jpmph.2010.43.1.42 22. Seo NK, Ahn SZ, Kang TU, Hwang YH. The study of
estimat-ing household catastrophic health expenditure usestimat-ing Korea Health Panel Data. The KoreanJournal of Health Economics and Policy. 2015;21(1):79-102.
23. Eurostat. Self-reported unmet needs for specific health care- related services due to financial reasons by sex, age and educa-tional attainment level [Internet]. Luxembourg: European Com-mission; 2020 [cited 2020 February 24]. Available from: https://appsso.eurostat.ec.europa.eu/nui/show.do?dataset= hlth_ehis_un2e&lang=en
24. Paris V, Hewlett E, Auraaen A, AlexaJ, Simon L. Health care coverage in OECD countries in 2012. OECD Health Working Papers. 2016;88. https://doi.org/10.1787/5jlz3kbf7pzv-en 25. Kang HJ, Ha SL, Lee SG, Kim SE, HongJS, Lee KS. 2015 Korea
medical quality report: achievements and tasks of medical system for improving quality of medical service [Internet]. Sejong: Korea Institute Health and Social Affairs; 2015 [cited 2019 December 22]. Available from:
https://www.kihasa.re.kr/web/publication/research/view. do?division=001&ano=1959&menuId=44&tid=71&bid=12 26. Choi HY, Ryu SY. Factors associated with the types of unmet
health care needs among the elderly in Korea. The Korean Journal of Health Service Management. 2017;11(2):65-79. https://doi.org/10.12811/kshsm.2017.11.2.065
27. Wagstaff A, Flores G, HsuJ, Smitz MF, Chepynoga K, Buisman LR, et al. Progress on catastrophic health spending in 133 countries: A retrospective observational study. The Lancet Global Health. 2018;6(2):169-179.
https://doi.org/10.1016/S2214-109X(17)30429-1
28. Kim SH, Choi EH. Analysis of the impact of system improve-ment and research on policy measures [Internet]. Institute for Health Insurance Policy; 2015 [Cited 2019 December 28] Avail-able from:
https://www.nhis.or.kr/menu/retriveMenuSet.xx?menuId= G9200
29. Seo NK, Kang TW, Huh SI, Lee LJ, Kim DS, Lim BM, et al. 2016 Korea medical panel In-depth analysis report: The Korean health system that focused on healthcare indicators [Internet]. Sejong: National Health Insurance Service/Health Insurance Policy Research Institute; 2017 [cited 2019 November 22]. Available from:
https://www.khp.re.kr:444/web/research/board/view.do? bbsid=13&seq=1494