들어가는 말
식생활은 건강상태의 결정요인으로 질병 예방을 위해서는
올바른 식생활 관리가 매우 중요하다. 이에 많은 국가 단위
조 사 에서 식생활 현황 을 지속 적으 로 평가하고 이를 영양
정책 수립이나 건강증진을 위한 지침 개발에 반영하고 있다[1].
우리나라의 경우에도 아침식사 결식률 증가, 외식 빈도 증가,
영양소 섭취 불균형 등 우리나라 국민의 식생활 현황을 파악하고
이를 반영한 제4차 국민건강증진종합계획(HP2020)을 추진하고
있다[2]. HP2020은 금연, 절주, 신체활동, 영양 등의 27개 중점과제,
357개 성과지표로 구성되어있고, 건강 식생활 실천율, 아침식사
결식률 등을 영양부문의 성과지표로 포함하고 있다. 이 연구에서는
HP2020의 영양지표를 중심으로 우리나라 국민의 식생활 현황을
평가하였다.
몸 말
우리 국민의 식생활 현황 : 제4차
국민건강증진종합계획 영양지표를 중심으로
질병관리본부 질병예방센터 건강영양조사과 윤성하, 오경원* *교신저자 : kwoh27@korea.kr, 043-719-7460Dietary and nutritional status of Koreans based on the Health Plan 2020
nutrition indicators
Yun Sungha, Oh Kyungwon
Division of Health and Nutrition Survey, Center for Disease Control and Prevention, KCDC
The objective of this study was to examine the dietary and nutritional status of Koreans based on the 4th Health Plan 2020 (HP2020) nutrition indicators. Analysis was performed using data from the Korea National Health and Nutrition Examination Survey IV-VI (2007-2015). Only two indicators met the HP2020 target: “Decrease the proportion of the elderly (aged 75 years or older) with insufficient intake of nutrients" and "Increase the proportion of population with adequate intake of riboflavin". The remaining indicators, including “Increase healthy eating practice rate,”need to be improved. It seems that many efforts are needed to achieve the goals of “Decrease the proportion of population who skip breakfast”, “Proportion of population with adequate intake of Vitamin A”, and “Increase the proportion of population receiving nutrition education or counseling."
이 연구에서는 HP2020 영양지표 중 국민건강영양조사에서
산출이 가능하고 식생활과 영양섭취와 관계된 11개 성과지표의 추이
및 생애주기별 현황을 분석하였다. 분석 자료는 국민건강영양조사
제4기(20 07~20 09)~제6기(2013~2015)를 활용하였으며
기수별(3개년 통합)로 지표 현황을 산출하였다. 영양소 섭취량은
2007~2012년 자료는 식품성분표 제7개정판[3], 2013~2015년
< 제4차 국민건강증진종합계획 영양부문 11개 성과지표 현황 >
성과지표 (2008년)기준 '13-'15년 (2020년)목표 현황1) 건강 식생활 실천 인구비율을 증가 또는 유지시킨다. 건강 식생활 실천율 증가(만6세 이상) 30.2% 37.6%2) 48.6% 개선 지방을 적정수준으로 섭취하는 인구비율 증가(만1세 이상) 44.5% 45.0% 50.0% -나트륨을 1일 2,000 mg 이하로 섭취하는 인구비율 증가(만6세 이상) 12.8% 20.9% 30.8% 개선 과일과 채소를 1일 500 g 이상 섭취하는 인구비율 증가(만6세 이상) 35.2% 37.5% 41.2% 개선 가공식품 선택 시 영양표시 이용률 증가(초등학생 이상) 22.3% 25.8% 30.0% 개선 생애주기별 영양관리를 강화한다. 아침식사 결식률 감소(만1세 이상) 21.9% 24.7% 18.3% 악화 영양섭취 부족 노인(만75세 이상) 인구비율 감소 29.9% 12.5% 26.3% 달성 영양교육 및 상담 경험률(초등학생 이상) 증가 8.1% 8.1% 20.0% -미량 영양소 적정섭취 인구비율을 증가시킨다. 칼슘을 적정수준으로 섭취하는 인구비율(만1세 이상) 17.0% 17.0% 21.0% -비타민 A를 적정수준으로 섭취하는 인구비율 증가(만1세 이상) 39.7% 34.2% 49.2% 악화 리보플라빈을 적정수준으로 섭취하는 인구비율 증가(만1세 이상) 34.0% 48.9% 42.2% 달성 1) 현황 분류 기준은 제4차 국민건강증진종합계획 2017년 동향보고서 참고 •달성 : 2020년 목표치 달성 및 초과한 지표 •개선 : 2020년 목표치에 접근하는 지표(기준치에서 개선된 지표) •악화 : 2020년 목표치에서 멀어지는 지표(기준치에서 악화되는 지표) •- : 기준치에서 변화가 없거나 변화가 미미한 지표 2) 2005년 추계인구로 연령표준화자료는 식품성분표 제8개정판[4]을 활용하여 산출하였으며, 지방
적정섭취분율 등 지표 산출 시 적용한 영양소 섭취기준은 조사
당시 활용했던 영양소 섭취기준을 활용하였다(2007~2009년, 2005
한국인 영양섭취기준[5]; 2010~2015년, 2010 한국인 영양섭취기준
개정판[6]).
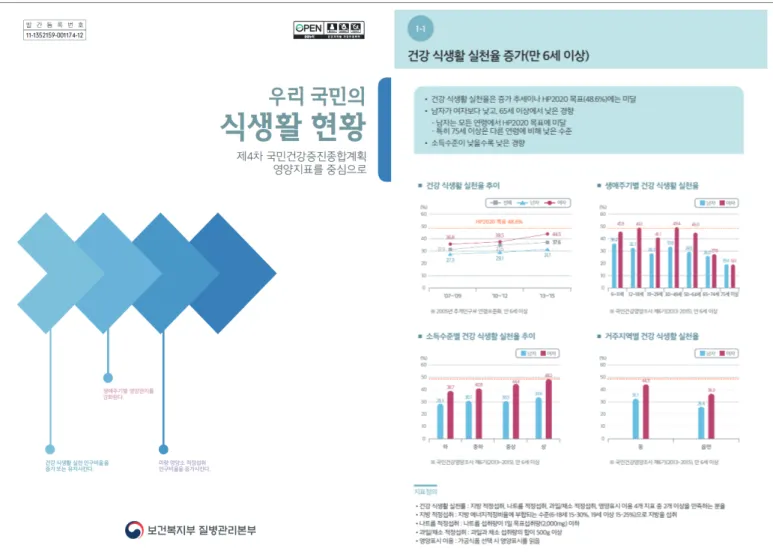
HP2020 영양부문 11개 성과지표의 현황은 다음과 같다.
2013~2015년을 기준으로 HP2020 목표를 달성한 성과지표는
2개였다. 영양부문 대표지표 ‘건강 식생활 실천율’을 포함하여 4개
지표는 아직 목표에는 미달되나 개선되는 경향을 보이고 있었고,
3개 지표는 목표에는 미달되나 기준치와 비슷한 수준을 유지하고
있었다. 2개 지표는 목표치에서 멀어지며 악화되는 경향을 보이고
있었다.
각 지표별 추이 및 세부집단별 현황에 대해 살펴보면, ‘건강
식생활 실천 인구비율을 증가 또는 유지시킨다’를 구성하 는
5개 성과지표 모두 목표에는 미달되나 ‘지방을 적정수준으로
섭취하는 인구비율 증가(이하 지방 적정섭취분율)’를 제외하고
증가 추세로 개선되는 양상이었다. 대부분의 지표는 남자가
여자에 비해 낮았으나 ‘과일과 채소를 1일 500 g 이상 섭취하는
인구비율 증가(이하 과일/채소 적정섭취분율)’는 여자가 남자에
비해 낮았다. 생애주기별로 지표 현황을 살펴보면 ‘건강 식생활
실천율’, ‘지방 적정섭취분율’, ‘가공식품 선택 시 영양표시 이용률’은
65세 이상에서 낮은 경향이었고, ‘나트륨을 1일 2,000 mg 이하로
섭취하는 인구비율 증가’는 19~64세, ‘과일/채소 적정섭취분율’은
6~29세에서 가장 낮았다(Table 1).
‘생애주기별 영양관리를 강화한다’의 성과지표 중 ‘영양섭취
부족 노인(만75세 이상) 인구비율(이하 영양섭취 부족 노인분율)’은
HP2020 목표치를 달성한 것으로 나타났으나, 그 외 ‘아침식사
결식률 감소’와 ‘영양교육 및 상담 경험률(초등학생 이상) 증가’는
HP2020 목표를 달성하지 못하고 있었다. HP2020 목표를
달성하지 못하고 있음에도 불구하고 ‘아침식사 결식률’은 증가
추세로 악화되는 경향이었고, ‘영양교육 및 상담 경험률’은 개선
없이 낮은 수준이 지속되고 있었다. 생애주기별로 지표 현황을
살펴보면 ‘아침식사 결식률’의 경우 19~29세, 12~18세, 30~49세
‘아침식사 결식률’의 감소가 필요한 것으로 나타났으며, ‘영양교육 및
상담경험률’은 6~18세는 목표를 달성하거나 근접해 있는 반면 19세
이상 성인의 경우 10% 미만으로 매우 낮은 수준이었다(Table 1).
‘미량 영양소 적정섭취 인구비율을 증가시킨다’의 성과지표 중
‘리보플라빈을 적정수준으로 섭취하는 인구비율(이하 리보플라빈
적정섭취분율)은 증가 추세로 2013~2015년 HP2020 목표를
달성하였으나 ‘칼슘을 적정수준으로 섭취하는 인구비율(이하 칼슘
적정섭취분율)’과 ‘비타민 A를 적정수준으로 섭취하는 인구비율(이하
비타민 A 적정섭취분율)’은 유지 또는 감소추세를 보이고 있으며
목표에 미달되는 것으로 나타났다. 생애주기별로 살펴보면 ‘칼슘
적정섭취분율’과 ‘비타민 A 적정섭취분율’은 12~18세와 65세
이상에서 낮았고, ‘리보플라빈 적정섭취분율’은 다른 연령은 목표를
달성한 반면 65세 이상은 아직 HP2020 목표를 달성하지 못하고
있었다(Table 1).
맺음말
HP2020 영양부문 11개 성과지표의 현황 및 추이를 살펴본
결과, 2013~2015년을 기준으 로 H P 2020 목표를 달성한
성과지표는 ‘영양섭취 부족 노인분율’과 ‘리보플라빈 적정섭취분율’
2개에 불과했으며, ‘건강 식생활 실천율’을 포함하여 나머지
성과지표는 개선이 필요하였다. ‘건강 식생활 실천율’, ‘나트륨
적정섭취분율’, ‘과일/채소 적정섭취분율’, ‘영양표시 이용률’은
HP2020 목표에는 아직 미달되지만 개선되는 양상을 보이고 있다.
하지만 ‘아침식사 결식률’과 ‘비타민 A 적정섭취분율’은 기준치보다
악화되는 양상이고, ‘영양교육 및 상담 경험률(초등학생 이상)’은
목표치와 10%p 이상의 큰 차이를 보이고 있으나 지속적으로 낮은
수준을 유지하고 있어 개선 방안 마련이 필요한 것으로 보인다.
이 연 구 에 서 는 H P 2 0 2 0 영 양 부 문 성 과지 표 11개의
현황을 국민건강영양조사 기수별로 추이를 분석하여 연도별로
결 과 를 제 시 하 는 「제 4 차 국 민건 강 증 진 종 합 계 획 2 0 1 7 년
동향보고서」(건강증진개발원, 2017)나 「건강행태 및 만성질환
Unit: % HP2020 target Total Men Women KNHANES IV (2007-2009) KNHANES V (2010-2012) KNHANES VI (2013-2015) KNHANES IV (2007-2009) KNHANES V (2010-2012) KNHANES VI (2013-2015) KNHANES IV (2007-2009) KNHANES V (2010-2012) KNHANES VI (2013-2015)
Increase or maintain healthy eating practice rate Increase health eating practice rate
1) 6 yr+ 48.6 31.4 (0.4) 32.7 (0.4) 36.9 (0.5) 27.3 (0.6) 28.8 (0.6) 30.7 (0.6) 35.5 (0.6) 36.6 (0.6) 43.0 (0.6) 6 yr+ (age-standardized)* 31.9 (0.4) 33.6 (0.4) 37.6 (0.5) 27.3 (0.6) 29.1 (0.6) 31.1 (0.6) 36.8 (0.6) 38.5 (0.6) 44.5 (0.6) 6-11 yr 32.6 (1.3) 32.5 (1.4) 40.8 (1.5) 32.1 (1.8) 29.8 (1.9) 36.2 (2.2) 33.1 (1.8) 35.3 (2.2) 45.9 (2.0) 12-18 yr 35.4 (1.3) 37.4 (1.4) 40.6 (1.4) 29.2 (1.6) 33.9 (1.9) 32.7 (1.8) 42.7 (1.8) 41.6 (2.0) 49.1 (2.0) 19-29 yr 34.2 (1.2) 36.5 (1.3) 34.3 (1.2) 27.6 (1.7) 31.0 (1.8) 28.2 (1.6) 41.2 (1.6) 42.3 (1.7) 41.1 (1.7) 30-49 yr 37.3 (0.7) 38.6 (0.7) 41.4 (0.8) 30.8 (1.0) 31.5 (1.0) 33.6 (1.1) 44.2 (0.9) 46.0 (1.0) 49.4 (1.0) 50-64 yr 25.3 (0.9) 28.0 (0.8) 37.3 (0.9) 23.4 (1.2) 25.2 (1.1) 29.5 (1.3) 27.2 (1.2) 30.8 (1.1) 45.0 (1.1) 65-74 yr 14.2 (1.0) 16.9 (0.9) 26.9 (1.0) 15.6 (1.5) 18.6 (1.3) 26.0 (1.4) 13.1 (1.1) 15.5 (1.1) 27.6 (1.3) 75 yr+ 10.4 (1.0) 9.9 (1.0) 19.2 (1.0) 9.8 (1.6) 11.4 (1.5) 19.4 (1.6) 10.8 (1.2) 9.1 (1.1) 19.1 (1.4)
Increase the proportion of population with adequate intake of fat
2) 1 yr+ 50.0 44.1 (0.5) 44.1 (0.5) 43.1 (0.5) 46.6 (0.7) 46.9 (0.7) 44.1 (0.6) 41.6 (0.6) 41.3 (0.6) 42.1 (0.6) 1 yr+ (age-standardized) 44.9 (0.4) 45.5 (0.5) 45.0 (0.4) 46.6 (0.6) 47.4 (0.7) 45.3 (0.6) 43.3 (0.6) 43.8 (0.6) 44.9 (0.6) 1-5 yr 60.3 (1.4) 62.1 (1.7) 65.7 (1.4) 61.9 (1.9) 61.6 (2.3) 66.3 (1.9) 58.6 (2.0) 62.7 (2.3) 65.0 (2.1) 6-11 yr 66.9 (1.3) 68.5 (1.6) 66.6 (1.5) 68.6 (1.6) 68.7 (1.9) 65.4 (1.9) 64.9 (1.8) 68.3 (2.1) 68.0 (1.9) 12-18 yr 67.3 (1.2) 64.3 (1.5) 63.9 (1.4) 67.6 (1.6) 67.1 (1.9) 61.3 (1.9) 66.9 (1.7) 60.9 (2.0) 66.7 (1.9) 19-29 yr 42.9 (1.3) 41.4 (1.4) 36.2 (1.2) 41.6 (1.9) 41.8 (2.1) 36.0 (1.8) 44.3 (1.6) 41.0 (1.8) 36.4 (1.7) 30-49 yr 44.0 (0.7) 45.2 (0.8) 43.8 (0.8) 46.3 (1.1) 46.5 (1.1) 44.4 (1.2) 41.5 (0.9) 43.8 (0.9) 43.1 (1.0) 50-64 yr 32.2 (0.9) 35.1 (0.9) 37.8 (0.9) 36.0 (1.3) 38.9 (1.3) 38.9 (1.3) 28.5 (1.2) 31.4 (1.1) 36.7 (1.1) 65-74 yr 20.8 (1.1) 22.8 (1.1) 28.7 (1.1) 23.8 (1.6) 28.6 (1.5) 31.8 (1.6) 18.4 (1.3) 18.1 (1.2) 26.1 (1.3) 75 yr+ 17.6 (1.3) 18.2 (1.2) 21.6 (1.2) 19.9 (2.2) 22.8 (1.9) 23.9 (1.8) 16.4 (1.5) 15.7 (1.5) 20.3 (1.5)
Table 1.
Health Plan 2020 nutrition indicator status among subjects in t
Unit: % HP2020 target Total Men Women KNHANES IV (2007-2009) KNHANES V (2010-2012) KNHANES VI (2013-2015) KNHANES IV (2007-2009) KNHANES V (2010-2012) KNHANES VI (2013-2015) KNHANES IV (2007-2009) KNHANES V (2010-2012) KNHANES VI (2013-2015) 30.8 13.4 (0.3) 13.1 (0.3) 21.3 (0.4) 7.3 (0.3) 6.9 (0.3) 12.6 (0.4) 19.5 (0.5) 19.3 (0.5) 30.0 (0.5) 13.3 (0.3) 12.9 (0.3) 20.9 (0.4) 7.5 (0.3) 7.1 (0.3) 12.8 (0.5) 19.1 (0.5) 18.7 (0.5) 29.1 (0.5) 26.2 (1.2) 25.6 (1.2) 34.0 (1.3) 21.6 (1.4) 20.7 (1.6) 26.9 (1.7) 31.0 (1.8) 30.7 (1.9) 42.0 (2.0) 14.3 (0.9) 12.9 (0.9) 23.6 (1.2) 7.9 (1.0) 7.6 (1.0) 16.2 (1.5) 21.9 (1.6) 19.3 (1.6) 31.7 (1.9) 12.7 (0.8) 12.1 (0.9) 19.4 (1.0) 7.4 (1.0) 6.2 (1.1) 11.7 (1.2) 18.3 (1.2) 18.4 (1.4) 27.9 (1.6) 7.9 (0.4) 7.6 (0.4) 14.7 (0.5) 3.0 (0.4) 2.8 (0.4) 7.4 (0.6) 13.0 (0.6) 12.6 (0.7) 22.3 (0.8) 11.7 (0.6) 11.6 (0.6) 20.0 (0.7) 5.4 (0.6) 6.0 (0.7) 10.7 (0.8) 17.9 (1.0) 17.2 (0.8) 29.2 (1.1) 20.5 (1.0) 22.1 (1.0) 29.6 (1.0) 12.4 (1.2) 12.5 (1.1) 18.0 (1.3) 26.9 (1.4) 29.9 (1.5) 39.4 (1.5) 34.9 (1.5) 33.8 (1.6) 43.8 (1.6) 21.6 (2.1) 20.6 (2.1) 31.9 (1.9) 41.6 (1.9) 40.8 (2.0) 50.3 (2.0) 41.2 35.5 (0.5) 37.3 (0.6) 39.2 (0.5) 38.0 (0.7) 40.5 (0.7) 40.9 (0.7) 33.1 (0.6) 34.2 (0.7) 37.5 (0.6) 35.3 (0.5) 36.7 (0.6) 37.5 (0.5) 37.7 (0.7) 39.9 (0.7) 39.4 (0.7) 32.9 (0.6) 33.6 (0.7) 35.6 (0.6) 18.7 (1.1) 19.2 (1.1) 22.0 (1.2) 19.5 (1.4) 20.4 (1.7) 20.9 (1.7) 17.7 (1.3) 17.9 (1.5) 23.2 (1.8) 20.9 (1.2) 23.8 (1.3) 23.2 (1.2) 21.3 (1.5) 26.3 (1.8) 25.1 (1.7) 20.5 (1.6) 20.7 (1.7) 21.0 (1.7) 29.5 (1.2) 30.2 (1.3) 27.3 (1.2) 31.9 (1.9) 34.3 (2.0) 29.8 (1.7) 27.0 (1.4) 25.9 (1.5) 24.4 (1.5) 43.4 (0.8) 44.2 (0.9) 43.4 (0.8) 45.8 (1.2) 47.2 (1.2) 46.2 (1.2) 40.9 (0.9) 41.0 (1.1) 40.6 (1.0) 45.1 (1.0) 48.1 (1.0) 52.9 (1.0) 47.9 (1.5) 49.5 (1.5) 51.8 (1.4) 42.4 (1.3) 46.8 (1.3) 54.1 (1.2) 33.4 (1.2) 35.5 (1.2) 44.1 (1.3) 39.8 (1.8) 42.6 (1.7) 47.9 (1.8) 28.4 (1.5) 29.7 (1.4) 40.9 (1.6) 22.1 (1.5) 22.0 (1.4) 28.7 (1.4) 25.7 (2.5) 28.8 (2.0) 34.8 (2.2) 20.2 (1.8) 18.4 (1.5) 25.4 (1.6)
(Continued)
Health Plan 2020 nutrition indicator status among subjects in
the Korea National Health and Nutrition Survey IV-VI (2007-2015
Unit: % HP2020 target Total Men Women KNHANES IV (2007-2009) KNHANES V (2010-2012) KNHANES VI (2013-2015) KNHANES IV (2007-2009) KNHANES V (2010-2012) KNHANES VI (2013-2015) KNHANES IV (2007-2009) KNHANES V (2010-2012) KNHANES VI (2013-2015)
Increase the proportion of population using nutrition labels 6 yr+
30.0 23.3 (0.4) 24.2 (0.4) 24.3 (0.4) 15.5 (0.5) 16.5 (0.6) 17.2 (0.5) 31.2 (0.6) 31.8 (0.6) 31.4 (0.6) 6 yr+ (age-standardized) 23.8 (0.4) 25.4 (0.4) 25.8 (0.4) 15.5 (0.5) 17.1 (0.6) 18.1 (0.5) 32.6 (0.5) 34.2 (0.6) 33.9 (0.6) 6-11 yr 11.9 (0.9) 12.4 (1.0) 11.4 (1.0) 12.1 (1.2) 11.7 (1.4) 12.7 (1.3) 11.6 (1.2) 13.2 (1.5) 9.9 (1.4) 12-18 yr 24.8 (1.1) 28.6 (1.3) 25.7 (1.2) 18.0 (1.2) 21.0 (1.5) 18.9 (1.5) 32.8 (1.7) 37.7 (1.9) 33.0 (1.9) 19-29 yr 34.1 (1.2) 39.9 (1.3) 35.7 (1.3) 24.3 (1.7) 30.5 (2.0) 28.4 (1.6) 44.5 (1.7) 49.9 (1.8) 43.9 (1.7) 30-49 yr 30.9 (0.7) 31.2 (0.7) 33.3 (0.7) 17.6 (0.8) 18.1 (0.9) 21.1 (1.0) 44.7 (0.9) 44.8 (1.0) 46.0 (1.1) 50-64 yr 14.0 (0.7) 13.5 (0.6) 16.9 (0.7) 8.2 (0.8) 7.9 (0.7) 9.2 (0.7) 19.7 (1.0) 18.9 (1.0) 24.5 (1.0) 65-74 yr 3.8 (0.5) 4.2 (0.5) 6.1 (0.6) 3.5 (0.8) 4.0 (0.7) 5.9 (0.8) 4.0 (0.6) 4.3 (0.6) 6.3 (0.7) 75 yr+ 1.2 (0.4) 0.7 (0.3) 2.1 (0.4) 2.4 (1.2) 1.2 (0.5) 3.2 (0.8) 0.6 (0.2) 0.5 (0.3) 1.5 (0.4)
Strengthen nutrition management by life cycle Decrease the proportion of population who skip breakfast 1 yr+
18.3 21.5 (0.5) 21.1 (0.5) 23.0 (0.5) 22.2 (0.6) 21.6 (0.6) 24.7 (0.6) 20.7 (0.6) 20.7 (0.6) 21.3 (0.5) 1 yr+ (age-standardized) 22.1 (0.5) 22.2 (0.5) 24.7 (0.5) 22.5 (0.6) 22.2 (0.6) 26.0 (0.6) 21.7 (0.5) 22.2 (0.6) 23.3 (0.6) 1-5 yr 9.2 (1.0) 8.6 (1.1) 8.4 (1.0) 9.2 (1.2) 8.8 (1.6) 8.5 (1.3) 9.2 (1.3) 8.4 (1.5) 8.4 (1.3) 6-11 yr 11.1 (0.9) 11.0 (1.0) 12.6 (1.1) 10.8 (1.1) 9.3 (1.1) 13.3 (1.6) 11.4 (1.2) 12.7 (1.5) 11.8 (1.3) 12-18 yr 28.5 (1.4) 29.6 (1.5) 32.2 (1.4) 27.3 (1.6) 29.2 (1.7) 31.0 (1.8) 30.0 (1.9) 30.1 (2.1) 33.6 (2.0) 19-29 yr 45.1 (1.4) 40.6 (1.4) 43.5 (1.4) 46.2 (2.0) 37.4 (2.0) 46.5 (2.0) 44.1 (1.7) 44.0 (1.9) 40.1 (1.8) 30-49 yr 22.7 (0.7) 25.0 (0.7) 28.3 (0.8) 24.7 (1.0) 27.4 (1.1) 31.3 (1.2) 20.6 (0.8) 22.5 (0.9) 25.1 (0.9) 50-64 yr 10.5 (0.6) 11.1 (0.7) 13.2 (0.7) 8.9 (0.8) 10.1 (0.9) 12.3 (0.9) 12.1 (0.9) 12.0 (0.8) 14.0 (0.8) 65-74 yr 5.1 (0.6) 4.6 (0.5) 5.8 (0.6) 3.4 (0.7) 2.8 (0.5) 5.1 (0.8) 6.4 (0.8) 6.0 (0.9) 6.5 (0.8) 75 yr+ 5.6 (0.8) 3.5 (0.6) 5.5 (0.7) 3.7 (1.0) 3.1 (1.1) 3.3 (0.8) 6.5 (1.0) 3.7 (0.7) 6.7 (0.9)
Decrease the proportion of elderly population with insufficient intake of nutrients
3) 75 yr+ 32.1 (1.7) 23.0 (1.4) 12.5 (1.0) 22.9 (2.3) 18.4 (2.0) 10.1 (1.3) 36.8 (2.1) 25.5 (1.8) 13.9 (1.3)
Table 1.
(Continued)
Health Plan 2020 nutrition indicator status among subjects in
the Korea National Health and Nutrition Survey IV-VI (2007-2015
Unit: % HP2020 target Total Men Women KNHANES IV (2007-2009) KNHANES V (2010-2012) KNHANES VI (2013-2015) KNHANES IV (2007-2009) KNHANES V (2010-2012) KNHANES VI (2013-2015) KNHANES IV (2007-2009) KNHANES V (2010-2012) KNHANES VI (2013-2015) 20.0 8.3 (0.3) 6.3 (0.2) 7.0 (0.2) 8.0 (0.3) 5.6 (0.3) 6.4 (0.3) 8.5 (0.4) 7.0 (0.3) 7.7 (0.3) 8.4 (0.3) 6.8 (0.2) 8.1 (0.3) 8.0 (0.3) 5.9 (0.3) 7.3 (0.3) 8.8 (0.4) 7.7 (0.3) 8.9 (0.4) 24.9 (1.3) 29.1 (1.5) 35.6 (1.7) 26.4 (1.7) 28.4 (2.0) 35.8 (2.1) 23.4 (1.7) 29.8 (1.9) 35.4 (2.3) 21.5 (1.1) 13.8 (1.0) 20.0 (1.1) 20.7 (1.5) 14.4 (1.3) 17.7 (1.5) 22.4 (1.7) 13.2 (1.3) 22.5 (1.7) 4.5 (0.5) 3.5 (0.5) 2.7 (0.4) 4.2 (0.7) 2.6 (0.7) 1.5 (0.5) 5.0 (0.7) 4.5 (0.7) 4.0 (0.6) 4.9 (0.3) 3.6 (0.3) 3.8 (0.3) 4.4 (0.4) 2.2 (0.3) 3.0 (0.4) 5.5 (0.4) 5.0 (0.5) 4.5 (0.4) 5.9 (0.4) 3.8 (0.4) 4.3 (0.4) 5.0 (0.6) 3.3 (0.5) 4.2 (0.5) 6.7 (0.6) 4.4 (0.4) 4.3 (0.5) 6.0 (0.6) 4.4 (0.5) 5.1 (0.5) 5.0 (0.8) 3.7 (0.6) 4.4 (0.7) 6.8 (0.9) 4.9 (0.7) 5.6 (0.7) 3.9 (0.7) 4.5 (0.7) 5.4 (0.8) 5.1 (1.4) 4.1 (0.8) 4.2 (0.9) 3.3 (0.7) 4.8 (0.9) 6.1 (1.1) 4) 21.0 16.6 (0.4) 20.2 (0.4) 16.9 (0.3) 22.0 (0.5) 23.4 (0.6) 19.3 (0.5) 11.2 (0.4) 17.1 (0.5) 14.5 (0.4) 16.8 (0.4) 20.5 (0.4) 17.0 (0.4) 22.1 (0.5) 23.4 (0.6) 19.1 (0.5) 11.5 (0.4) 17.6 (0.5) 14.8 (0.4) 24.5 (1.3) 32.9 (1.7) 22.2 (1.3) 27.1 (1.7) 36.1 (2.3) 22.7 (1.7) 21.5 (1.8) 29.6 (2.3) 21.8 (1.9) 14.4 (1.0) 16.3 (1.0) 13.8 (1.0) 17.4 (1.3) 19.1 (1.5) 17.7 (1.5) 11.2 (1.2) 13.4 (1.4) 9.5 (1.2) 7.4 (0.7) 11.0 (0.9) 8.6 (0.8) 8.2 (0.9) 12.6 (1.3) 9.1 (1.1) 6.4 (1.0) 9.2 (1.1) 8.1 (1.1) 18.3 (1.1) 19.8 (1.2) 17.0 (1.0) 24.5 (1.8) 23.3 (1.9) 18.3 (1.5) 11.7 (1.0) 16.1 (1.3) 15.4 (1.2) 19.4 (0.6) 23.3 (0.7) 19.3 (0.6) 25.1 (1.0) 24.9 (1.0) 21.3 (1.0) 13.4 (0.7) 21.6 (0.9) 17.2 (0.7) 17.4 (0.7) 22.7 (0.8) 20.4 (0.8) 25.2 (1.3) 27.7 (1.3) 23.8 (1.2) 9.6 (0.7) 17.7 (0.9) 17.0 (0.9) 12.7 (0.8) 14.9 (0.9) 13.0 (0.8) 19.1 (1.5) 20.0 (1.4) 16.1 (1.2) 7.7 (0.9) 10.7 (1.0) 10.4 (1.0) 7.8 (1.0) 9.2 (1.0) 5.9 (0.8) 13.5 (1.9) 13.1 (1.6) 8.8 (1.3) 4.9 (0.9) 7.1 (1.0) 4.3 (0.9)
(Continued)
Health Plan 2020 nutrition indicator status among subjects in
the Korea National Health and Nutrition Survey IV-VI (2007-2015
Unit: % HP2020 target Total Men Women KNHANES IV (2007-2009) KNHANES V (2010-2012) KNHANES VI (2013-2015) KNHANES IV (2007-2009) KNHANES V (2010-2012) KNHANES VI (2013-2015) KNHANES IV (2007-2009) KNHANES V (2010-2012) KNHANES VI (2013-2015)
Proportion of population with adequate intake of Vitamin A
5) 1 yr+ 49.2 38.5 (0.5) 40.6 (0.5) 33.9 (0.5) 40.5 (0.6) 42.2 (0.7) 35.6 (0.6) 36.5 (0.6) 39.0 (0.6) 32.3 (0.6) 1 yr+ (age-standardized) 38.7 (0.5) 40.7 (0.5) 34.2 (0.5) 40.4 (0.6) 42.1 (0.7) 35.8 (0.6) 36.9 (0.6) 39.4 (0.6) 32.5 (0.6) 1-5 yr 38.7 (1.5) 40.8 (1.5) 44.9 (1.7) 37.4 (1.8) 40.0 (2.2) 48.3 (2.2) 40.1 (2.0) 41.6 (2.2) 41.2 (2.3) 6-11 yr 42.4 (1.3) 43.0 (1.4) 41.2 (1.4) 41.5 (1.7) 42.1 (2.0) 41.7 (1.9) 43.4 (1.7) 43.9 (2.1) 40.5 (2.0) 12-18 yr 26.6 (1.2) 32.9 (1.4) 25.3 (1.2) 27.7 (1.7) 30.6 (1.8) 23.8 (1.7) 25.3 (1.5) 35.6 (1.9) 26.9 (1.7) 19-29 yr 35.5 (1.2) 36.4 (1.3) 29.4 (1.2) 38.5 (1.8) 38.9 (2.0) 31.9 (1.7) 32.4 (1.5) 33.7 (1.7) 26.7 (1.5) 30-49 yr 44.4 (0.8) 45.6 (0.8) 36.6 (0.8) 47.2 (1.0) 48.2 (1.2) 39.4 (1.2) 41.5 (1.0) 43.0 (1.0) 33.8 (0.9) 50-64 yr 42.3 (1.0) 45.0 (1.0) 38.4 (0.9) 43.9 (1.4) 46.0 (1.4) 37.8 (1.3) 40.8 (1.2) 44.0 (1.2) 38.9 (1.1) 65-74 yr 30.3 (1.2) 34.0 (1.2) 27.3 (1.0) 30.3 (1.7) 35.5 (1.6) 28.0 (1.4) 30.2 (1.5) 32.7 (1.5) 26.8 (1.4) 75 yr+ 19.4 (1.4) 21.2 (1.3) 18.2 (1.2) 21.7 (2.4) 25.3 (2.0) 20.4 (1.9) 18.2 (1.6) 19.0 (1.5) 17.0 (1.5)
Proportion of population with adequate intake of riboflavin
6) 1 yr+ 42.2 34.0 (0.5) 41.1 (0.5) 46.6 (0.5) 36.0 (0.7) 43.6 (0.7) 48.7 (0.6) 32.0 (0.6) 38.6 (0.6) 44.4 (0.6) 1 yr+ (age-standardized) 34.9 (0.5) 43.0 (0.5) 48.9 (0.5) 36.4 (0.6) 44.7 (0.7) 50.5 (0.6) 33.5 (0.6) 41.3 (0.6) 47.3 (0.6) 1-5 yr 65.9 (1.5) 73.9 (1.6) 71.1 (1.5) 69.2 (1.8) 76.0 (2.0) 73.8 (2.0) 62.3 (2.0) 71.7 (2.3) 68.2 (2.1) 6-11 yr 64.7 (1.2) 70.5 (1.3) 75.7 (1.2) 62.0 (1.6) 68.4 (1.9) 73.0 (1.7) 67.4 (1.7) 72.8 (1.8) 78.7 (1.6) 12-18 yr 30.7 (1.3) 42.7 (1.4) 43.8 (1.4) 27.2 (1.7) 41.1 (1.9) 43.6 (1.8) 34.9 (1.8) 44.6 (2.0) 44.1 (2.0) 19-29 yr 33.4 (1.3) 42.6 (1.4) 50.0 (1.3) 35.4 (2.0) 46.4 (2.1) 51.5 (1.9) 31.3 (1.6) 38.6 (1.7) 48.3 (1.7) 30-49 yr 34.7 (0.8) 43.2 (0.8) 49.8 (0.8) 38.2 (1.1) 45.8 (1.1) 53.5 (1.1) 31.1 (0.9) 40.4 (1.0) 46.0 (1.0) 50-64 yr 26.4 (0.9) 34.2 (0.9) 42.2 (0.9) 27.7 (1.3) 35.4 (1.3) 41.5 (1.3) 25.0 (1.1) 33.0 (1.1) 42.9 (1.2) 65-74 yr 13.0 (0.9) 17.2 (0.9) 25.8 (1.1) 13.2 (1.3) 19.7 (1.4) 27.0 (1.5) 12.8 (1.1) 15.2 (1.1) 24.7 (1.4) 75 yr+ 9.7 (1.2) 8.6 (1.0) 15.9 (1.1) 10.7 (1.9) 10.4 (1.5) 16.4 (1.5) 9.2 (1.2) 7.6 (1.0) 15.6 (1.4)
*Age-standardized proportion was calculated using the age and s
ex specific structures of estimated population based on the 200
5 Korea Census
1) Practice two indicators the four indicators including appro
priate intake of fat, sodium, and fruit and vegetable, and usin
g nutrition labels.
2) Fat intake within Acceptable macro-nutrient distribution ra
nge.
3) Energy intake below 75% of estimated energy requirements an
d calcium, Vitamin A, iron, and riboflavin intake below estimat
ed average requirements
4) Calcium intake above recommended nutrient intake and below
tolerable upper intake level.
5) Vitamin A intake above recommended nutrient intake and belo
w tolerable upper intake level.
6) Riboflavin intake above recommended nutrient intake.
Table 1.
(Continued)
Health Plan 2020 nutrition indicator status among subjects in
the Korea National Health and Nutrition Survey IV-VI (2007-2015
있으며 영양소 관련 성과지표 현황은 영양소 섭취기준 등에 따라
달라질 수 있으므로 해석 시 유의할 필요가 있다.
질병관리본부에서는 이 연구에서 소개한 내용을 포함하여
각 지 표별로 심층 분 석 결과 를 수 록한 영양통계집 「우리
국민의 식생활현황 : 제4차 국민건강증진종합계획 영양지표를
중심으로」를 발간하였다(Figure 1). 영양통계집은 향후 3년
주기로 발간할 예정이며, 영양통계집과 상세한 분석결과 는
국민건강영양조사 홈페이지(knhanes.cdc.go.kr)에 게시할
예정이다.
참고문헌
1. The U.S. Departments of Health and Human Services. Healthy People 2020 framework. http://www.healthypeople.gov
2. 보건복지부. 제4차 국민건강증진종합계획(2016-2020). 2016. 3. 농촌진흥청 농촌자원개발연구소. 식품성분표 제7개정판. 2006. 4. 농촌진흥청 국립농업과학원. 식품성분표 제8개정판. 2011. 5. 한국영양학회. 2005 한국인 영양섭취기준. 2005. 6. 한국영양학회. 2010 한국인 영양섭취기준 개정판. 2010.