저작자표시-비영리-동일조건변경허락 2.0 대한민국 이용자는 아래의 조건을 따르는 경우에 한하여 자유롭게 l 이 저작물을 복제, 배포, 전송, 전시, 공연 및 방송할 수 있습니다. l 이차적 저작물을 작성할 수 있습니다. 다음과 같은 조건을 따라야 합니다: l 귀하는, 이 저작물의 재이용이나 배포의 경우, 이 저작물에 적용된 이용허락조건 을 명확하게 나타내어야 합니다. l 저작권자로부터 별도의 허가를 받으면 이러한 조건들은 적용되지 않습니다. 저작권법에 따른 이용자의 권리는 위의 내용에 의하여 영향을 받지 않습니다. 이것은 이용허락규약(Legal Code)을 이해하기 쉽게 요약한 것입니다. Disclaimer 저작자표시. 귀하는 원저작자를 표시하여야 합니다. 비영리. 귀하는 이 저작물을 영리 목적으로 이용할 수 없습니다. 동일조건변경허락. 귀하가 이 저작물을 개작, 변형 또는 가공했을 경우 에는, 이 저작물과 동일한 이용허락조건하에서만 배포할 수 있습니다.
Doctoral Thesis in Medical Sciences
A study for the socio-environmental factors
affecting the severity of suicide injuries
Ajou University Graduate School
Department of Medical Sciences Major
A study for the socio-environmental factors
affecting the severity of suicide injuries
Joon Pil Cho, Advisor
I submit this thesis as the
Doctoral thesis in Medical Sciences.
August, 2019
Ajou University Graduate School
Department of Medical Sciences Major
The Doctoral thesis of AJung Kim in Medical Sciences
is hereby approved.
Ajou University Graduate School
July 5, 2019
감사의 글
석사과정과 박사과정 동안 깊은 아량으로 저를 지도하여주신 조준필 교수님 정말 감사 합니다. 교수님께 지도받지 못했다면 이 연구 분야가 이렇게 흥미롭고 재미있다는 것을 경험해보지 못했을 것입니다. 교수님께서 보여주신 학문의 세계와 가르침의 깊이에 비하면 아직 많이 부족하지만 나날이 발전하는 모습으로 큰 가르침에 답하겠습니다. 논문을 작성하며 제가 놓치지 말아야 할 것을 섬세하게 지적해주신 최상천 교수님, 제 논문을 긍정적으로 보아주시며 응원해주신 민영기 교수님, 논문의 질을 더 높일 수 있도록 모자란 부분을 따끔하게 충고하여주신 윤덕용 교수님, 논문이 사회에 더 이바지할 수 있는 방향으로 나아가도록 채찍질해주신 이정아 교수님께도 감사의 말씀 올립니다. 교수님들 께서 주신 가르침을 늘 되새기며 정진하겠습니다. 저의 학문적 토대인 응급구조학을 가르쳐주시고 연구자로서 갖추어야 할 역량을 매번 따뜻하게 조언해주시는 엄동춘 교수님께도 감사의 말씀을 드립니다. 항상 쉼 없이 도전 하며 연구하는 연구자가 되겠습니다. 더불어 논문의 데이터를 결합하는 데에 큰 도움을 주신 황성진 선생님께도 감사의 마음 전합니다. 데이터를 다루는 방법에 대해 아무것도 모르던 시절부터 항상 선생님께 많이 배우고 있습니다. 늘 감사드립니다. 마지막으로 논문을 작성하며 사고의 벽에 부딪힐 때마다 냉철하게 문제점을 되짚어 주고 다시 치열하게 고민할 수 있도록 배려해준 남편과 2018년 10월 16일 이후 매일 매일을 행복하게 만들어주는 딸 지윤이에게 이 논문을 바칩니다. 두 사람이 없었더라면 이 논문은 완성되지 못했을 것입니다. 늘 고맙고 사랑합니다. 2019년 7월 5일 김 아 정 드림ABSTRACT
-A study for the socio-environmental factors affecting
the severity of suicide injuries
AJung Kim
Department of Medical Sciences Major The Graduate School, Ajou University (Supervised by Professor Joon Pil Cho)
Suicide survivors are often left with worse physical and economic conditions after their suicide attempt than before. A greater severity of suicide-related injuries is associated with worse physical and economic conditions, and suicide survivors are highly likely to re-attempt suicide out of despair regarding their situation. In addition, suicidal behavior leads to socioeconomic loss beyond personal loss. Recently, all the reported suicide-related risk factors have been suggested to have little explanatory strength - or to be incorrect. Since suicide is a phenomenon triggered by the social environment, a nation—the largest unit of the society—is responsible for managing (based on evidence) the issue of suicide. Unlike previous studies, this study aimed to identify socio-environmental factors influencing the severity of suicide-related injuries that can impact the physical and economic conditions of suicide survivors. This study also aimed to provide basic data for planning suicide-related projects at government and municipal levels.
Information on patients hospitalized after a suicide attempt was obtained from the 2014 National Hospital In-Depth Injury Survey data (published in 2015), and the ICE-ICISS values were used to analyze the severity of suicide-related injuries. Socio-environmental factors were selected among all statistical indices contained in “statistics by topic”,
“statistics by agency” and “E-local statistics” published by the National Statistical Office. The influence of these factors was identified using a complex sampling design.
The explanatory strength of the model—which included influencing factors of sex, age, the source of payment, and the mechanism of injury sustained—was 52.9%. Mining (β=-2.340, p<.05) and local emergency medical institutions (β=-0.162, p<.05) were found to increase the severity of the suicide-related injuries.
In order to reduce the severity of suicide-related injuries, it is necessary to improve local emergency medical institutions and related systems, and to continuously manage community residents’ underlying vulnerability to suicide. In particular, such efforts may be needed more at the regional level.
Table of Contents
Abstract
··· iⅠ. INTRODUCTION
··· 1A. Background and necessity of the study ··· 1
B. Objectives ··· 6
Ⅱ. MATERIALS AND METHODS
··· 7A. Study design ··· 7
B. Subjects and data collection ··· 8
1. Suicidal patient data ··· 9
(A) The Korean National Hospital Discharge In-depth Injury Survey (KNHDIIS) database ··· 9
(B) ICISS and ICE-ICISS ··· 10
2. Socio-environmental factors ··· 12
(A) Socio-environmental factors (Index of Statistics Korea) ··· 12
(B) Postal code ··· 32
C. Methods ··· 33
1. Data processing ··· 33
2. Data analysis ··· 33
Ⅲ. RESULTS
··· 36A. Characteristics of the subjects and socio-environmental factors ··· 36
B. Comparison of mean ICISS according to demographics ··· 43
C. Correlations between the ICISS and the general characteristics of the subjects and socio-environmental factors ··· 45
D. Effect of socio-environmental factors on the ICISS ··· 49
E. Effect of socio-environmental factors on the ICISS after controlling for human factors ··· 51
Ⅳ. DISCUSSION
··· 54Ⅴ. CONCLUSION
··· 65REFERENCES
··· 66Appendix
··· 741. The Korean National Hospital Discharge In-depth Injury Survey (KNHDIIS) (Korean) ··· 74
2. Socio-environmental factors put into research list (Korean) ··· 76
List of Tables
Table 1. List of the statistical indicators of the socio-environmental factors ··· 13
Table 2. List of the statistical indicators of socio-environmental factors selected for the final analysis ··· 21
Table 3. Classification of variables according to socio-environmental factors ··· 27
Table 4. General characteristics of the subjects ··· 37
Table 5. List of the socio-environmental factors (codes and category descriptions) ··· 39
Table 6. Comparison of mean ICISS according to the general characteristics of patients ··· 44
Table 7. Correlations among the ICISS, the general characteristics of patients, and socio-environmental factors ··· 47
Table 8. Effect of socio-environmental factors on the ICISS ··· 50
Table 9. Effect of socio-environmental factors on the ICISS after controlling for human factors ··· 52
Ⅰ. INTRODUCTION
A. Background and necessity of the study
The “2017 Cause of Death Statistics” released by Statistics Korea reported suicide as the leading cause of death by injury and the leading cause of all deaths among people aged 10–39 years, that is, the economically active population group (Statistics Korea, 2018). Despite the decrease in suicide mortality in two recent years (2014–2015), South Korea has shown by far the highest suicide mortality rate among the G20 countries for ten consecutive years (OECD, 2018).
Moreover, according to the “8th National Injury Statistics” recently released by the Korean Centers for Disease Control and Prevention (KCDC), the ratio of the number of deaths to the number of patients admitted to emergency room (ER) was 1.0 to 1.67, which was confirmed by the National Emergency Medical Services Network and Statistics Korea data. A related study (Kim, 2013) reported that the age-standardized ratio of mortality to hospitalization among suicidal patients is 1.0 to 1.28. In another study (Jung, 2017), the ratio of mortality to hospitalization to ER admission was reported to be 1.0 to 1.2 to 2.8, indicating the high severity of suicidal intent in contrast to the ratio of 1.0 to 54.04 to 230.55 for unintentional injuries (Kim et al., 2018).
Even in cases of failed suicide attempts, patients’ physical health and financial problems are likely to worsen than before the suicide attempt. Suicide attempts resulting in sequelae, such as disabilities, incur a socioeconomic burden higher than those resulting in death. According to a study by Lee et al. (2019), the socioeconomic burden related to suicide attempts amounted to 8.328 billion dollars in 2015, of which indirect costs accounted for 99.48% (8.285 billion dollars). Here, indirect costs refer to the total amount arising from the loss of productivity due to consequent diseases and premature death. In
particular, the highest burden was observed among those aged 20–49 years, the most economically active population group.
Moreover, in a survey on the reasons for suicide attempt conducted by the National Police Agency, the most frequent answer was psychological problems, followed by financial problems and health problems (National Police Agency, 2015). In the 2017 National Survey of Senior Citizens, the most frequent reason for suicidal intent was financial problems, followed by health problems. In particular, two or more suicide attempts accounted for 48.6% (Korea Institute for Health and Social Affairs, 2015). From this, it can be inferred that patients with severe injuries from suicide attempts will likely resort to suicide again due to pessimistic views about their aggravated financial and health-related problems.
In his work Suicide, Emile Durkheim claimed that each society has its own collective suicidal tendency and is “predisposed to contribute a definite quota of voluntary deaths.” He analyzed that a society in which the collective order dissolves due to sudden social progress or decline, leading to a state of anomie, becomes prone to the so-called “anomic suicide” and its annual suicide mortality rate is more likely to be maintained at a certain level compared to other types of suicide. He further argued that since the members of such a society experience the cumulative effect of this social phenomenon, suicide mortality rate increases with increasing age (Emile Durkheim, 2008). South Korea has been repeatedly exposed to situations that may have led to the phenomenon of “anomic suicide.” South Korea experienced rapid economic and social growth since the late 1950s and was critically afflicted by the 1997 Asian financial crisis. Moreover, it has experienced drastic social changes, unprecedented in any other country. Suicide mortality is much higher in South Korea than in other countries. Despite slight fluctuations, suicide mortality has steadily risen, maintaining a certain level (Lee and Kim, 2016). Further, suicide mortality increases with increasing age (Statistics Korea, 2018).
low explanatory power and accuracy of the risk factors identified over the past five decades as causes of suicidal thoughts or behavior. It is, therefore, high time to identify new factors, using new approaches, besides the risk factors that have been reported to date.
As suicide mortality is maintained at a constant level in South Korea as examined above, there is a need to establish not only suicide prevention programs but also intervention programs to control the factors that are likely to exacerbate suicide injury, which often leads to repeated suicide attempts. In particular, considering the effects of major social issues, customs, and tendencies on suicidal ideation, such factors need to be managed by support policies set out and implemented by the government, the largest unit of society. In the Ottawa Charter, the World Health Organization (WHO) also declared that central and local governments should assume responsibility for health issues, including suicide (WHO, 1986).
Injury, including suicide, is caused not by a single factor, but by the interactions of multiple factors. These factors also greatly affect the outcome of the injury. According to Haddon’s Matrix, such factors can be classified into human, vehicle, and environmental factors. Among these, environmental factors can be subdivided into physical, social, cultural, technological, political, economic, and organizational factors (Glenn et al., 2004). These factors exert their influence in a complex, interactive manner rather than in a parallel, summative way. For example, Diderichsen and Halqvist (1998) reported that social and political environments could continue to affect an individual’s economic status and exposure to a specific risk, and even the incidence and outcome of an injury. Marmot and Willkinson reported that the socioeconomic environment is directly associated with physical environmental factors and the human brain, and thus influences development in early childhood, which has long-term health implications (Marmot, M., & Wilkinson, R. G. (1999). Social detenninants of health. Oxford University Press, as cited in Kim et al. (2013)), Developing Health Inequalities Indicators and Monitoring the Status of Health Inequalities in Korea. Korea Institute for Health and Social Affairs).
Of these environmental factors, those managed by the central and municipal/provincial governments are published as “statistical indicators.” A number of studies have recently been conducted using such statistical indicators. A flagship case is the safety index published by the National Disaster Management Research Institute established under the Ministry of Interior and Safety. This safety index is a grade assigned to injury including suicide for each region with the intent to encourage municipalities and regional governments to take political interest in injury. As regards the safety index for suicide, the number of suicide deaths is set as the hazard indicator, and the vulnerability and reduction indicators are added as factors that can influence the score. The equation for calculating the safety index is as follows:
Safety index = 100 – (Hazard indicator + Vulnerability indicator – Reduction indicator)
However, this index does not apply to failed suicide attempts, hampered by data limitation. It was stressed in a study (Shin, 2018) that vulnerability and reduction indicators are only auxiliary indicators and that the factor determinant of the grade is the number of suicide deaths; that is, the hazard indicator, but factors that can contribute to reducing the number of suicide deaths were not presented.
In most suicide-related studies that used statistical indicators as variables in addition to the safety index, socio-environmental factors impacting mortality rate were investigated (Park et al., 2003; Page et al., 2006; Park, 2009; Yoon, 2011; Huh and Choi, 2013; Kang and Lee, 2014; Choi and Park, 2014; Lee and Kim, 2016). Only one study examined the social factors affecting the severity of injury (Choi and Lee, 2013); however, this study is limited to identifying regional factors affecting the transfer to another hospital or death of high-severity patients as a result of all mechanisms of injury, and does not provide suicide-specific information.
factors affecting the severity of suicide injuries, research into this topic has not yet been conducted. In an attempt to bridge this research gap, this study aimed to clarify the socio-environmental factors affecting the severity of suicide injuries using statistical indicators published by the central and municipal/regional governments at an interactive multifactorial level.
B. Objectives
The purpose of this study was to provide basic data for setting up suicide-related intervention programs by identifying the socio-environmental factors affecting the severity of suicide injuries.
Specifically, the following objectives have been set to achieve this purpose:
First, identify the indicators that could be estimated to be the socio-environmental factors of suicide and present the study methods leading to the results obtained;
Second, identify the mean trends of human and socio-environmental factors for each severity level of suicide injuries;
Third, compare other human factors for each severity level of suicide injuries and identify their differences from the mean trend;
Fourth, identify the correlations of socio-environmental factors for each severity level of suicide injuries;
Fifth, identify socio-environmental factors affecting the severity of suicide injuries; Sixth, identify socio-environmental factors by controlling for human factors that may affect the severity of suicide injuries.
Ⅱ. MATERIALS AND METHODS
A. Study design
This is a cross-sectional, secondary data analysis study that aimed to identify the effect of socio-environmental factors on the injury severity of patients hospitalized after an interrupted suicide attempt in South Korea.
For this retrospective study, reviewed the medical records of patients who were hospitalized for attempting suicide and discharged home without being transferred to another hospital were reviewed. Among the statistical indicators published by the Statistics Korea, the socio-environmental factors deemed appropriate by the researcher were used as the independent variables. The dependent variable was the International Classification of Diseases (ICD)-10-CM-based Injury Severity Score (ICISS) converted from the Korean Standard Classification of Diseases (KCD) with which the patient was diagnosed. To ensure accuracy when determining the effect of each independent variable, gender, age, mechanism of injury, suicide motive, and source of payment were used as control variables. The control variables entered into each model were those with statistically significant differences in the general patient characteristics.
This study was deemed exempt from review by the Institutional Review Board (IRB) of Ajou University Hospital (AJIRB-SBR-EXP-19-023).
B. Subjects and data collection
The study data were prepared by interlinking four different sets of data: (i) Korean National Hospital Discharge In-depth Injury Survey (KNHDIIS) data as the suicidal patient data; (ii) Diagnosis-specific survival probabilities (DSPs) data according to the International Collaborative Effort (ICE) on Injury Statistics and ICD-10-based Injury Severity Score (ICE-ICISS); (iii) data selected by the researcher from among the statistical indicators published by the Statistics Korea as socio-environmental factors; and (iv) 2014 postal code data.
Details of these four data sets are given below.
For the purpose of this study, the medical records of 632 patients hospitalized after an interrupted suicide attempt committed with “injury intent” to inflict “intentional self-harm” as determined by the KNHDIIS were reviewed. Of the 632 cases, 72 cases were found to have missing values (four of them overlapping, with two missing-value items each): 67 cases without injury diagnosis (i.e., zero ICD-10 S- or T-code), despite the patients sustaining an injury; one case with unknown postal code; six cases with non-existent postal code; and two cases from Sejong-si, for which not all items of the socio-environmental indicators were estimated. However, because a complex sample design prescribes the inclusion of all missing-value cases, including non-responses, for analysis (KCDC, 2014), all 72 cases with missing values were used for the analysis.
1. Suicidal patient data
The study data were extracted from 632 cases of hospitalization after an interrupted suicide attempt, in which the injury intent was found to be “intentional self-harm” as per the KNHDIIS. The severity of suicide injury was estimated based on the statistically processed final ICE-ICISS DSPs.
(A) The Korean National Hospital Discharge In-depth Injury Survey (KNHDIIS) database
The 2014 KMHDIIS database published in 2017 used in this study is based on a nationwide survey conducted each year on approximately 210,000 sample patients from 170 sample hospitals in accordance with the Statistics Korea approval number 117060, which is appropriate for inter-country comparisons (KCDC, 2019). The survey is conducted by reviewing medical records, from which a comprehensive database comprising basic patient information, date of discharge, admission route, disease, treatment, and external cause of injury codes are generated each year, thus allowing the identification of time-series characteristics.
In this study, one discharge case with an additional injury patient survey form completed was considered one hospitalization case.
To obtain the KMHDIIS data for analysis, the researcher sent a formal request and the study protocol using the forms designated by the KCDC, and upon completion of the review of the submitted documents, the KCDC provided the researcher with the review report and the requested raw data.
(B) ICISS and ICE-ICISS
In conventional clinical settings, the Injury Severity Score (ISS) is primarily used to estimate the survival rate or prognosis of trauma patients. For ISS calculation, the body is divided into 6 anatomical regions and the Abbreviated Injury Scale (AIS) is used to rate each region’s injury severity, followed by selecting the three highest AIS scores. The ISS score is the sum of the squares of these highest AIS scores for the three most severely injured body regions (Baker et al., 1974). Other methods for measuring injury severity have been developed (e.g., the Severity Characterization of Trauma) to improve the ISS; however, these methods require human and material resources and time for calculation, and there are additional limitations arising from their complexity and physiological information requirements. To address these problems, Osler et al. (1996) proposed the ICISS, a new concept as an alternative to the ISS.
The ICISS is the product of all Survival Risk Ratios (SRRs) for the S- and T-codes, that is, the diagnostic codes for injuries of a given patient using the International Statistical Classification of Diseases and Related Health Problems. This measures the overall likelihood of death by injury and expresses the severity level by presenting the likelihood of death on a scale ranging from 0 (unsurvivable) to 1 (high likelihood of survival). It can recognize up to 10 diagnostic codes and use them for calculation as defined by the equation below:
ICISS=SRRinj(1)×SRRinj(2)×…×SRRinj(last)
(SRRinj(last);SRRforthepatient’seachinjury)
The ICISS used in South Korea has some limitations. Lee and Sim (2009) reported that severity may vary due to disease code input errors committed by divisions other than the main division, and that such input errors occur far more frequently in polytraumatic
inpatients. Jang et al. (2003) reported various limitations, such as the need to differentiate among various age groups when calculating the ICISS score, inconsistency in early-stage data collection for calculating the SRRs, non-consideration of the patient’s pre-injury health status, and non-consideration of the disease severity. However, the ICISS allows identifying the injury severity or survival rate of a patient using the ICD code alone, and it is convenient to use (Osler et al., 1996). Besides, it is gaining recognition as an indicator more effective than the Trauma Injury Severity Score or ISS (Meredith et al., 2003; Hannan et al., 2005; Wong et al., 2008). Given the current clinical trend of continuous generation and management of ICISS data of trauma patients in all trauma centers by a policy decision, it is deemed best-suited for continuous monitoring of the present study findings.
In this study, the DSPs of the ICE-ICISS were used because it is impossible to obtain the ICISS SRRs in South Korea. The equation for the ICISS is also used for DSPs calculation. Moreover, since the final DSPs are measured using ICISS scores pooled from many countries, reliable inter-country comparisons of injury severity measurement is possible, which can also be used when DSPs for individual countries have not yet been prepared (Gedeborg et al., 2014).
Given that South Korea uses the KCD system, the researcher tested twice whether the subcategories of the ICD-10 and the KCD-7 currently used in South Korea are identical and verified their equivalence.
In this study, the DSPs of the ICE-ICISS were assigned to all S- and T-codes, which represent the external cause of an injury, among a total of 21 diagnostic categories comprising one main code and 20 sub-codes obtained from the KNHDIIS, and the final score was calculated by multiplying the DSPs of up to 10 S- and T-codes. Among these results, one code with the highest DSP value in a dataset, to which 11 codes were assigned, was discarded.
2. Socio-environmental factors
(A) Socio-environmental factors (Index of Statistics Korea)
Based on a study by Franklin et al. (2017), the present study aimed to identify new risk factors by collecting additional socio-environmental indicators that may have an effect on suicidal thoughts and behavior in addition to the factors identified to date.
The researcher retrieved the list of all socio-environmental indicators contained in “Statistics by Theme,” “Statistics by Agency,” and “e-Regional Statistics” published by Statistics Korea (as of April 26, 2018), and complied a total of 84 statistical indicators. As study data, those published up to May 30, 2018 were used. Each of these 84 indicators was coded as “A” or “B” depending on whether it was assumed to have an effect before or after the suicide attempt, respectively. As a result, 65 indicators were coded as A, and 19 indicators as B.
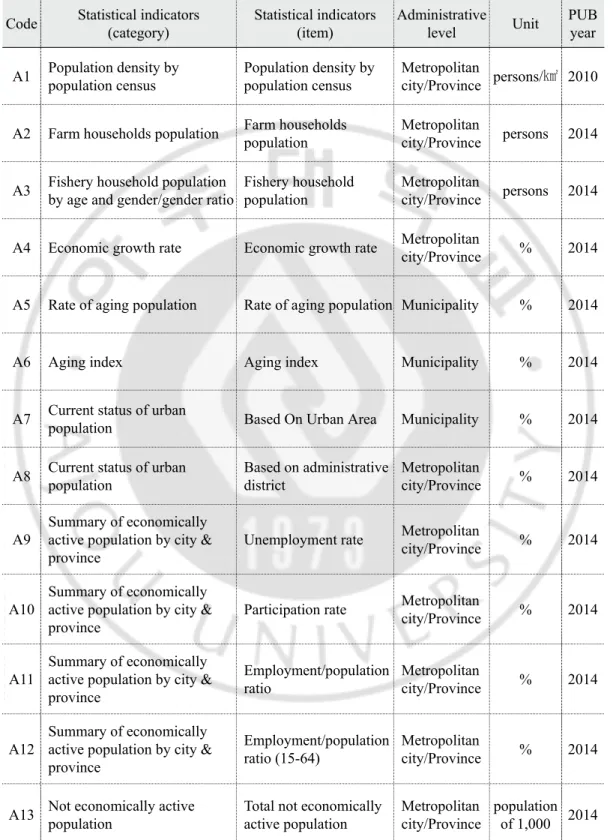
The data were arranged in accordance with the administrative divisions on which the published indicators are based: indicators published at the si-do (provincial-level divisions: metropolitan cities and provinces) and si-gun-gu levels (municipal-level divisions: cities, counties, and districts) were matched to the patients’ residential locations. Table 1 presents the list of statistical indicators.
Table 1. List of the statistical indicators of the socio-environmental factors
Code Statistical indicators(category) Statistical indicators (item) Administrative level Unit PUByear A1 Population density by population census Population density by population census Metropolitan city/Province persons/㎢ 2010
A2 Farm households population Farm households population Metropolitan city/Province persons 2014
A3 Fishery household population by age and gender/gender ratio Fishery household population Metropolitan city/Province persons 2014
A4 Economic growth rate Economic growth rate Metropolitan city/Province % 2014
A5 Rate of aging population Rate of aging population Municipality % 2014
A6 Aging index Aging index Municipality % 2014
A7 Current status of urban population Based On Urban Area Municipality % 2014
A8 Current status of urban population Based on administrative district Metropolitan city/Province % 2014
A9
Summary of economically active population by city & province
Unemployment rate Metropolitan city/Province % 2014
A10
Summary of economically active population by city & province
Participation rate Metropolitan city/Province % 2014
A11
Summary of economically active population by city & province Employment/population ratio Metropolitan city/Province % 2014 A12 Summary of economically active population by city & province
Employment/population ratio (15-64)
Metropolitan
city/Province % 2014 A13 Not economically active population Total not economically active population Metropolitan city/Province population of 1,000 2014
Code Statistical indicators(category) Statistical indicators (item) Administrative level Unit PUByear A14 Not economically active population Childcare Metropolitan city/Province population of 1,000 2014 A15 Not economically active population House-keeping Metropolitan city/Province population of 1,000 2014 A16 Not economically active population Attending school Metropolitan city/Province population of 1,000 2014 A17 Not economically active population Others Metropolitan city/Province population of 1,000 2014
A18
Number of establishments and workers by gender, region (Metropolitan city/Province), industry, and size
Number of establishments
Metropolitan
city/Province Number 2014
A19
No. of Establishments and Workers (by Gender) by Region (City, Province), Industry and Size
Total workers Municipality persons 2014
A20 Number of workers per population of 1,000 Number of workers per population of 1,000 Municipality persons 2014 A21 Number of workers by industry, size, and position Self-employed workers_count Municipality persons 2014 A22 Number of workers by industry, size, and position Unpaid family and other workers_count Municipality persons 2014 A23 Number of workers by industry, size, and position Regular employees_count Municipality persons 2014 A24 Number of workers by industry, size, and position Temporary and daily workers_count Municipality persons 2014 A25 Number of workers by industry, size, and position Agriculture, Forestry, and Fishery Municipality persons 2014 A26 Number of workers by industry, size, and position Mining Municipality persons 2014 A27 Number of workers by industry, size, and position Manufacturing Municipality persons 2014
Code Statistical indicators(category) Statistical indicators (item) Administrative level Unit PUByear A28 Number of workers by industry, size, and position Electricity, gas, steam and water supply Municipality persons 2014
A29 Number of workers by industry, size, and position
Water supply, sewage, waste management, materials recovery
Municipality persons 2014
A30 Number of workers by industry, size, and position Construction Municipality persons 2014 A31 Number of workers by industry, size, and position Wholesale and Retail trade Municipality persons 2014 A32 Number of workers by industry, size, and position Transportation and storage Municipality persons 2014 A33 Number of workers by industry, size, and position Accommodation and Food Service Activities Municipality persons 2014
A34 Number of workers by industry, size, and position
Publishing, Film, Broadcasting & Communication, Information Service business Municipality persons 2014
A35 Number of workers by industry, size, and position Financial and insurance activities Municipality persons 2014 A36 Number of workers by industry, size, and position Real estate and leasing business Municipality persons 2014 A37 Number of workers by industry, size, and position Professional, scientific, nd technical activities Municipality persons 2014
A38 Number of workers by industry, size, and position
Business Facilities Management and Business Support Services
Municipality persons 2014
A39 Number of workers by industry, size, and position Education Services Municipality persons 2014 A40 Number of workers by industry, size, and position Human Health and Social Work Activities Municipality persons 2014
A41 Number of workers by industry, size, and position
Art, sports and recreation related services
Metropolitan
Code Statistical indicators(category) Statistical indicators (item) Administrative level Unit PUByear
A42 Number of workers by industry, size, and position
Membership
organizations, repair and Other Personal Services
Metropolitan
city/Province persons 2014
A43
Non-regular workers by gender / Metropolitan city & province
Total Non-regular workers / Metropolitan city & province
Metropolitan city/Province
population of 1,000 2014 A44 Farm household debt (9 provinces) Farm household debt (9 provinces) Metropolitan city/Province 1,000won 2014
A45
Social insurance enrollment rate by Metropolitan city/Province
Wage workers Metropolitan city/Province population of 1,000 2014
A46
Social insurance enrollment rate by Metropolitan city/Province
National pension Metropolitan city/Province % 2014
A47
Social insurance enrollment rate by Metropolitan city/Province
Health insurance Municipality % 2014
A48
Social insurance enrollment rate by Metropolitan city/Province
Employment insurance Metropolitan city/Province % 2014
A49 Number of recipients for basic livelihood security Number of recipients for basic livelihood security Metropolitan city/Province persons 2014
A50 Percentage of workers in health and social services
Percentage of workers in health and social services
Metropolitan
city/Province % 2014
A51 Share of social welfare budget in general accounting
Share of social welfare budget in general accounting
Municipality % 2014
A52 Current status of social welfare public workers
Total number of dedicated social welfare public workers
Municipality persons 2014
A53 Current status of social welfare public workers
Current
numbers_dedicated social welfare public workers
Metropolitan
Code Statistical indicators(category) Statistical indicators (item) Administrative level Unit PUByear
A54 Current status of social welfare public workers
Occupancy rate of dedicated social welfare public workers
Metropolitan
city/Province % 2014
A55
Number of social welfare facilities per population of 100,000
Number of social welfare facilities per population of 100,000
Metropolitan
city/Province Number 2014
A56
Number of elderly welfare and leisure facilities per population of 1,000 elderly
Number of elderly welfare and leisure facilities per population of 1,000 elderly
Metropolitan
city/Province Number 2014
A57
Population aged over 65 years covered by medical insurance by Metropolitan city/Province
Population aged over 65 years covered by medical insurance by Metropolitan city/Province Metropolitan city/Province persons 2014
A58 Local safety rating status suicide Metropolitan city/Province rating 2014 A59 Consumer price change rate Consumer price change rate Metropolitan city/Province % 2014 A60 CPI for Living Necessaries (2015=100 Gross index Municipality % 2014 A61 CPI for Living Necessaries (2015=100 Consumer price index for living necessities Metropolitan city/Province % 2014
A62 CPI for Living Necessaries (2015=100
Consumer Price Index for living necessities, including housing rent
Metropolitan
city/Province % 2014
A63
Rate of Local Tax Collection by Metropolitan Metropolitan city/Province
Amount of Levy Metropolitan city/Province 1,000won 2014
A64 Financial independence ratio Financial independence ratio Metropolitan city/Province % 2014 A65 Financial self-sufficiency ratio Financial self-sufficiency ratio Metropolitan city/Province % 2014 B1 Fire safety education completion rate Fire safety education completion rate Metropolitan city/Province % 2014
Code Statistical indicators(category) Statistical indicators (item) Administrative level Unit PUByear B2 119 emergency medical services (vehicle, crew) 119 ambulances Metropolitan city/Province Number 2014
B3 119 emergency medical services (vehicle, crew) 119 paramedics Metropolitan city/Province persons 2014
B3.1 119 emergency medical services (vehicle, crew) Certified paramedic specialist Metropolitan city/Province persons 2014
B4 119 emergency medical services (vehicle, crew) Percent of certified specialists Metropolitan city/Province % 2014
B5 Helicopter operation and rescue crew Number of helicopter equipment owned Metropolitan city/Province Number 2014
B6
Number of ambulances and emergency medical technicians deployed
Ambulance Metropolitan city/Province Number 2014
B7
Number of ambulances and emergency medical technicians deployed
Special ambulance Metropolitan city/Province Number 2014
B8
Number of ambulances and emergency medical technicians deployed
Number of Manpower Metropolitan city/Province persons 2014
B9
Number of ambulances and emergency medical technicians deployed
emergency medical technician (1 class)
Metropolitan
city/Province persons 2014
B10 Number of residents covered per one 119 safety centers
Number of residents covered per one 119 safety centers
Metropolitan
city/Province persons 2014
B11
Number of residents covered per one rescue/emergency crew
Number of residents covered per one rescue/emergency crew
Metropolitan
city/Province persons 2014
B12
Number of emergency medical facilities operated by
emergency medical institutions and other institutions
Total number of emergency medical institutions
Metropolitan
Code Statistical indicators(category) Statistical indicators (item) Administrative level Unit PUByear
B13
Number of emergency medical facilities operated by
emergency medical institutions and other institutions
Regional emergency
medical center Municipality Number 2014
B14
Number of emergency medical facilities operated by
emergency medical institutions and other institutions
Specialized emergency medical center
Metropolitan
city/Province Number 2014
B15
Number of emergency medical facilities operated by
emergency medical institutions and other institutions
Local emergency medical center
Metropolitan
city/Province Number 2014
B16
Number of emergency medical facilities operated by
emergency medical institutions and other institutions
Local emergency medical institution
Metropolitan
city/Province Number 2014
B17
Number of emergency medical facilities operated by
emergency medical institutions and other institutions
Institutions other than emergency medical institutions operating an emergency room Metropolitan city/Province Number 2014 B18
Number of emergency medical specialists per population of 100,000
Number of emergency medical specialists per population of 100,000
Metropolitan
city/Province persons 2014
B19
Number of physicians working in medical institutions per population of 1,000 Number of physicians working in medical institutions per population of 1,000 Municipality persons 2014
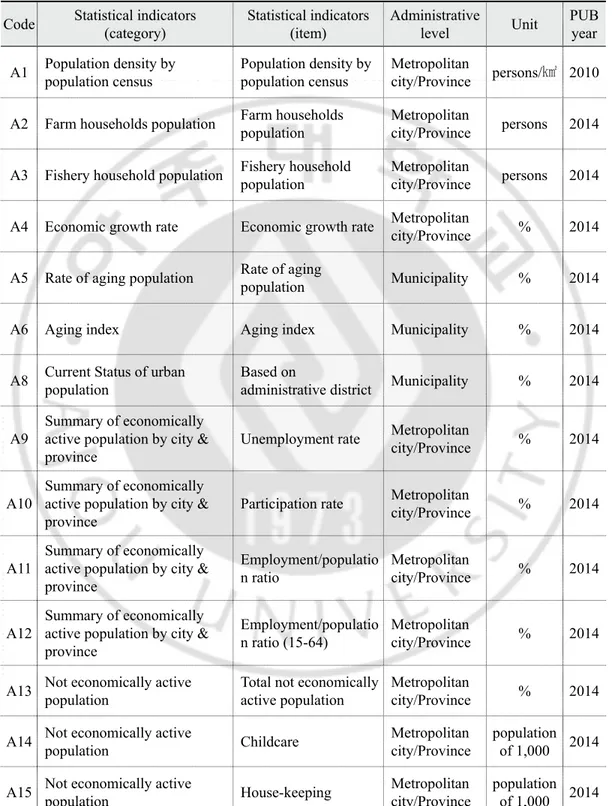
All items of the statistical indicators presented in Table 1 were checked against the commentaries and annotations released by Statistics Korea; items with overlapping or missing information in any of the regions, except for Sejong Special Autonomous City, were excluded from the analysis. Table 2 presents the statistical indicators after eliminating such items. Table 3 presents the variables classified according to the socio-environmental factors associated with the statistical indicators selected for the final analysis.
Table 2. List of the statistical indicators of socio-environmental factors selected for the final analysis
Code Statistical indicators(category) Statistical indicators (item) Administrative level Unit PUByear A1 Population density by population census Population density by population census Metropolitan city/Province persons/㎢ 2010 A2 Farm households population Farm households population Metropolitan city/Province persons 2014 A3 Fishery household population Fishery household population Metropolitan city/Province persons 2014 A4 Economic growth rate Economic growth rate Metropolitan city/Province % 2014 A5 Rate of aging population Rate of aging population Municipality % 2014 A6 Aging index Aging index Municipality % 2014 A8 Current Status of urban population Based on administrative district Municipality % 2014
A9
Summary of economically active population by city & province
Unemployment rate Metropolitan city/Province % 2014
A10
Summary of economically active population by city & province
Participation rate Metropolitan city/Province % 2014
A11
Summary of economically active population by city & province Employment/populatio n ratio Metropolitan city/Province % 2014 A12 Summary of economically active population by city & province
Employment/populatio n ratio (15-64)
Metropolitan
city/Province % 2014 A13 Not economically active population Total not economically active population Metropolitan city/Province % 2014 A14 Not economically active population Childcare Metropolitan city/Province population of 1,000 2014 A15 Not economically active population House-keeping Metropolitan city/Province population of 1,000 2014
Code Statistical indicators(category) Statistical indicators (item) Administrative level Unit PUByear A16 Not economically active population Attending school Metropolitan city/Province population of 1,000 2014 A17 Not economically active population Others Metropolitan city/Province population of 1,000 2014
A18
Number of Establishments and Workers (by Gender) by Region (City, Province), Industry and Size
Number of establishments Metropolitan city/Province population of 1,000 2014 A20 Number of workers per population of 1,000 Number of workers per population of 1,000 Metropolitan city/Province Number 2014 A21 Number of workers by industry, size, and position Self-employed workers_count Municipality persons 2014 A22 Number of workers by industry, size, and position Unpaid family and other workers_count Municipality persons 2014 A23 Number of workers by industry, size, and position Regular employees_count Municipality persons 2014 A24 Number of workers by industry, size, and position Temporary and daily workers_count Municipality persons 2014 A25 Number of workers by industry, size, and position Agriculture, Forestry, and Fishery Municipality persons 2014 A26 Number of workers by industry, size, and position Mining Municipality persons 2014 A27 Number of workers by industry, size, and position Manufacturing Municipality persons 2014 A28 Number of workers by industry, size, and position Electricity, gas, steam and water supply Municipality persons 2014
A29 Number of workers by industry, size, and position
Water supply, sewage, waste management, materials recovery
Municipality persons 2014 A30 Number of workers by industry, size, and position Construction Municipality persons 2014 A31 Number of workers by industry, size, and position Wholesale and Retail trade Municipality persons 2014 A32 Number of workers by industry, size, and position Transportation and storage Municipality persons 2014
Code Statistical indicators(category) Statistical indicators (item) Administrative level Unit PUByear A33 Number of workers by industry, size, and position Accommodation and Food Service Activities Municipality persons 2014
A34 Number of workers by industry, size, and position
Publishing, Film, Broadcasting & Communication, Information Service business Municipality persons 2014
A35 Number of workers by industry, size, and position Financial and insurance activities Municipality persons 2014 A36 Number of workers by industry, size, and position Real estate and leasing business Municipality persons 2014 A37 Number of workers by industry, size, and position Professional, scientific, and technical activities Municipality persons 2014
A38 Number of workers by industry, size, and position
Business Facilities Management and Business Support Services
Municipality persons 2014
A39 Number of workers by industry, size, and position Education Services Municipality persons 2014 A40 Number of workers by industry, size, and position Human Health and Social Work Activities Municipality persons 2014 A41 Number of workers by industry, size, and position
Art, sports and recreation related services
Municipality persons 2014
A42 Number of workers by industry, size, and position
Membership organizations, repair and Other Personal Services
Municipality persons 2014
A43
Non-regular workers by gender / Metropolitan city & province
Total Non-regular workers / Metropolitan city & province
Metropolitan
city/Province persons 2014
A45
Social insurance enrollment rate by Metropolitan city/Province
Wage workers Metropolitan city/Province persons 2014
A46
Social insurance enrollment rate by Metropolitan city/Province
Code Statistical indicators(category) Statistical indicators (item) Administrative level Unit PUByear A47
Social insurance enrollment rate by Metropolitan city/Province
Health insurance Metropolitan city/Province 1,000won 2014
A48
Social insurance enrollment rate by Metropolitan city/Province
Employment insurance Metropolitan city/Province population of 1,000 2014
A49 Number of recipients for basic livelihood security
Number of recipients for basic livelihood security
Metropolitan
city/Province % 2014
A51 Share of social welfare budget in general accounting
Share of social welfare budget in general accounting
Municipality % 2014
A52 Current status of social welfare public workers
Total number of dedicated social welfare public workers
Metropolitan
city/Province % 2014
A53 Current status of social welfare public workers
Current
numbers_dedicated social welfare public workers
Metropolitan
city/Province persons 2014
A54 Current status of social welfare public workers
Occupancy rate of dedicated social welfare public workers
Metropolitan
city/Province % 2014
A55
Number of social welfare facilities per population of 100,000
Number of social welfare facilities per population of 100,000
Municipality % 2014
A56
Number of elderly welfare and leisure facilities per population of 1,000 elderly
Number of elderly welfare and leisure facilities per population of 1,000 elderly
Municipality persons 2014
A57
Population aged over 65 years covered by medical insurance by Metropolitan city/Province
Population aged over 65 years covered by medical insurance by Metropolitan city/Province Metropolitan city/Province persons 2014
A58 Local safety rating status Suicide Metropolitan city/Province % 2014 A59 Consumer price change rate Consumer price change rate Metropolitan city/Province Number 2014
Code Statistical indicators(category) Statistical indicators (item) Administrative level Unit PUByear A60 CPI for living necessaries (2015=100 Gross index Metropolitan city/Province Number 2014 A61 CPI for living necessaries (2015=100 Consumer price index for living necessities Metropolitan city/Province persons 2014
A62 CPI for living necessaries (2015=100
Consumer price index for living necessities, including housing rent
Metropolitan
city/Province rating 2014
A63
Rate of local tax collection by metropolitan Metropolitan city/Province
Amount of levy Metropolitan city/Province % 2014
B1 Fire safety education completion rate Fire safety education completion rate Municipality % 2014 B2 119 emergency medical services (vehicle, crew) 119 ambulances Metropolitan city/Province % 2014 B3 119 emergency medical services (vehicle, crew) 119 Paramedics Metropolitan city/Province % 2014 B3.1 119 emergency medical services (vehicle, crew) Certified paramedic specialist Metropolitan city/Province 1,000won 2014 B4 119 emergency medical services (vehicle, crew) Percent of certified specialists Metropolitan city/Province % 2014 B5 Helicopter operation and rescue crew Number of helicopter equipment owned Metropolitan city/Province % 2014
B6
Number of ambulances and emergency medical technicians deployed
Ambulance Metropolitan city/Province % 2014
B7
Number of ambulances and emergency medical technicians deployed
Special ambulance Metropolitan city/Province Number 2014
B8
Number of ambulances and emergency medical technicians deployed
Number of Manpower Metropolitan city/Province persons 2014
B9
Number of ambulances and emergency medical technicians deployed
Emergency medical technician (1 class)
Metropolitan
Code Statistical indicators(category) Statistical indicators (item) Administrative level Unit PUByear
B10 Number of residents covered per one 119 safety centers
Number of residents covered per one 119 safety centers
Metropolitan
city/Province % 2014
B11
Number of residents covered per one rescue/emergency crew
Number of residents covered per one rescue/emergency crew
Metropolitan
city/Province Number 2014
B12
Number of emergency medical facilities operated by
emergency medical institutions and other institutions
Total number of emergency medical institutions Metropolitan city/Province Number 2014 B13
Number of emergency medical facilities operated by
emergency medical institutions and other institutions
Regional emergency medical center
Metropolitan
city/Province Number 2014
B14
Number of emergency medical facilities operated by
emergency medical institutions and other institutions
Specialized emergency medical center
Metropolitan
city/Province persons 2014
B15
Number of emergency medical facilities operated by
emergency medical institutions and other institutions
Local emergency medical center
Metropolitan
city/Province persons 2014
B16
Number of emergency medical facilities operated by
emergency medical institutions and other institutions
Local emergency medical institution
Metropolitan
city/Province persons 2014
B17
Number of emergency medical facilities operated by
emergency medical institutions and other institutions
Institutions other than emergency medical institutions operating an emergency room Metropolitan city/Province persons 2014 B18
Number of emergency medical specialists per population of 100,000
Number of emergency medical specialists per population of 100,000
Metropolitan
city/Province Number 2014
B19
Number of physicians working in medical institutions per population of 1,000 Number of physicians working in medical institutions per population of 1,000 Municipality Number 2014
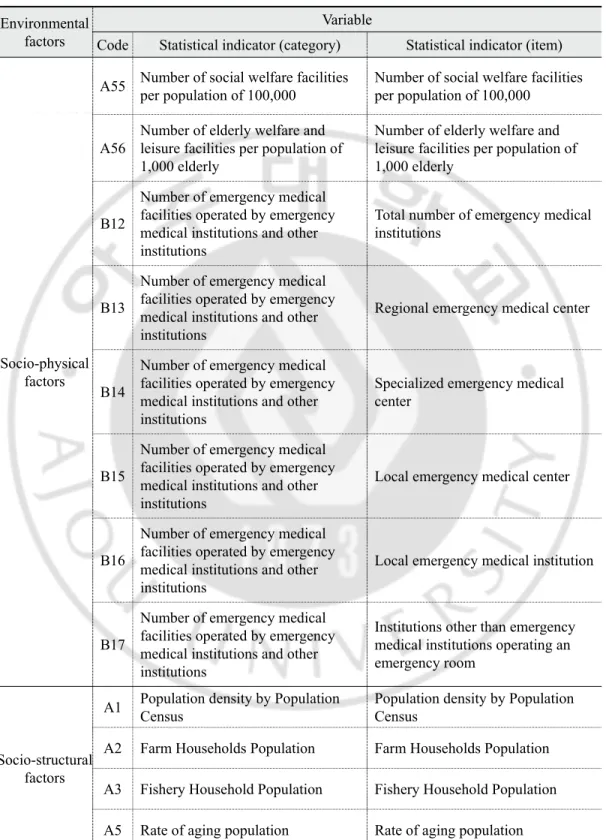
Table 3. Classification of variables according to socio-environmental factors
Environmental factors
Variable
Code Statistical indicator (category) Statistical indicator (item)
Socio-physical factors
A55 Number of social welfare facilities per population of 100,000 Number of social welfare facilities per population of 100,000
A56
Number of elderly welfare and leisure facilities per population of 1,000 elderly
Number of elderly welfare and leisure facilities per population of 1,000 elderly
B12
Number of emergency medical facilities operated by emergency medical institutions and other institutions
Total number of emergency medical institutions
B13
Number of emergency medical facilities operated by emergency medical institutions and other institutions
Regional emergency medical center
B14
Number of emergency medical facilities operated by emergency medical institutions and other institutions
Specialized emergency medical center
B15
Number of emergency medical facilities operated by emergency medical institutions and other institutions
Local emergency medical center
B16
Number of emergency medical facilities operated by emergency medical institutions and other institutions
Local emergency medical institution
B17
Number of emergency medical facilities operated by emergency medical institutions and other institutions
Institutions other than emergency medical institutions operating an emergency room
Socio-structural factors
A1 Population density by Population Census Population density by Population Census A2 Farm Households Population Farm Households Population A3 Fishery Household Population Fishery Household Population A5 Rate of aging population Rate of aging population
Environmental factors
Variable
Code Statistical indicator (category) Statistical indicator (item)
Socio-structural factors
A6 Aging index Aging index
A8 Current Status of Urban Population Based On Administrative District A21 Number of workers by industry, size, and position Self-employed workers_count A22 Number of workers by industry, size, and position Unpaid family and other workers_count A23 Number of workers by industry, size, and position Regular employees_count
A24 Number of workers by industry, size, and position Temporary and daily workers_count A25 Number of workers by industry, size, and position Agriculture, Forestry, and Fishery A26 Number of workers by industry, size, and position Mining
A27 Number of workers by industry, size, and position Manufacturing
A28 Number of workers by industry, size, and position Electricity, gas, steam and water supply A29 Number of workers by industry, size, and position Water supply, Sewage, waste management, materials recovery A30 Number of workers by industry, size, and position Construction
A31 Number of workers by industry, size, and position Wholesale and Retail trade A32 Number of workers by industry, size, and position Transportation and storage
A33 Number of workers by industry, size, and position Accommodation and Food Service Activities A34 Number of workers by industry, size, and position
Publishing, Film, Broadcasting & Communication, Information Service business
A35 Number of workers by industry, size, and position Financial and insurance activities A36 Number of workers by industry, size, and position Real estate and leasing business
Environmental factors
Variable
Code Statistical indicator (category) Statistical indicator (item)
Socio-structural factors
A37 Number of workers by industry, size, and position Professional, scientific, and technical activities A38 Number of workers by industry, size, and position Business Facilities Management and Business Support Services A39 Number of workers by industry, size, and position Education Services
A40 Number of workers by industry, size, and position Human Health and Social Work Activities A41 Number of workers by industry, size, and position Art, sports and recreation related services A42 Number of workers by industry, size, and position Membership organizations, repair and Other Personal Services A43 Non-regular workers by gender / Metropolitan city & province Total Non-regular workers / Metropolitan city & province B18 Number of emergency medical specialists per population of 100,000) Number of emergency medical specialists per population of 100,000 B19
Number of physicians working in medical institutions per population of 1,000
Number of physicians working in medical institutions per population of 1,000
Socio-economic factors
A4 Economic growth rate Economic growth rate A9 Summary of economically active population by city & province Unemployment rate A10 Summary of economically active population by city & province Participation rate
A11 Summary of economically active population by city & province Employment/population ratio A12 Summary of economically active population by city & province Employment/population ratio (15-64) A13 Not economically active population Total not economically active population A14 Not economically active population Childcare
A15 Not economically active population House-keeping A16 Not economically active population Attending school
Environmental factors
Variable
Code Statistical indicator (category) Statistical indicator (item)
Socio-economic factors
A17 Not economically active population Others
A18
Number of Establishments and Workers (by Gender) by Region (City, Province), Industry and Size
Number of establishments
A20 Number of workers per population of 1,000 Number of workers per population of 1,000 A45 Social insurance enrollment rate by Metropolitan city/Province Wage workers
A46 Social insurance enrollment rate by Metropolitan city/Province National pension A47 Social insurance enrollment rate by Metropolitan city/Province Health insurance A48 Social insurance enrollment rate by Metropolitan city/Province Employment insurance A49 Number of recipients for basic livelihood security Number of recipients for basic livelihood security A57
Population aged over 65 years covered by medical insurance by Metropolitan city/Province
Population aged over 65 years covered by medical insurance by Metropolitan city/Province A59 Consumer price change rate Consumer price change rate A60 CPI for Living Necessaries (2015=100) Gross index
A61 CPI for Living Necessaries (2015=100) Consumer Price Index for living necessities A62 CPI for Living Necessaries (2015=100) Consumer Price Index for living necessities, including housing rent A63
Rate of Local Tax Collection by Metropolitan Metropolitan city/Province
Amount of Levy
Socio-political factors
A51 Share of social welfare budget in general accounting Share of social welfare budget in general accounting A52 Current status of social welfare public workers Total numbers_dedicated social welfare public workers
Environmental factors
Variable
Code Statistical indicator (category) Statistical indicator (item)
Socio-political factors
A53 Current status of social welfare public workers Current numbers_dedicated social welfare public workers A54 Current status of social welfare public workers Occupancy rate of dedicated social welfare public workers A58 Local safety rating status suicide
B2 119 emergency medical services (vehicle, crew) 119 ambulances B3 119 emergency medical services (vehicle, crew) 119 Paramedics
B3.1 119 emergency medical services (vehicle, crew) Certified Paramedic Specialist B4 119 emergency medical services (vehicle, crew) Percent of certified specialists B5 Helicopter operation and rescue crew Number of helicopter equipment owned
B6
Number of ambulances and emergency medical technicians deployed
Ambulance
B7
Number of ambulances and emergency medical technicians deployed
Special ambulance
B8
Number of ambulances and emergency medical technicians deployed
Number of Manpower
B9
Number of ambulances and emergency medical technicians deployed
emergency medical technician (1 class)
B10 Number of residents covered per one 119 safety centers Number of residents covered per one 119 safety centers
B11 Number of residents covered per one rescue/emergency crew Number of residents covered per one rescue/emergency crew Others B1 Fire safety education completion rate Fire safety education completion rate
(B) Postal code
Given that the postal code system in South Korea changed from 6 to 5 digits in 2014, the KNHDIIS data contained both 5- and 6-digit postal codes. Therefore, postal code data covering both digit systems were collected to match the KNHDIIS and post office data. Regional information associated with postal codes was extracted at the lowest municipal- level division unit (si-gun-gu,=Municipality), where the socio-environmental factors are interlinked with the information extracted.
C. Methods
1. Data processing
Data processing was performed using SQL Server 2014 program (Window ver.) to make the collected data amenable to data analysis in the following order:
First, suicidal patient dataset was obtained by converting the S- and T-codes recorded in the principal diagnosis and secondary diagnosis in 632 cases identified in the KNHDIIS to the ICE-ICISS DSPs values.
Second, the dataset for the socio-environmental indicators to which regional codes were assigned were interlinked with the postal code dataset to produce a dataset for the socio-environmental indicators to which postal codes were assigned.
Third, the postal code was designated as a linkage attribute to integrate the suicidal patient dataset and the socio-environmental indicator dataset to generate data for the final analysis.
2. Data analysis
Data analysis was performed using IBM SPSS Statistics 25.0 program (Window ver.). The significance level for statistical testing was set to < 0.05. Data analysis was performed as follows:
First, sample normality was verified using descriptive statistics including mean, standard deviation (SD), skewness, and kurtosis. A25 (Agriculture, Forestry, and Fishery), A26 (Mining), A28 (Electricity, gas, steam and water supply), A31 (Wholesale and Retail trade), A32 (Transportation and storage), A34 (Publishing, Film, Broadcasting & Communication, Information Service business), A35 (Financial and insurance activities), A36 (Real estate and leasing business), A37 (Professional, scientific and technical
activities), and ICISS variables were verified to exceed the thresholds for skewness < 3 and kurtosis < 10 (Kline, 2015). Accordingly, logs of variables were taken for A25 (Agriculture, Forestry, and Fishery), A26 (Mining), A28 (Electricity, gas, steam and water supply), A31 (Wholesale and Retail trade), A32 (Transportation and storage), A34 (Publishing, Film, Broadcasting & Communication, Information Service business), A35 (Financial and insurance activities), A36 (Real estate and leasing business), and A37 (Professional, scientific and technical activities), and the value of 1 per log was additionally assigned to variables with negative values, namely: A26 (Mining) and A28 (Electricity, gas, steam and water supply). After taking the 5th power of the ICISS, the resulting value was multiplied by 100 to make it amenable to checking the standardized coefficients after the regression analysis.
Second, a complex sample design was used for data analysis, using integrated weight, stratification variables, and clustering variables. In all analyses based on the complex sample design, missing user values were processed as valid values, as mentioned above, and the confidence interval was set to 95%.
Third, complex samples frequency analysis and descriptive statistics were performed on the general characteristics of the subjects and the variables of socio-environmental factors.
Fourth, a Bonferroni post-hoc test was performed after estimating the mean in the complex samples general linear model analysis so that independent samples t-test and one-way analysis of variance (ANOVA) could be performed to examine the differences in the ICISS depending on the general characteristics of the subjects. For the variable “source of payment,” the groups “free,” “industrial accident compensation insurance,” and “others” showed the unweighted frequency count of 1 and thus, were treated as missing values for the post-hoc test.
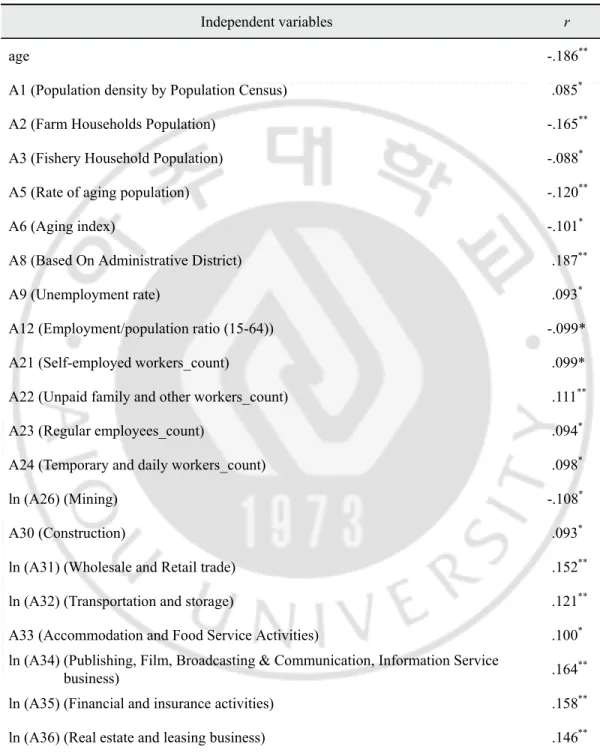
Fifth, Pearson’s correlation coefficient was used to identify the correlations among the continuous variables of the ICISS, the general characteristics of the subjects, and the
socio-environmental factors, thereby employing a bivariate correlation analysis.
Sixth, to identify similarities among the variables of the socio-environmental factors whose statistical significance was confirmed based on the correlation coefficient, a linear regression analysis was performed to examine the variance inflation factor (VIF). A reanalysis was performed on variables with VIF values higher than 5 (Ringle, 2015), thereby removing one variable after another, starting from the variable with the highest VIF value. This iterative removal process continued until all variables had VIF values lower than 10.
Seventh, for the final selection of independent variables as the input variables for the model, a simple regression analysis was performed on the variables selected in the previous process using the complex samples general linear model option.
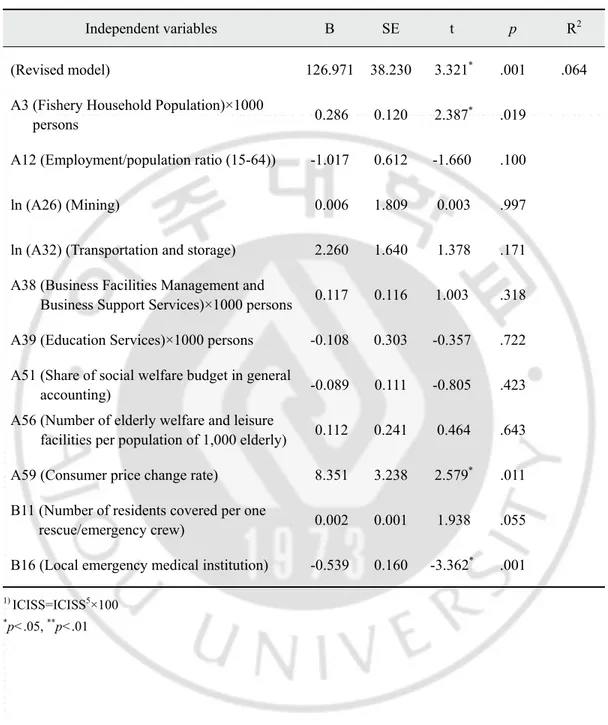
Eighth, to identify the effect of socio-environmental variables on the ICISS, a multiple regression analysis was performed, using the complex samples general linear model option, on the variables with a significance level of p<.05 as determined in the simple regression analysis performed previously.
Ⅲ. RESULTS
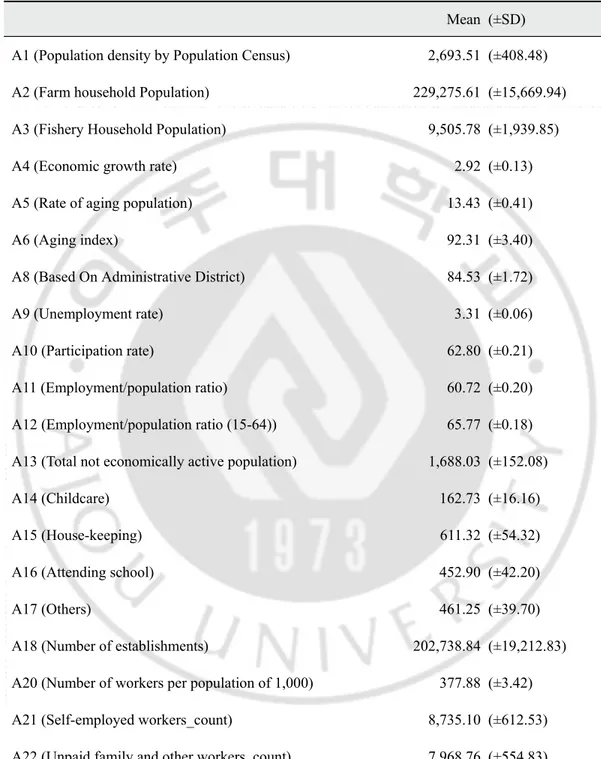
A. Characteristics of the subjects and socio-environmental factors
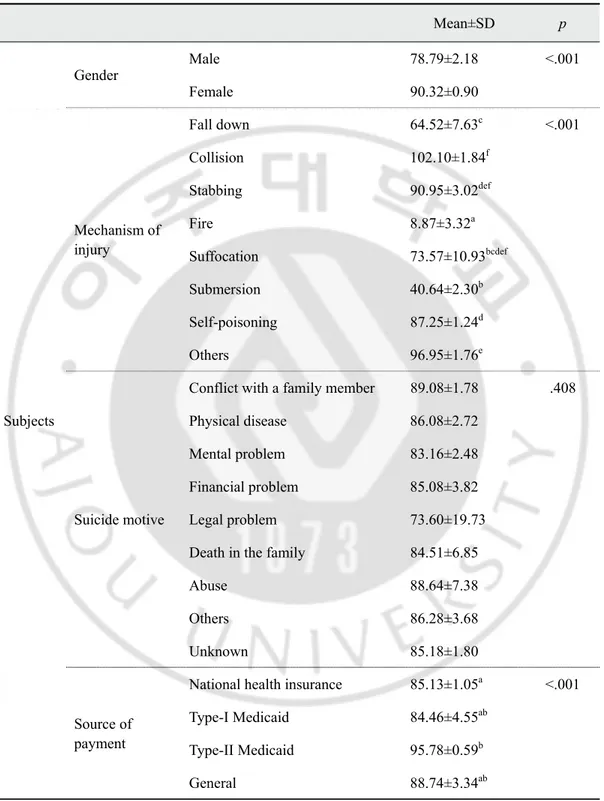
The mean original ICISS value of the subjects of this study was 0.96 (±0.01), and the mean ICISS5×100 value, that is, the statistically process value for analysis, was 85.43 (±1.15). Of 18,672,758 people, 44.8% were males and 55.2% were females, and the mean age was 48.01(±0.97) years. The mechanisms of injury (suicide methods) sorted in descending order of frequency were self-poisoning (79.3%), stabbing (10.2%), suffocation (3.7%), fall down (2.8%), fire/flame/heat (hereinafter “fire”) (1.8%), collision (1.0%), and submersion (0.6%). The suicide motives sorted in the descending order of frequency were mental health problem (17.6%), conflict with a family member (16.6%), financial problem (10.4%), physical disease (5.2%), legal problem (1.3%), death in the family (0.6%), and abuse (0.6%); others (5.2%) and unknown (42.5%). Table 4 outlines the general characteristics of the subjects. The socio-environmental factors are listed in Table 5.
Table 4. General characteristics of the subjects N (%) Mean (±SD) ICISS 0.96 (±0.01) ICISS5×100 85.43 (±1.15) Subjects Gender Male 8357.572 (44.8) Female 10315.187 (55.2) Age 48.01 (±0.97) Mechanism of injury (suicide methods) Fall down 521.559 (2.8) Collision 180.578 (1.0) Stabbing 1905.441 (10.2) Fire 334.575 (1.8) Suffocation 691.569 (3.7) Submersion 118.259 (0.6) Self-poisoning 14814.083 (79.3) Others 106.695 (0.6) Suicide motives
Conflict with a family
member 3101.318 (16.6) Physical disease 978.635 (5.2) Mental health problem 3289.821 (17.6) Financial problem 1946.302 (10.4) Legal problem 240.045 (1.3) Death in the family 106.195 (0.6) Abuse 104.918 (0.6) Others 962.990 (5.2) Unknown 7942.533 (42.5)