Comparing Risk-adjusted Hospital
Mortality for CABG and AMI Patients
HK P
ARK1, HS A
HN2, SJ Y
OON2, HY L
EE2, JM H
ONG3, SW L
EE4 ANDHJ H
ANN51Korea Health Insurance Review Agency, Seoul, Korea; 2Department of Preventive Medicine,
College of Medicine, Korea University, Seoul, Korea; 3Department of Thoracic
and Cardiovascular Surgery, College of Medicine, Chungbuk National University,
Cheongju, Korea; 4Department of Urology, Samsung Medical Centre, Sungkyunkwan
University School of Medicine, Seoul, Korea; 5Department of Anatomy,
College of Medicine, Ewha Womans University, Seoul, Korea
The objectives of this study were to compare the risk-adjusted mortality of coronary artery bypass graft (CABG) and acute myocardial infarction (AMI) patients simultaneously in six hospitals in Seoul, Korea, and to investigate the relationship between these performance measures by developing a predictive model of mortality. The medical records of 749 AMI and 564 CABG patients were reviewed. A predictive model was developed using logistic regression, including 170 variables selected
as risk factors for risk adjustment. The validity of our predictive model was demonstrated to be within an acceptable range. The results showed that one hospital with a significantly low AMI mortality rate also had a low CABG mortality rate, while another hospital with a significantly high AMI mortality rate also had a high CABG mortality rate. Our results implied that hospitals providing good-quality medical management of coronary artery disease also provided a good-quality surgical service. KEY WORDS: ACUTE MYOCARDIAL INFARCTION; CORONARY ARTERY BYPASS GRAFT;
RISK ADJUSTMENT; HOSPITAL MORTALITY; HOSPITAL QUALITY
Introduction
Comparing risk-adjusted mortality is one of the main methods used to assess the quality of a hospital’s performance. Patients receiving coronary artery bypass graft (CABG)
surgery1 – 4 and patients treated for acute
myocardial infarction (AMI)5,6 are among
the most commonly studied subjects used to assess outcomes of medical and surgical care. As previous studies have usually dealt with only one subject, either CABG or AMI, the surgical and medical performance of an individual hospital has not been evaluated
simultaneously. If a hospital provides a high-quality medical service for patients with coronary artery disease it might be reasonable to predict that the same hospital would also have a high-quality surgical service. No previous study has demonstrated a relationship between quality of surgical service and the medical management of coronary artery disease provided by hospitals, however. Furthermore, most studies have been carried out in selected Western countries and we do not know the situation in developing countries, where the incidence of coronary artery disease has been increasing.
Making adjustments for patients’ risk factors is essential when assessing patient
outcomes.7There are some risk measurement
instruments, but the detailed contents of these instruments have not been made available in the literature and they usually have to be purchased. Alternatively, it is possible to develop a mortality prediction model, which has the additional advantage of including more risk factors so that it can be tailored to suit the study aims and context.
In Korea, risk-adjusted outcome evaluation is in its infancy, as in many other developing countries. This study aimed to compare the risk-adjusted mortality of CABG and AMI patients simultaneously in several Korean hospitals and to investigate the relationship between these two performance measures, by developing a predictive model of mortality.
Patients and methods
PATIENTS AND DATA COLLECTION
Six general teaching hospitals, each with 500 – 1500 beds, located in metropolitan areas in Seoul, Korea, participated in this study. All AMI and CABG patients admitted to any of the study hospitals from 1 January to 31 December 1999 were included in the study. Two cardiologists selected 170 variables from previous studies and risk adjustment tools such as MedisGroups, Disease Staging and theComputerized Severity Index.7 Two trained
nurses retrospectively reviewed the medical records to collect the data. As we retrospect-ively collected data from medical records, we could not include more general factors such as social status, income or nutritional factors. Ethical committee approval and informed patient consent were not required for this retrospective study.
STATISTICAL ANALYSIS
By using univariate analysis employing death as a dependent variable, independent
variables that could enter the multivariate predictive model were selected based on a significance level set at 0.05. Missing values were accounted for by deploying the
Min-imum Generalized Variance method,8which
was performed using the PRINQUAL
pro-cedure (SAS®software, Version 8.2; Cary, NC,
USA).9 Interactions between independent
variables at the significance level of 0.05 were also selected. A final multiple logistic regression model was developed, using the stepwise method.
To evaluate the validity of the model, cross-validation and bootstrapping were
used.7 – 9 Thirty-fold cross-validation was
repeated five times to evaluate the over-fit of the model. The developed model was applied in 100 bootstrap samples to calculate the
c-statistic and its 95% confidence level. The
presence of over-fitting was determined through comparison with the confidence level and the c-statistic.
The Hosmer-Lemeshow statistic was also calculated to evaluate the goodness-of-fit of the model. The risk-adjusted mortality was calculated by dividing actual mortality by expected mortality, and by multiplying the total mortality of the number of subjects. The confidence level of the risk-adjusted mortality
in each hospital was also estimated.7
Results
Four AMI patients were excluded from the study because they were transferred to another hospital within 24 h of admission. A total of 749 AMI and 564 CABG patients were included in this study. The overall mortality rate was 15.0% for AMI patients and 7.1% for CABG surgery patients in six hospitals (A – F, Table 1). The mortality rate of AMI patients was lowest in hospital B and highest in hospital F, while the mortality rate of CABG patients was also lowest in hospital B, but highest in hospital E. Thirty-two and
T ABLE 1 : Mo rt al ity d at a fo r ac ute m yo ca rdi al inf ar ction (AM I) p atie nts and patie nts who unde rwe nt coronar y ar ter y by pas s gra ft (C ABG ) surger y in six Korea n h ospit als (A – F ) AM I CA BG Ho sp ita l A B C D E F T ot al A B C D E F T ot al No. of study pati ents 9 3 16 0 1 66 13 8 8 3 10 9 7 49 6 6 4 5 12 7 11 5 7 0 14 1 56 4 A vera ge age (y ear s) 64. 2 58. 4 61 .5 6 0.6 58 .1 60. 8 60. 7 5 8.8 5 7. 8 59 .8 6 0. 9 59 .4 59. 2 59 .3 Sex Mal e 67 13 4 1 11 9 4 64 6 6 53 6 5 0 2 6 10 3 8 9 4 4 96 40 8 Fe mal e 26 26 55 4 4 19 4 3 21 3 1 6 1 9 24 2 6 2 6 4 5 15 6 Nu mbe r of de at hs 1 2 1 6 2 7 2 2 12 24 11 3 2 1 1 2 5 1 1 9 4 0 Morta lity (%) 12 .9 10 .0 16 .3 15. 9 1 4. 5 22 .2 15 .0 3 2.2 9 .4 4.3 1 5.7 6.4 7 .1
TABLE 2:
Multiple logistic regression model results for patients with acute myocardial infarction in six Korean hospitals
Odds 95% Confidence
Variables b-coefficient P-value ratio interval
Intercepts –0.4897 NS – – Age (years) < 45 – – – – 45 – 55 0.2402 NS 1.271 0.476, 3.834 56 – 65 –0.7810 NS 0.458 0.081, 2.574 > 65 1.2603 0.0305 3.526 1.172, 11.726 Sex F – – – – M 0.1562 NS 1.165 0.528, 2.673 Ejection fraction –0.0196 0.0133 0.981 0.965, 0.996
Systolic blood pressure –0.0097 NS 0.990 0.98, 1.000
Congestive heart failure No – – – –
Yes 0.9958 0.0026 2.707 1.409, 5.155
Cardiac arrest No – – – –
Yes – – 6.787 2.734, 17.309
ECG ischaemic change No – – – –
Yes –2.0522 0.0025 0.128 0.029, 0.425
Arrhythmia No – – – –
Yes –0.5788 0.0469 0.560 0.316, 0.996
LAD artery involved No – – – –
Yes –0.6198 0.0236 0.538 0.312, 0.915
Verbal response within 48 h Oriented – – – –
Confused 0.5218 NS 1.685 0.616, 4.370
Inappropriate 2.6197 NS 13.732 0.785, 452.678
Incomprehensible –0.8195 NS 0.441 0.048, 3.072
None 1.7155 0.0142 5.56 1.448, 22.636
Acute neurological No – – – –
change within 48 h Yes 1.0808 0.0122 2.947 1.226, 6.705
ECG, electrocardiogram; LAD, left anterior descending; NS, not significant. 27 significant variables were selected by
univariate analysis for the AMI and CABG multiple logistic regression models, respectively. After substituting missing
values in these variables, final models that included 11 variables for AMI and seven variables for CABG were constructed (Tables 2 and 3).
The c-statistic values were 0.887 and
0.791, and the R2 values were 0.268 and
0.105 for AMI and CABG patients, respectively (Table 4). The c-statistics obtained after repeating the 30-fold cross validation five times were slightly higher than the values obtained from the models, which suggested that there was no over-fitting. The 95% confidence interval range was between 0.865, 0.914 and 0.763, 0.824 for AMI and CABG patients, respectively, suggesting the model has no over-fitting.
The Hosmer-Lemeshow statistic, which is
a goodness-of-fit index for the mortality prediction model, was 6.335 and 10.321. There was no statistically significant difference in the distribution of expected number of deaths calculated from the developed models in the deciles by predicted probability, and actual mortality increased as expected mortality increased (Table 4).
Figure 1 shows the risk-adjusted mortality for each hospital. For AMI patients, the range of risk-adjusted mortality was 11.29 – 17.84, and for CABG patients, the range was 0.2 – 12.4, which was smaller than the range TABLE 3:
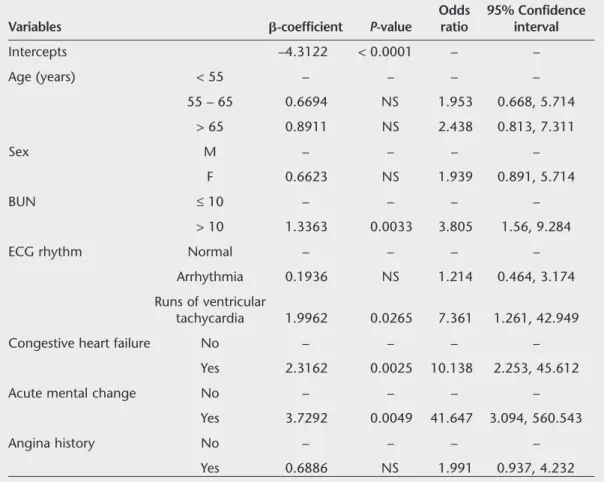
Multiple logistic regression model results for patients undergoing coronary artery bypass graft surgery in six Korean hospitals
Odds 95% Confidence
Variables b-coefficient P-value ratio interval
Intercepts –4.3122 < 0.0001 – – Age (years) < 55 – – – – 55 – 65 0.6694 NS 1.953 0.668, 5.714 > 65 0.8911 NS 2.438 0.813, 7.311 Sex M – – – – F 0.6623 NS 1.939 0.891, 5.714 BUN ≤10 – – – – > 10 1.3363 0.0033 3.805 1.56, 9.284
ECG rhythm Normal – – – –
Arrhythmia 0.1936 NS 1.214 0.464, 3.174
Runs of ventricular
tachycardia 1.9962 0.0265 7.361 1.261, 42.949
Congestive heart failure No – – – –
Yes 2.3162 0.0025 10.138 2.253, 45.612
Acute mental change No – – – –
Yes 3.7292 0.0049 41.647 3.094, 560.543
Angina history No – – – –
Yes 0.6886 NS 1.991 0.937, 4.232
T ABLE 4: The ability o f th e dev el op ed ris k-a d ju ste d mo de l to pr ed ic t in-ho sp it al d eat h in p at ie nt s w it h ac ut e m y oca rd ia l in fa rctio n (AMI) or in patients wh o u nde rwen t coron ar y ar ter y by pa ss g raf t (C AB G) surg er y in six K ore an hos pit als AM I CA BG Dec iles b y pred icted Ac tual Ex pe ct ed Ac tual Ex pe ct ed pr oba bi li ty of de ath Subjects mo rt al ity rat e m or ta lit y ra te Subjec ts mo rt ali ty rat e m ort al it y rat e 1 86 0.0 0.6 7 2 0.0 1.3 2 86 2.3 1.8 2 3 8.7 2.1 3 86 1.2 2.8 7 6 1.3 2.6 4 86 5.8 3.7 5 4 3.7 2.7 5 86 2.3 4.8 4 9 4.1 3.3 6 86 5.8 6.1 4 5 0.0 4.9 7 87 10. 3 8.6 5 2 7.7 5.1 8 86 8.1 12. 7 5 6 3.6 6.0 9 86 32. 6 28. 9 4 5 11 .1 9.2 10 86 76. 7 75. 1 7 0 28 .6 27 .4 c-statisti c (95% confidence in ter val ) 0.8 87 (0.86 5, 0 .914 ) 0.7 91 (0.76 3, 0 .824 ) Cross-val idated c-statistic 0. 89 1 0. 79 4 R 2 0. 26 8 0. 10 5 Hosmer-Lemeshow statistic 6. 33 5 10. 321 (P = NS) NS, not sign ificant .
of actual mortality. The hospitals that were statistical outliers in the adjusted mortality analysis had almost identical AMI and CABG mortality rates. Hospital B had a statistically significant low mortality rate both in AMI and CABG patients, suggesting that this hospital had a higher quality of care for both types of patients compared with the other hospitals (P < 0.01). In contrast, hospital C had a significantly high mortality rate for both AMI and CABG patients (P < 0.05), which suggested that this hospital had a poor level of care for both patient types. Mortality rates at the other hospitals were not statistically different from the overall mortality rates for all the AMI and CABG patients in the study. Hospital A was the exception, as it had a significantly high mortality rate for AMI patients, but not for CABG patients.
Discussion
The validity of the predictive model used in this study was comparable with those used in previous studies. For AMI patients, Iezzoni et
al.10and Krumholz et al.6reported c-statistic
values of 0.77 – 0.83 and R2 values of
0.17 – 0.23, and a Hosmer-Lemeshow statistic of 12.902. For CABG surgery, the c-statistic values in a previous study were 0.73 – 0.83
and the R2 values were 0.17 – 0.24.11,12The
values of these parameters for the model used in this study were similar or superior
com-pared with those of previous studies.6,10 – 13In
addition, the results from cross-validation and bootstrapping indicate that our model was not over-fitted.
This study demonstrates that the risk-adjusted mortality of AMI and CABG had a significant relationship in the six Korean hospitals in this study. For example, mortality FIGURE 1: Risk-adjusted mortalities and 95% confidence intervals for acute myocardial infarction (AMI) and coronary artery bypass graft (CABG) surgery in patients in six Korean hospitals
F E D C B A Hospital 0 0 9 10 11 12 13 14 15 16 17 18 19 20 2 4 6 8 10 12 14 (CABG) (AMI) Mortality AMI CABG
References
1 Hannan EL, Kilburn H, O’Donnell JF, Lukacik G, Shields EP: Adult open heart surgery in New York State. An analysis of risk factors and hospital mortality rate. JAMA 1990; 264: 2768 – 2774.
2 New York State Department of Health: Coronary Artery Bypass surgery in New York State 1993 – 1995. Available at: www.health.state.ny. us/nysdoh/consumer/heart/cabg935.pdf (last accessed 23 May 2005).
rates in AMI and CABG patients were clearly related in hospitals B and C. Based on the assumption that the risk-adjusted mortality could represent the quality of medical
services at a particular hospital,13 – 15 this
study supports the theory that if a hospital provides poor-quality medical management of patients with coronary artery disease, then the quality of that hospital’s surgical service might also be poor, or vice versa. Our results seem understandable when we consider the fact that medical and surgical patients in a given hospital utilize many of the same resources, such as human resources (including medical staff), diagnostic and therapeutic equipment, facilities and skills.
There were several shortcomings in this study. First, a major limitation was related to the variables collected in this study. Many factors other than clinical variables can influence the mortality of patients with coronary artery disease: behavioural factors such as nutrition and exercise; socio-economic factors such as income and occupation or place of residence; the physical environment; and community health resources can all play a role in determining risk of mortality. We did not include these general factors in our model, but we may fail to find a more com-prehensive model that can predict hospital mortality. Although we tried to include as many clinical variables as possible – variables that have been reported as significant risk factors in previous studies – this shortcoming needs to be overcome by further research.
Secondly, as some debate continues among researchers on whether differences in risk-adjusted mortality can be used to reflect
differences in quality of medical services,14
and as limited numbers of patients and hospitals are included in this study, the generalized conclusions we have made should be interpreted with caution. While some studies reported a relationship between severity-adjusted mortality and the quality of medical services provided in hospitals,
others reported no relationship.14,15 To
consider this controversy we should investigate whether an actual difference exists in the patient-care processes among the hospitals.
Our results found that the risk-adjusted hospital mortality for patients with coronary artery disease varied among six Korean hospitals. Our results also implied that hospitals providing good-quality medical management of coronary artery disease also provided a good-quality surgical service, and that one type of quality indicator can represent other types of service in the management of coronary heart disease patients. As this study had some shortcomings, further research is needed to confirm the results by including more general risk factors in our predictive model.
Conflicts of interest
No conflicts of interest were declared in relation to this article.
• Received for publication 6 April 2005 • Accepted subject to revision 18 April 2005 • Revised accepted 23 May 2005
3 Geraci JM, Johnson ML, Gordon HS, Petersen NJ, Shroyer AL, Grover FL, et al: Mortality after cardiac bypass surgery: prediction from administrative versus clinical data. Med Care 2005; 43: 149 – 158.
4 Rathore SS, Epstein AJ, Volpp KG, Krumholz HM: Hospital coronary artery bypass graft surgery volume and patient mortality, 1998 – 2000. Ann Surg 2004; 239: 110 – 117.
5 Luft HS: Variations in patterns of care and out-comes after acute myocardial infarction for Medi-care beneficiaries in fee-for-services and HMO settings. Health Serv Res 2003; 38: 1065 – 1079. 6 Krumholz HM, Chen J, Wang Y, Radford MJ, Chen YT, Marciniak TA, et al: Comparing AMI mortality among hospitals in patients 65 years of age and older: evaluating methods of risk adjustment. Circulation 1999; 99: 2986 – 2992.
7 Iezzoni LI (ed): Risk Adjustment for Measuring Healthcare Outcomes, 3rd edn. Chicago, IL: Health Administration Press, 2003.
8 Lee KL, Woodlief LH, Topol EJ, Weaver WD, Betriu A, Col J, et al: Predictors of 30-day mortality in the era of reperfusion for acute myocardial infarction. Results from an inter-national trial of 41 021 patients. Circulation 1995; 91: 1659 – 1668.
9 Kuhfeld WF: The PRINQUAL procedure. In:
SAS/Stat User’s Guide. Cary, NC: SAS Institute, Inc., 1990; pp1265 – 1323.
10 Iezzoni LI, Ash AS, Shwartz M, Daley J, Hughes JS, Mackiernan YD: Judging hospitals by severity-adjusted mortality rates: the influence of the severity-adjustment method. Am J Public Health 1996; 86: 1379 – 1387. 11 Landon B, Iezzoni LI, Ash AS, Shwartz M,
Daley J, Hughes JS, et al: Judging hospitals by severity-adjusted mortality rates: the case of CABG surgery. Inquiry 1996; 33: 155 – 166. 12 Ghali WA, Quan H, Brant R: Coronary artery
bypass grafting in Canada: national and provincial mortality trends, 1992 – 1995. CMAJ 1998; 159: 25 – 31.
13 Normand ST, Glickman ME, Sharma RG, McNeil BJ: Using admission characteristics to predict short-term mortality from myocardial infarction in elderly patients. Results from the Cooperative Cardiovascular Project. JAMA 1996; 275: 1322 – 1328.
14 Hartz AJ, Gottlieb MS, Kuhn EM, Rimm AA: The relationship between adjusted hospital mortality and the results of peer review. Health Serv Res 1993; 27: 765 – 777.
15 Dubois RW, Brook RH, Rogers WH: Adjusted hospital death rates: a potential screen for quality of medical care. Am J Public Health 1987;
77: 1162 – 1166.
Address for correspondence Dr HS Ahn
Department of Preventive Medicine, College of Medicine, Korea University, 126-1, 5-Ga, Anam-dong, Sungbuk-ku, Seoul 136-705, Korea.