Visceral fat thickness measured by ultrasonography can estimate
not only visceral obesity but also risks of cardiovascular and
metabolic diseases
1–3Soo Kyung Kim, Hae Jin Kim, Kyu Yeon Hur, Sung Hee Choi, Chul Woo Ahn, Sung Kil Lim, Kyung Rae Kim, Hyun Chul Lee, Kap Bum Huh, and Bong Soo Cha
ABSTRACT
Background: Visceral obesity is closely associated with cardiovas-cular disease and the metabolic syndrome. Estimating the amount of visceral fat is important and requires a straightforward, reliable, and practical method.
Objective: We investigated whether visceral fat thickness (VFT) measured by ultrasonography can adequately assess visceral fat ac-cumulation and predict cardiovascular or metabolic diseases. Design: Diabetic patients (240 men and 106 women) underwent ultrasonography to estimate visceral fat accumulation.
Results: The visceral adipose tissue area had the best correlation with VFT (r҃ 0.799, P 쏝 0.001). VFT correlated with HDL-cholesterol, triacylglycerol, and high-sensitivity C-reactive protein concentrations, the homeostasis model assessment for insulin resis-tance, and the intima-media thickness at the common carotid artery (r҃ Ҁ0.30, 0.39, 0.34, 0.31, and 0.33, respectively; P 쏝 0.05) in men and with triacylglycerol and high-sensitivity C-reactive protein concentrations and the homeostasis model assessment for insulin resistance (r҃ 0.33, 0.44, and 0.30, respectively; P 쏝 0.05) in women. Men in the middle and high VFT tertiles had a higher odds ratio (OR) of coronary artery disease [ORs: 4.48 (95% CI: 1.29, 5.51) and 2.04 (1.06, 3.94), respectively; P҃ 0.016], hypertriacylglycer-olemia [ORs: 2.87 (1.41, 5.86) and 1.91 (1.24, 2.95), respectively; P҃ 0.003], and the metabolic syndrome [ORs: 3.38 (1.61, 7.10) and 1.95 (1.16, 3.27), respectively; P҃ 0.003] than did those in the low tertile, after adjustment for age, waist circumference, and body mass index.
Conclusion: VFT might be a reliable index for assessing the amount of visceral fat and for identifying diabetic patients, particularly men, who are at high risk of cardiovascular disease. Am J Clin Nutr 2004;79:593–9.
KEY WORDS Abdominal obesity, cardiovascular disease, coronary artery disease, ultrasonography, visceral fat, waist circum-ference
INTRODUCTION
Obesity has induced many public health problems related to metabolic diseases, including glucose intolerance, hypertension, dyslipidemia, hyperinsulinemia, and atherosclerosis. Moreover, these complexes are known to increase the risk of cardiovascular
disease (CVD; 1). In particular, the accumulation of adipose tissue predominantly in the visceral cavity plays a major role in the development of metabolic syndrome, CVD, or both (2).
Therefore, estimating the visceral fat accumulation is impor-tant in terms of evaluating patients with a higher risk of CVD. Currently, computed tomography (CT) at the abdominal level is recognized as the standard method (3). However, exposure to ionizing radiation, high cost, and low availability prevent the wide use of CT in clinical and epidemiologic studies. Therefore, alternative, simple, noninvasive methods of assessing visceral fat accumulation are needed. Such methods would include the anthropometric indexes, such as the body mass index (BMI; in kg/m2), waist circumference, and the waist-to-hip circumference ratio (WHR; 4); dual-energy X-ray absorptiometry (5); and ul-trasonography (6 –9). Ulul-trasonography is a reliable and conve-nient way of quantifying the amount of visceral fat, and the diverse ultrasonographic values were reported to be useful (6 – 11). Nevertheless, the absence of a useful measurement with established simplicity and reliability prevents the widespread use of ultrasonography. In addition, whether the ultrasonographi-cally determined amount of visceral fat directly reflects the risk of CVD, other metabolic diseases (eg, hypertension, dyslipide-mia, and metabolic syndrome), or both remains to be proven.
To assess the usefulness of ultrasonographic measurement for visceral fat, we investigated the correlation between the values measured with CT and with ultrasonography and the correlation between several ultrasonographic values and the risk factors of CVD. This study particularly focused on whether the visceral fat thickness (VFT) measured by ultrasonography could be an al-ternative index for estimating the risk of CVD and whether it could predict the presence of coronary artery disease (CAD) or other metabolic diseases.
1From the Department of Internal Medicine (SKK, HJK, KYH, SHC,
CWA, SKL, KRK, HCL, KBH, and BSC) and Brain Korea 21 Project for Medical Science (SKK, CWA, SKL, KRK, HCL and BSC), Yonsei Univer-sity College of Medicine, Seoul, Korea.
2Supported by grant no. R13-2002-054-01001-0 (2002) from the Basic
Research Program of the Korea Science & Engineering Foundation.
3Address reprint requests to BS Cha, Department of Internal Medicine,
Yonsei University College of Medicine, 134 Shinchon-Dong, Seodaemoon-Ku, PO Box 120-749, Seoul, Korea. E-mail: bscha@yumc.yonsei.ac.kr.
Received April 14, 2003.
Accepted for publication October 13, 2003.
593
Am J Clin Nutr 2004;79:593–9. Printed in USA. © 2004 American Society for Clinical Nutrition
at YONSEI UNIVERSITY COLLEGE OF MEDICINE on June 2, 2015
ajcn.nutrition.org
SUBJECTS AND METHODS
Subjects
Three hundred forty-six diabetic patients (240 men and 106 women) who visited the Diabetes Center at the Severance Hos-pital, Yonsei University, for glycemia control were enrolled in the study. The exclusion criteria included pregnancy; endocri-nopathies other than diabetes; a history of treatment with anti-obesity drugs, thiazolidinediones, or corticosteroid; abnormal renal function as determined from the age-adjusted creatinine-clearance values; symptoms that are indicative of CAD within the previous 6 mo; abnormal electrocardiogram findings without a confirmation by angiography; and weight loss of쏜 3 kg during the past 3 mo.
All the participants underwent the standard examination and testing, which included measurement of the concentrations of fasting glucose, total cholesterol, HDL cholesterol, triacylglyc-erol, high-sensitivity C-reactive protein (hsCRP), and insulin; blood pressure, height, weight, and waist and hip circumference measurements (by the same investigator); a resting electrocar-diogram; and completion of a questionnaire on CVD and other diseases. As an indicator of insulin resistance, this study used an index for a homeostasis model assessment for insulin resistance (HOMA-IR), which was calculated as follows:
HOMA-IR ⫽ [fasting plasma glucose (mmol/L) ⫻ fasting serum insulin (U/mL)]/22.5 (1) The body fat distribution for all participants was estimated by ultrasonography, and CT scan was performed on only 75 of the subjects (50 men and 25 women). The study was approved by the Ethics Committee of Yonsei University College of Medicine, and written informed consent was obtained from each subject.
Anthropometric data
The height and weight were measured to the nearest 0.1 cm and 0.1 kg, respectively, while the subjects were wearing light cloth-ing and not wearcloth-ing shoes. The waist circumference was mea-sured at the midpoint between the lateral iliac crest and the lowest rib, and the hip circumference was measured at the maximal protrusion of the greater trochanter.
Ultrasonography was performed by using a high-resolution ultrassonographic system (SA 9900; Medison, Seoul, Korea) as described by Suzuki et al (10) and Armellini et al (11). Briefly, the subjects were examined in the supine position. All frozen images were obtained immediately after respiration to avoid the influence of the respiratory status or abdominal wall tension. The maximum thickness of the preperitoneal fat (PFTmax) and the minimum thickness of the subcutaneous fat (SFTmin) were mea-sured by longitudinal scanning with the use of a 7.5-MHz linear probe from the xiphoid process to the umbilicus along the linea alba. The preperitoneal fat thickness was defined as the thickness of the fat tissue between the liver surface and the linea alba, and the subcutaneous fat thickness was defined as the thickness of the fat tissue between the skin-fat interface and the linea alba. There-after, transverse scanning was performed to measure the maxi-mum subcutaneous fat thickness (SFTmax) by using a 7.5- MHz probe and to measure VFT by using a 3.5-MHz probe; both measures were obtained 1 cm above the umbilicus. VFT was defined as the distance between the anterior wall of the aorta and
the internal face of the rectoabdominal muscle perpendicular to the aorta. The ratio of PFTmaxto SFTminwas calculated and is referred to as the abdominal wall fat index (AFI). The ratio of VFT to SFTmaxwas calculated as the value corresponding to the CT-determined ratio of visceral fat area (VFA) to subcutaneous fat area (SFA) (VSR).
CT scanning was carried out on the same day as ultrasonog-raphy. The CT scans were performed (Tomoscan 350; Philips, Mahway, NJ) to measure the VFA and SFA at L4 –L5 and the muscle and fat areas at midthigh (the midpoint of the upper border of the patella and the greater trochanter). Adipose tissue was defined as having a density ofҀ150 to Ҁ50 Hounsfield units, and muscle tissue was defined as having a density ofҀ49 to 100 Hounsfield units (12). The VSR and the ratio of the VFA to the muscle area (VMR) were calculated.
The bilateral common carotid arteries (CCAs) were scanned by using the SA9900 system (Medison) with a 7.5-MHz linear transducer. Scanning was performed at the far wall of the middle and distal CCAs by using a lateral longitudinal projection. The intima-media thickness (IMT) at the CCA, which is defined as the distance between the media-adventitia interface and the lumen-intima interface, was measured at the point of the greatest thickness and at 1 cm upstream and 1 cm downstream of that point with the use of a Digimatic electronic caliper (Mitutoyo, Kawasaki, Japan). The mean IMT was defined as the mean of 6 measurements, and the maximum IMT was defined as the largest of 6 measurements. The same investigator performed all the ultrasonographic procedures used to estimate the fat distribution and the IMT.
Definition of terms
As detailed in the report of the Adult Treatment Panel III (13), metabolic syndrome was defined the presence of욷2 of the con-ditions hypertriacylglycerolemia, low-HDL cholesterolemia, and hypertension. Dyslipidemia was defined as hypertriacyl-glycerolemia (욷 1.7 mmol/L, or 욷 150 mg/dL), low-HDL cho-lesterolemia (쏝 1.0 mmol/L, or 쏝 40 mg/dL, in men; 쏝 1.3 mmol/L, or쏝 50 mg/dL, in women), or receipt of hypolipidemic treatment. Hypertension was defined as a systolic blood pressure of욷 130 mm Hg and a diastolic blood pressure of 욷 85 mm Hg, and the use of antihypertensive agents was also considered to indicate hypertension. In this study, abdominal obesity was not included in the component of metabolic syndrome because sub-jects with a larger waist circumference have a longer VTF, and that fact might bias the results.
Analytic methods
The serum glucose concentrations were determined by using the glucose oxidase method. The plasma insulin concentrations were measured by using a radioimmunoassay according to a double-antibody method and with a commercially available ra-dioimmunoassay kit (Linco Research Inc, St Charles, MO). The serum cholesterol and triacylglycerol concentrations were mea-sured enzymatically. The hsCRP concentration was quantified by using a Nephelometer II (Dade Behring Diagnostics, Mar-burg, Germany; 14).
Statistical analysis
Statistical analyses were performed by using SPSS software (version 10.0; SPSS Inc, Chicago) and were carried out
at YONSEI UNIVERSITY COLLEGE OF MEDICINE on June 2, 2015
ajcn.nutrition.org
rately in men and women because of the significant difference in body fat distribution between the sexes. The associations be-tween the continuous variables were determined by using Pear-son’s correlation coefficients. The intergroup comparisons were performed by using an independent-sample t test and a one-way analysis of variance followed by Scheffe’s post hoc test. The prevalence and risk relation of CAD or the other metabolic dis-eases among the groups were compared by using a chi-square test. Logistic regression, which was adjusted for age, waist cir-cumference, and BMI, was used to analyze the associations be-tween the tertiles of the VFT and the presence of CAD or other metabolic diseases. A low tertile of VFT was used as the refer-ence category [odds ratio (OR): 1.00]. Receiver operating char-acteristic (ROC) curve analyses were performed to determine the sensitivity and specificity of using VFT as a forecaster of meta-bolic syndrome. P values쏝 0.05 were considered significant.
RESULTS
Clinical characteristics of the subjects
The subjects were classified by the tertile on the basis of their VFT; the mean values are쏝 44.1 mm in men and 쏝 36 mm in women for the low tertile, 44.1–58.0 mm in men and 36.0 – 47.0 mm in women for the middle tertile, and쏜 58.0 mm in men and
쏜 47.0 mm in women for the high tertile. The patients’
charac-teristics according to VFT tertiles are shown in Table 1. No differences in terms of age, SFTmax, concentrations of fasting glucose or glycated hemoglobin (Table 1), duration of diabetes, or systolic and diastolic blood pressures (data not reported) were observed between the tertiles in the men or the women. The weight, waist circumference, and BMI increased from the low
tertile to the middle tertile and the high tertile. In the men, the fasting serum concentrations of triacylglycerol, hsCRP, and in-sulin; the ratio of serum triacylglycerol to HDL cholesterol; HOMA-IR; and the mean IMT in the high tertile group were higher than those in the low tertile group. Women in the high VFT tertile had higher fasting serum triacylglycerol and hsCRP con-centrations, higher triacylglycerol:HDL, and a lower HDL-cholesterol concentration than did those in the low tertile.
Correlations of values measured by CT and ultrasonography in 75 subjects
To test the usefulness of ultrasonography for evaluating ab-dominal adiposity, this study first compared the values obtained by ultrasonography with those obtained by CT scan in 75 subjects selected from the study population. The 75 subjects did not differ significantly from the entire population in anthropometric and biochemical characteristics (data not shown).
The anthropometric characteristics of the 75 subjects who underwent CT scanning are listed in Table 2. No differences in age, BMI, waist circumference, WHR, or the total abdominal fat area were observed between the men and the women. Neverthe-less, the men had less subcutaneous fat deposition and a higher VSR than did the women. These differences identified by CT scan were also observed in the ultrasonographic assessment.
This study investigated the correlations between values ob-tained by using CT scanning (VFA, VSR, and VMR) and those obtained by using ultrasonography (VFT, PFTmax, AFI, and VFT:SFTmax; Table 3). The VFT correlated with the VFA (r҃ 0.799, P쏝 0.001), VSR, and VMR. The VFT:SFTmaxwas well correlated with the VFA (r҃ 0.473, P 쏝 0.05), VSR, and VMR. TABLE 1
Clinical characteristics of the subjects by tertile of visceral fat thickness1
Men Women Low tertile (n҃ 78) Middle tertile (n҃ 81) High tertile (n҃ 81) P for trend Low tertile (n҃ 35) Middle tertile (n҃ 34) High tertile (n҃ 37) P for trend Age (y) 47.9앐 12.8 49.9앐 11.8 51.5 앐 11.0 NS 52.2앐 11.3 53.7앐 7.5 55.0앐 5.9 NS Weight (kg) 66.6앐 9.8 71.8앐 8.82 76.5앐 9.53,4 쏝 0.001 58.1앐 8.3 59.6앐 7.1 66.0앐 9.53 쏝 0.05 Waist (cm) 83.3앐 6.6 87.7앐 5.73 92.7앐 6.83,5 쏝 0.001 79.8앐 10.5 83.7앐 7.1 90.4앐 7.63 쏝 0.001 BMI (kg/m2) 23.2앐 2.5 24.7앐 2.62 27.0앐 3.03,5 쏝 0.001 23.3앐 3.1 24.4앐 2.2 26.8앐 3.53 쏝 0.001 SFTmax(mm) 20.8앐 7.5 20.9앐 7.0 19.5앐 7.9 NS 25.4앐 8.4 25.4앐 8.4 26.6앐 6.4 NS Glucose (mmol/L) 7.94앐 3.39 7.88앐 2.61 8.10 앐 2.50 NS 8.60앐 2.94 7.78앐 3.39 8.94앐 2.50 NS Hb A1c(%) 7.9앐 1.9 7.7앐 1.5 7.8앐 1.6 NS 7.7앐 1.5 7.5앐 1.2 8.2앐 1.7 NS
Total cholesterol (mmol/L) 4.73앐 0.83 4.71앐 0.93 4.66 앐 0.85 NS 4.55앐 0.75 4.66앐 0.80 4.86앐 0.70 쏝 0.05 HDL cholesterol (mmol/L) 1.15앐 0.18 1.11앐 0.19 1.08 앐 0.19 NS 1.31앐 0.22 1.15앐 0.20 1.11앐 0.212 쏝 0.05 Triacylglycerol (mmol/L) 3.46앐 1.50 4.96앐 1.982 5.25앐 2.113 쏝 0.05 3.10앐 1.19 4.42앐 2.172 4.86앐 2.062 쏝 0.05 Triacylglycerol:HDL cholesterol 3.32앐 1.92 5.15앐 4.262 6.13앐 4.452 쏝 0.001 2.7앐 1.8 4.7앐 4.82 4.9앐 2.52 쏝 0.05 hsCRP (mg/L) 1.50앐 1.12 1.57앐 0.96 2.1앐 1.852,4 쏝 0.05 0.71앐 1.59 0.93앐 0.60 1.52앐 1.12,4 쏝 0.05 Insulin (pmol/L) 46.6앐 32.3 50.2앐 29.4 71.8 앐 342,4 쏝 0.05 57.4앐 44.4 61.7앐 30.8 68.2앐 36.6 NS HOMA-IR 2.4앐 1.3 2.5앐 1.4 3.5앐 2.12,4 쏝 0.05 2.9앐 2.7 3.1앐 2.1 3.5앐 1.7 NS IMTmean(mm) 0.68앐 0.14 0.74앐 0.12 0.84 앐 0.20 2 쏝 0.05 0.70앐 0.21 0.69앐 0.11 0.71앐 0.10 NS IMTmax(mm) 0.88앐 0.23 0.94앐 0.20 1.06 앐 0.21 NS 0.85앐 0.29 0.89앐 0.26 0.86앐 0.10 NS
1All values are x 앐 SD. Mean values for tertiles of visceral fat thickness were 36.2 mm (95% CI: 10.9, 44.0 mm) and 31.8 mm (15.0, 36.0 mm) (low tertile),
53.3 mm (44.1, 57.9 mm) and 44.7 mm (37.1, 47.0 mm) (middle tertile), and 75.8 mm (58.5, 104.0 mm) and 63.6 mm (47.4, 98.0 mm) (high tertile) in the men and the women, respectively. SFTmax, maximum subcutaneous fat thickness; Hb A1c, glycated hemoglobin; hsCRP, high-sensitivity C-reactive protein;
HOMA-IR, homeostasis model assessment for insulin resistance; IMTmeanand IMTmax, mean and maximum intima-media thickness at the common carotid
artery, respectively.
2,3Significantly different from the low tertile (one-way ANOVA followed by Scheffe’s post hoc test):2P쏝 0.05,3P쏝 0.001. 4,5Significantly different from the middle tertile (one-way ANOVA followed by Scheffe’s post hoc test):4P쏝 0.05,5P쏝 0.001.
at YONSEI UNIVERSITY COLLEGE OF MEDICINE on June 2, 2015
ajcn.nutrition.org
In contrast, the correlation of waist circumference with VFA (r҃ 0.543, P쏝 0.05) was weaker than that with the VFT.
Coefficients of variation of the ultrasonographic values
The intraobservational reproducibility of the ultrasonographic estimations was 1.5–2.0% for the VFT, 1.8 –3.2% for the SFTmax and SFTmin, and 3.0 –5.2% for the PFTmax. The reproducibility between the 2 operators was 1.8 –2.8% for the VFT and 3.5– 8.1% for the other indexes. Therefore, the absolute value of the VFT might be a more useful marker of visceral fat deposition than might either the PFTmax, AFI, or VFT:SFTmax.
Correlations between several ultrasonographic values and clinical and laboratory data
The correlation coefficients between the ultrasonographic val-ues and the clinical data are shown in Table 4. In the men, VFT correlated with BMI; waist circumference; concentrations of se-rum HDL cholesterol (negatively), triacylglycerol, hsCRP, and insulin; triacylglycerol:HDL cholesterol; HOMA-IR; and the mean and maximum IMT. In addition, VFT correlated with BMI, waist circumference, triacylglycerol and hsCRP concentrations, triacylglycerol:HDL cholesterol, and HOMA-IR in the women. Waist circumference correlated with triacylglycerol (r҃ 0.24, P쏝 0.05), HDL-cholesterol (r ҃ Ҁ0.17, P 쏝 0.05), and insulin (r҃ 0.27, P 쏝 0.05) concentrations; triacylglycerol:HDL choles-terol (r҃ 0.24, P 쏝 0.001); HOMA-IR (r ҃ 0.27, P 쏝 0.05); and mean IMT (r҃ 0.20, P 쏝 0.05) in men. However, the correlation coefficients between waist circumference and the above risk factors were lower than those between VFT and the above risk factors.
Association between VFT and the prevalence of CAD and metabolic diseases
Next, this study compared the prevalence of CAD, hyperten-sion, dyslipidemia (hypertriacylglycerolemia, low-HDL choles-terolemia, or both), and metabolic syndrome in the men and the women according to VFT tertile (Table 5). Men in the middle and high VFT tertiles had a greater prevalence of CAD, hyper-triacylglycerolemia, low-HDL cholesterolemia, and metabolic syndrome than did those in the low tertile. In women, the prev-alence of dyslipidemia and metabolic syndrome was higher in the middle and high tertiles than in the low tertile. However, the prevalence of CAD did not differ significantly among tertiles.
The logistic regression results showing the ORs for the various metabolic diseases in the VFT tertiles are listed in Table 6. The ORs for CAD, hypertension, hypertriacylglycerolemia, low-HDL cholesterolemia, and metabolic syndrome were higher for men in the middle and high tertiles than for those in the low tertile. The ORs for dyslipidemia and metabolic syndrome were higher for women in the middle and high tertiles than for those in the low tertile. With the exception of hypertension and low-HDL cholesterolemia in the men and hypertriacylglycerolemia in the women in the high VFT tertile, these observations remained significant after adjustment for age, waist circumference, and BMI.
As shown in Figure 1, the area under the ROC curve for VFT as a predictor of the presence of metabolic syndrome was 0.764 (95% CI: 0.700, 0.827; P쏝 0.001) in men and 0.730 (95% CI: 0.614, 0.845; P҃ 0.001) in the women. A VFT of 47.6 and 35.5 mm in the men and the women, respectively, was found to be the discriminating cutoff for the metabolic syndrome (specificity of 74% and 78% and sensitivity of 71% and 69% in the men and in the women, respectively). The use of ROC analyses to predict the presence or absence of CAD, other metabolic diseases, or both showed that the area under the curves for VFT were 0.621 (95% CI: 0.527, 0.714) for CAD, 0.649 (95% CI: 0.572, 0.725) for hypertension, 0.725 (95% CI: 0.657, 0.793) for hypertriacyl-glycerolemia, and 0.583 (95% CI: 0.507, 0.659) for low-HDL cholesterolemia in the men and 0.687 (95% CI: 0.577, 0.799) for hypertriacylglycerolemia and 0.695 (95% CI: 0.544, 0.803) for low-HDL cholesterolemia in the women.
TABLE 2
Anthropometric indexes in the 75 patients who underwent computed tomography1 Men (n҃ 50) Women (n҃ 25) Age (y) 45.7앐 9.8 46.7앐 10.3 Weight (kg) 73.7앐 12.1 61.1앐 14.12 BMI (kg/m2) 25.3앐 3.8 24.1앐 3.8 Waist (cm) 88.0앐 7.8 84.2앐 11.2 WHR 0.93앐 0.04 0.93앐 0.07 Computed tomography
Total fat area (cm2) 225.1앐 66.2 258.5앐 81.7
VFA (cm2) 95.4앐 29.7 82.5앐 28.1 SFA (cm2) 129.7앐 48.7 175.9앐 66.32 VSR 0.79앐 0.28 0.51앐 0.182 Ultrasonography VFT (mm) 51.7앐 15.4 37.1앐 18.22 SFTmax(mm) 22.4앐 8.0 30.1앐 9.82 AFI 1.91앐 1.19 0.84앐 0.312 VFT:SFTmax 2.56앐 1.00 1.31앐 0.752
1All values are x 앐 SD. WHR, waist-to-hip circumference ratio; VFA,
visceral fat area; SFA, subcutaneous fat area; VSR, visceral-to-subcutaneous fat area ratio; VFT, visceral fat thickness; SFTmax, the maximum
subcuta-neous fat thickness; AFI, abdominal wall fat index (ratio of maximum pre-peritoneal fat thickness to minimum subcutaneous fat thickness).
2Significantly different from the men, P쏝 0.05 (independent-sample t
test).
TABLE 3
Pearson’s correlation coefficients between the values measured by computed tomography (CT) and by ultrasonography1
Ultrasonography CT scan VFA VSR VMR VFT 0.7992 0.3863 0.6113 PFTmax 0.3283 0.136 Ҁ0.117 AFI 0.101 0.5023 0.303 VFT:SFTmax 0.4733 0.5712 0.5842
175 patients underwent CT. VFA, visceral fat area; VSR,
visceral-to-subcutaneous fat area ratio; VMR, visceral fat-to-thigh muscle area ratio; VFT, visceral fat thickness; PFTmax, maximum preperitoneal fat thickness;
AFI, abdominal wall fat index (ratio of maximum preperitoneal fat thickness to minimum subcutaneous fat thickness); VFT:Smax, ratio of VFT to
maxi-mum subcutaneous fat thickness.
2P쏝 0.001. 3P쏝 0.05.
at YONSEI UNIVERSITY COLLEGE OF MEDICINE on June 2, 2015
ajcn.nutrition.org
DISCUSSION
Previous studies reported that ultrasonography could be used to estimate visceral adiposity (8 –10). However, no definite val-ues were established. This study showed that VFT had a better correlation with the values measured by CT than did PFTmax, AFI, or VFT:SFTmaxand that VFT might be very useful in as-sessing the amount of visceral fat accumulation. Furthermore, this study found that a high VFT was closely related to an in-creased risk of CVD and to a greater prevalence of CAD, other metabolic diseases, or both in men. Therefore, this study empha-sizes that an assessment of visceral fat amounts via ultrasonog-raphy can be used to evaluate the risk of CVD and predict the presence of various metabolic diseases.
Body fat distribution varies considerably, even among people with similar total fat amounts. It is well known that visceral obesity may be a better predictor of metabolic syndrome— including hyperinsulinemia, glucose intolerance, dyslipidemia, and CVD—and cancer than may general obesity (1, 15). In ad-dition, subjects judged by the BMI criteria to be lean may be insulin resistant if they have centrally located body fat (16).
Several methods of assessing the amount of visceral fat accu-mulation have been investigated. The simplest way is to use an anthropometric index such as BMI, waist circumference, WHR,
abdominal sagittal diameter (4), or neck circumference (17). These values provide a fast, easy, and noninvasive method of assessing regional adiposity, particularly in epidemiologic stud-ies (18, 19). However, it is possible that substantial variations in the visceral fat content may be observed among persons with a similar waist circumference or WHR value because these in-dexes are not the direct methods of quantifying the amount of fat or of discriminating between visceral and subcutaneous fat. Ac-cordingly, alternative and reliable methods are needed to over-come these pitfalls of anthropometric indexes.
Although ultrasonography is not a method normally used to quantify the amount of fat, this study suggests that it may be an alternative method of assessing visceral adiposity. Furthermore, the ORs for CAD [ORs: 4.48 (95% CI: 1.29, 5.51) and 2.04 (95% CI: 1.06, 3.94); P҃ 0.016], hypertriacylglycerolemia [ORs: 2.87 (95% CI: 1.41, 5.86) and 1.91 (95% CI: 1.24, 2.95); P҃ 0.003], and metabolic syndrome [ORs: 3.38 (95% CI: 1.61, 7.10) and 1.95 (95% CI: 1.16, 3.27); P҃ 0.003] in the men in the middle and high VFT tertiles, respectively, were significantly higher than those in the men in the low tertile, even after adjustment for age, waist circumference, and BMI. In addition, the VFT corre-lated with several risk factors for CVD, such as the fasting plasma triacylglycerol, hsCRP, and insulin concentrations; triacylglyc-TABLE 4
Pearson’s correlation coefficients between several ultrasonographic values and the clinical or laboratory data1
Men (n҃ 240) Women (n҃ 106)
VFT Pmax AFI VFT:SFTmax VFT Pmax AFI VFT:SFTmax
BMI 0.612 0.332 Ҁ0.08 0.143 0.602 0.25 Ҁ0.273 Ҁ0.05 Waist circumference 0.622 0.292 Ҁ0.06 0.203 0.562 0.18 Ҁ0.263 0.12 Total cholesterol 0.03 0.07 0.04 0.05 0.25 0.10 0.18 Ҁ0.11 HDL cholesterol Ҁ0.303 Ҁ0.15 Ҁ0.07 Ҁ0.153 Ҁ0.17 Ҁ0.20 0.11 Ҁ0.09 Triacylglycerol 0.392 Ҁ0.03 0.09 0.13 0.333 0.09 Ҁ0.07 Ҁ0.08 Triacylglycerol:HDL cholesterol 0.402 Ҁ0.09 0.05 0.14 0.313 0.05 Ҁ0.12 Ҁ0.06 hsCRP 0.342 0.14 0.14 0.02 0.442 0.22 Ҁ0.13 0.12 Fasting insulin 0.333 0.01 0.12 Ҁ0.08 0.21 0.11 Ҁ0.03 Ҁ0.10 HOMA-IR 0.312 0.10 0.07 0.10 0.303 0.11 Ҁ0.08 Ҁ0.08 IMTmean 0.33 3 0.17 0.02 0.303 0.28 0.16 0.24 0.33 IMTmax 0.24 3 0.11 0.09 0.233 0.15 0.27 0.453 0.15 1VFT, visceral fat thickness; PFT
max, the maximum preperitoneal fat thickness; AFI, abdominal wall fat index (ratio of maximum preperitoneal fat
thickness to minimum subcutaneous fat thickness); VFT:SFTmax, ratio of VFT to SFT; hsCRP, high-sensitivity C-reactive protein; HOMA-IR, homeostasis
model assessment for insulin resistance; IMTmeanand IMTmax, mean and maximum intima-media thickness at the common carotid artery, respectively.
2P쏝 0.001. 3P쏝 0.05.
TABLE 5
Prevalence of coronary artery disease (CAD) and metabolic diseases within the visceral fat thickness tertiles in the male and female subjects1
Prevalence Men Women Low tertile (n҃ 78) Middle tertile (n҃ 81) High tertile (n҃ 81) Low tertile (n҃ 35) Middle tertile (n҃ 34) High tertile (n҃ 37) CAD (%) 5.4 17.92 21.62 2.9 12.9 9.1 Hypertension (%) 50.0 65.4 79.73 64.7 67.7 60.6 Hypertriacylglycerolemia (%) 35.1 66.73 77.03 35.3 67.72 69.72 Low-HDL cholesterolemia (%) 40.5 60.32 60.82 52.9 87.12 90.93 Metabolic syndrome (%) 35.9 72.83 86.43 57.1 82.42 94.63
1The definitions of hypertension, hypertriacylglycerolemia, low-HDL cholesterolemia, and metabolic syndrome are given in the Definition of terms
subsection of Subjects and Methods. CAD confirmed by angiography.
2,3Significantly different from the low tertile (chi-square analysis):2P쏝 0.05,3P쏝 0.001.
at YONSEI UNIVERSITY COLLEGE OF MEDICINE on June 2, 2015
ajcn.nutrition.org
erol:HDL cholesterol; and HOMA-IR. These correlations with VFT were relatively stronger than were those with the waist circumference or other ultrasonographic values. Moreover, the mean and maximum IMTs at the CCA, which are a marker of early atherosclerosis, correlated with VFT (r҃ 0.33 and 0.24, respectively; P쏝 0.05) and VFT:SFTmax(r҃ 0.30 and 0.23, respectively; P쏝 0.05) in men, but did not correlate with the other anthropometric and imaging values, except for waist cir-cumference, which showed a weak correlation with the mean IMT (r҃ 0.20, P 쏝 0.05).
In addition, this study suggested that a VFT of 47.6 and 35.5 mm in the men and the women, respectively, was a cutoff for predicting the presence of CAD and various metabolic diseases. In the case of metabolic syndrome, these cutoff values for VFT were shown to have high specificity and sensitivity in both sexes. Therefore, the ultrasonographic measurement of VFT might be a
good method of predicting CAD, metabolic diseases, or both and of evaluating the risk of CVD without the limitations of the anthropometric indexes.
Although the PFTmaxmeasured by ultrasonography was pre-viously reported to correlate positively with the VFA measured by CT (10), we did not observe this correlation. This discrepancy may result from the irreproducibility of the PFTmax measure-ments or from differences in the measuring sites. The sites were not fixed because PFTmaxwas measured at the thickest point in the preperitoneal fat. Therefore, it is likely that PFTmaxhas a high degree of irreproducibility and that it may be an unadvisable measure in clinical or epidemiologic studies. In the present study, the intraobservational and interobservational CVs for VFT were lower (1.5–2.0% and 1.8 –3.0%, respectively) than those for the other ultrasonographic measurements (1.8 –5.2% and 3.5– 8.1%, respectively). In addition, VFT had a better correlation with VFA TABLE 6
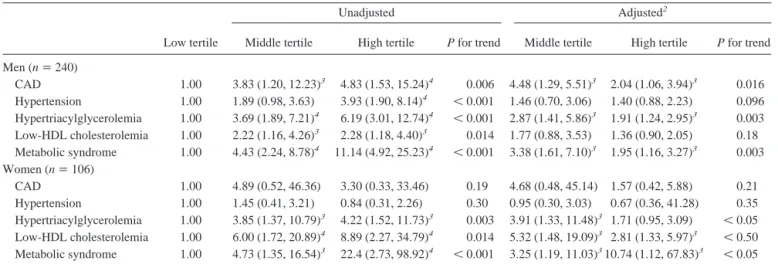
Odds ratios and 95% CIs of coronary artery disease (CAD) and the metabolic diseases by tertile of visceral fat thickness1
Low tertile
Unadjusted Adjusted2
Middle tertile High tertile P for trend Middle tertile High tertile P for trend
Men (n҃ 240) CAD 1.00 3.83 (1.20, 12.23)3 4.83 (1.53, 15.24)4 0.006 4.48 (1.29, 5.51)3 2.04 (1.06, 3.94)3 0.016 Hypertension 1.00 1.89 (0.98, 3.63) 3.93 (1.90, 8.14)4 쏝 0.001 1.46 (0.70, 3.06) 1.40 (0.88, 2.23) 0.096 Hypertriacylglycerolemia 1.00 3.69 (1.89, 7.21)4 6.19 (3.01, 12.74)4 쏝 0.001 2.87 (1.41, 5.86)3 1.91 (1.24, 2.95)3 0.003 Low-HDL cholesterolemia 1.00 2.22 (1.16, 4.26)3 2.28 (1.18, 4.40)3 0.014 1.77 (0.88, 3.53) 1.36 (0.90, 2.05) 0.18 Metabolic syndrome 1.00 4.43 (2.24, 8.78)4 11.14 (4.92, 25.23)4 쏝 0.001 3.38 (1.61, 7.10)3 1.95 (1.16, 3.27)3 0.003 Women (n҃ 106) CAD 1.00 4.89 (0.52, 46.36) 3.30 (0.33, 33.46) 0.19 4.68 (0.48, 45.14) 1.57 (0.42, 5.88) 0.21 Hypertension 1.00 1.45 (0.41, 3.21) 0.84 (0.31, 2.26) 0.30 0.95 (0.30, 3.03) 0.67 (0.36, 41.28) 0.35 Hypertriacylglycerolemia 1.00 3.85 (1.37, 10.79)3 4.22 (1.52, 11.73)3 0.003 3.91 (1.33, 11.48)3 1.71 (0.95, 3.09) 쏝 0.05 Low-HDL cholesterolemia 1.00 6.00 (1.72, 20.89)4 8.89 (2.27, 34.79)4 0.014 5.32 (1.48, 19.09)3 2.81 (1.33, 5.97)3 쏝 0.50 Metabolic syndrome 1.00 4.73 (1.35, 16.54)3 22.4 (2.73, 98.92)4 쏝 0.001 3.25 (1.19, 11.03)310.74 (1.12, 67.83)3 쏝 0.05 1The definitions of hypertension, hypertriacylglycerolemia, low-HDL cholesterolemia, and metabolic syndrome are given in the Definition of terms
subsection of Subjects and Methods. CAD confirmed by angiography.
2Adjusted for age, waist circumference, and BMI.
3,4Significantly different from the low tertile (logistic regression analysis):3P쏝 0.05,4P쏝 0.001.
FIGURE 1. Receiver operating characteristic (ROC) analyses of visceral fat thickness as a predictor of the presence or absence of the metabolic syndrome
in men (left) and women (right). The higher the area under the curve—ie, the greater the curvature away from the 50% line—the greater the predictive power. A visceral fat thickness of 47.6 and 35.5 mm in men and women, respectively, was chosen as the discriminator value to predict the presence of the metabolic syndrome (specificity of 74% and 78% and sensitivity of 71% and 69% in the men and the women, respectively). The area under the ROC curve was 0.764 in the men and 0.730 in the women.
at YONSEI UNIVERSITY COLLEGE OF MEDICINE on June 2, 2015
ajcn.nutrition.org
(r҃ 0.799, P 쏝 0.001) than with the other ultrasonographic values and with waist circumference. Therefore, VFT appears to be more reliable in estimating the amount of visceral fat accu-mulation than are the other ultrasonographic indexes.
This study had several limitations. First, it was performed only in a Korean population. Accordingly, the VFT cutoffs used for predicting the presence of CAD, metabolic diseases, or both may differ from those in other ethnic groups. Second, because all the participants were diabetic and almost every patient was being treated with oral hypoglycemic, antihypertensive, or hypolipi-demic agents, all of which are capable of affecting the serum lipid concentration and insulin sensitivity, it is possible that the inter-relations between VFT and the metabolic values related to the risks of CVD were weakened. We believe that, had healthy sub-jects been used in this study, a more conspicuous relation be-tween VFT and the CVD risk would have been found. Third, whereas VFT in the men reasonably reflected CVD risk, it did not do so in the women. The divergent significances of VFT accord-ing to the sex appear to be due to the lower prevalence of CAD in Korean women than in men. In addition, this study did not ana-lyze the role of VFT in the women after grouping them according to premenopausal and postmenopausal states. Accordingly, ad-ditional work will be needed to validate the value of using VFT in women.
In conclusion, VFT measured by ultrasonography was strongly correlated with the amount of visceral fat and the risk factors associated with CVD. A higher VFT was found to inde-pendently predict CAD and metabolic diseases in the men. Therefore, we believe that VFT is a more useful index than are the other ultrasonographic values or anthropometric indexes, not only for assessing visceral obesity but also for screening patients, particularly men, with a higher risk of CAD, metabolic diseases, or both.
We thank the study subjects for their participation in this study. SKK performed the study design, data collection, ultrasonographic mea-surements, and statistical data analysis, and he wrote the manuscript. HJK and KYH performed the data collection and were responsible for quality control of the ultrasonographic measurements. SHC and CWA supervised the data collection. SKL, KRK, and HCL provided significant expertise and reviewed the manuscript. KBH provided the conception for the study. BSC contributed to the design and conduct of this study and provided critical revision of the manuscript. None of the authors had any financial, personal, or professional conflict of interest.
REFERENCES
1. Larsson B, Svardsudd K, Welin L, Wilhelmsen L, Bjorntorp P, Tibblin G. Abdominal adipose tissue distribution, obesity, and risk of cardio-vascular disease and death: 13-year follow-up of participants in the study of men born in 1913. Br Med J 1984;288:1401– 4.
2. Fujioka S, Matsuzawa Y, Tokunaga K, Tauri S. Contribution of intra-abdominal fat accumulation to the impairment of glucose and lipid metabolism in human obesity. Metabolism 1987;36:54 –9.
3. Rossner S, Bo WJ, Hiltbrandt E, et al. Adipose tissue determinations in cadavers: a comparison between cross-sectional planimetry and com-puted tomography. Int J Obes Relat Metab Disord 1990;14:893–902. 4. Seidell JC, Cigolini M, Charzewska J, Ellsinger BM, Deslypere JP, Cruz
A. Fat distribution in European men: a comparison of anthropometric measurements in relation to cardiovascular risk factors. Int J Obes Relat Metab Disord 1992;16:17–22.
5. Bertin E, Marcus C, Ruiz JC, Eschard JP, Leutenegger M. Measurement of visceral adipose tissue by DXA combined with anthropometry in obese humans. Int J Obes Relat Metab Disord 2000;24:263–70. 6. Tornaghi G, Raiteri R, Pozzato C, et al. Anthropometric or ultrasonic
measurements in assessment of visceral fat? A comparative study. Int J Obes Relat Metab Disord 1994;18:771–5.
7. Armellini F, Zamboni M, Robbi R, et al. Total and intra-abdominal fat measurements by ultrasound and computerized tomography. Int J Obes Relat Metab Disord 1993;17:209 –14.
8. Ribeiro-Filho FF, Faria AN, Kohlmann O Jr, et al. Ultrasonography for the evaluation of visceral fat and cardiovascular risk. Hypertension 2001;38:713–7.
9. Stolk RP, Meijer R, Mali WP, Grobbee DE, van der Graaf Y. Ultrasound measurements of intraabdominal fat estimate the metabolic syndrome better than do measurements of waist circumference. Am J Clin Nutr 2003;77:857– 60.
10. Suzuki R, Watanabe S, Hirai Y, et al. Abdominal wall fat index, esti-mated by ultrasonography, for assessment of the ratio of visceral fat to subcutaneous fat in the abdomen. Am J Med 1993;95:309 –14. 11. Armellini F, Zamboni M, Rigo L, et al. Sonography detection of small
intra-abdominal fat variations. Int J Obes Relat Metab Disord 1991;15: 847–52.
12. Ashwell M, Cole TJ, Dixon AK. Obesity: new insight into the anthro-pometric classification of fat distribution shown by computed tomogra-phy. Br Med J 1985;292:1692– 4.
13. Executive summary of the third report of the National Cholesterol Ed-ucation Program (NCEP) expert panel on detection, evaluation, and treatment of high blood cholesterol in adults (Adult Treatment Panel III). JAMA 2001;285:2486 –97.
14. van der Meer IM, de Maat MP, Kiliaan AJ, van der Kuip DA, Hofman A, Witteman JC. The value of C-reactive protein in cardiovascular risk prediction: the Rotterdam Study. Arch Intern Med 2003;163:1323– 8. 15. Bjorntorp P. Portal adipose tissue as a generator of risk factors for
cardiovascular disease and diabetes. Arteriosclerosis 1990;10:493– 6. 16. Kahn SE, Prigeon RL, Schwartz RS, et al. Obesity, body fat distribution,
insulin sensitivity and islet beta-cell function as explanations for meta-bolic diversity. J Nutr 2001;131:354S– 60S.
17. Laakso M, Matilainen V, Keinanen-Kiukaanniemi S. Association of neck circumference with insulin resistance-related factors. Int J Obes Relat Metab Disord 2002;26:873–5.
18. Pouliot MC, Despres JP, Lemieux S, et al. Waist circumference and abdominal sagittal diameter; best simple anthropometric indexes of ab-dominal visceral adipose tissue accumulation and related cardiovascular risk in men and women. Am J Cardiol 1994;73:460 – 8.
19. Lemieux S, Prud’homme D, Tremblay A, Bouchard C, Despress JP. Anthropometric correlates to changes in visceral adipose tissue over 7 years in women. Int J Obes Relat Metab Disord 1996;20:618 –24.
at YONSEI UNIVERSITY COLLEGE OF MEDICINE on June 2, 2015
ajcn.nutrition.org