INTRODUCTION
According to recent data, the number of people aged ≥65 years is expected to increase to approximately 1.5 billion by the year 2050, surpassing the number of those aged <5 years by 2050.1
Older patients have a high incidence of chronic degenerative diseases, such as physiological aging processes, cerebrovascu-lar diseases, and cancer, and frequently experience unplanned hospitalization.2,3 Older patients with various comorbidities are
more often admitted to the intensive care unit (ICU) compared
Impact of Intensivist and Nursing Staff on Critically Ill
Patient Mortality: A Retrospective Analysis of the
Korean NHIS Cohort Data, 2011–2015
Su Hwan Lee
1*, Jung Hwa Hong
2*, Young Sam Kim
1, Eun Cheol Park
3, Sun Min Lee
4, and Chang Hoon Han
41Division of Pulmonary and Critical Care Medicine, Department of Internal Medicine, Severance Hospital, Yonsei University
College of Medicine, Seoul;
2Research and Analysis Team, National Health Insurance Service Ilsan Hospital, Goyang; 3Department of Preventive Medicine, Yonsei University College of Medicine, Seoul;
4Department of Internal Medicine, National Health Insurance Service Ilsan Hospital, Goyang, Korea.
Purpose: Critical care medicine continues to evolve. However, critical care cases require increasing amount of medical resources. Intensive care unit (ICU) mortality significantly impacts the overall efficiency of healthcare resources within a system of limited medical resources. This study investigated the factors related to ICU mortality using long-term nationwide cohort data in South Korea.
Materials and Methods: This retrospective cohort study used data of 14905721 patients who submitted reimbursement claims to the Korean Health Insurance Service between January 1, 2011 and December 31, 2015. A total of 1498102 patients who were ad-mitted to all ICU types, except neonatal and long-term acute care hospitals, were enrolled.
Results: Of the total 1498102 participants, 861397 (57.5%) were male and 636705 (42.5%) were female. The mean age at admission was 63.4±18.2 years; most of the subjects were aged over 60 years. During the 5-year period, in-hospital mortality rate was 12.9%. In Cox analysis, both in-hospital and 28-day mortality rates were significantly higher in male patients and those of lower socioeco-nomic status. As age increased and the number of nursing staff decreased, the mortality risk increased significantly by two or three times. The mortality risk was lower in patients admitted to an ICU of a tertiary university hospital and an ICU where intensivists worked.
Conclusion: The number of nursing staff and the presence of an intensivist in ICU were associated with the ICU mortality rate. Also, increasing the number of nursing staff and the presence of intensivist might reduce the mortality rate among ICU patients.
Key Words: Critical care, intensive care unit, mortality, nursing staff, intensivist
pISSN: 0513-5796 · eISSN: 1976-2437
Received: April 29, 2020 Revised: October 26 2020 Accepted: November 18, 2020
Corresponding author: Chang Hoon Han, MD, Department of Internal Medicine, National Health Insurance Service Ilsan Hospital, 100 lsan-ro, Ilsandong-gu, Goyang
10444, Korea.
Tel: 82-31-900-3293, Fax: 82-31-900-0343, E-mail: [email protected] *Su Hwan Lee and Jung Hwa Hong contributed equally to this work. •The authors have no potential conflicts of interest to disclose. © Copyright: Yonsei University College of Medicine 2021
This is an Open Access article distributed under the terms of the Creative Commons Attribution Non-Commercial License (https://creativecommons.org/licenses/by-nc/4.0) which permits unrestricted non-commercial use, distribution, and reproduction in any medium, provided the original work is properly cited.
Yonsei Med J 2021 Jan;62(1):50-58 https://doi.org/10.3349/ymj.2021.62.1.50
to younger patients. Also, due to the aging society, critical care medicine continued to grow compared to general hospital care between 2000 and 2005.2,4-6 However, an increasing number of
critical care cases calls for an increase in medical resources as well.7 Among the total hospital cost, daily ICU hospitalization
cost was relatively higher than that of general ward hospitaliza-tion, and increased treatment intensity required higher costs.8
In addition, patients who die in the ICU incur higher costs than those who survive.9 Therefore, the length of stay and mortality
rates at ICU significantly impact the overall healthcare resource efficiency within systems with limited medical resources.
ICU mortality is related to the patient’s conditions, such as the need for mechanical ventilation, vasopressors, and renal replacement treatment.10-12 However, recent studies have
re-ported that non-patient factors, including the presence of in-tensivists and nurse-to-patient ratio, were related to ICU mor-tality.13,14 The presence of intensivist could reduce the in-hospital
mortality risk to 0.83, and the nurse-to-patient ratio exceeding 1:1.5 was associated with a lower in-hospital mortality rate than that with a 1:2 ratio.13,15 In South Korea, there have been recent
studies on the effects of intensivists and the nurse-to-patient ratio at ICU;16,17 unfortunately, these studies included relatively
small sample sizes or did not analyze mortality-related factors. Therefore, the current study aimed to investigate the clinical characteristics of ICU patients and estimate their mortality-re-lated factors, including the presence of intensivists and nurse-to-patient ratio in South Korea, using long-term nationwide cohort data.
MATERIALS AND METHODS
Study population and dataThis study analyzed data from the Korean National Health In-surance Service (KNHIS-2019-1-164) from January 1, 2011 to December 31, 2015. All citizens of South Korea are obligated to enroll in the NHIS, a single insurer system for medical care; and their data, including insurance eligibility, medical treat-ment, and medical care institutions, are stored in the NHIS da-tabase.18
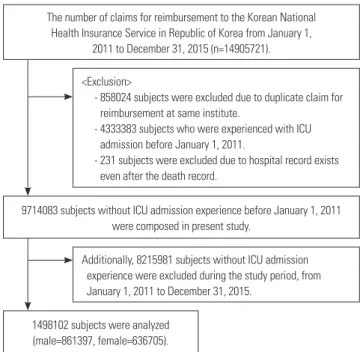
A total of 14905721 patients submitted reimbursement re-quests to the KNHIS during the study period. Subjects who submitted duplicate reimbursement claims at the same insti-tute, who were admitted to the ICU before January 1, 2011, or for whom hospital records were recorded after their death were excluded. Among them, 9714083 patients did not have an ICU admission until January 1, 2011. All 1498102 patients were ad-mitted to all ICU types except neonatal subjects, and those of long-term acute care hospitals were enrolled. ICU admission was defined as the submission of more than one reimburse-ment request with the NHIS claim code AJ100-AJ390 (Fig. 1, Supplementary Table 1, only online).
Definition and analysis variables
To investigate patient-related demographic factors, age, sex, in-come level, and chronic medical condition were examined at the time of admission. To assess chronic medical conditions, the Charlson Comorbidity Index (CCI) was calculated using the claim code for healthcare utilization at baseline.19 Income level
was categorized into five quintiles except Medicaid, with quin-tile 1 being the lowest income group. To investigate severity, the application of mechanical ventilation, renal replacement therapy, as well as vasopressor and inotropic drugs during hos-pitalization were examined. The application of mechanical ven-tilation was identified using the claim code indicating that the ventilator was used for more than 8 hours. The use of vasopres-sor and inotropic drugs (norepinephrine, epinephrine, dopa-mine, dobutadopa-mine, phenylephrine, isoproterenol, and milri-none) was identified using the anatomical therapeutic chemical classification system.20 Hospitals (excluding long-term acute
care hospitals) were classified as tertiary, general, or other, as defined by the healthcare law in South Korea. Total ICU bed-to-total number of nursing staff ratios and the presence of in-tensivists were identified by claim codes. Nursing grade was categorized into grades 1–9 based on the total ICU bed-to-to-tal nursing staff ratios. Grade 1 indicated that tobed-to-to-tal ICU beds/ total number of nursing staff was <0.5, approximately 1:2.5 when converted to the actual acting nurse-to-patient ratio. Grade 9 indicated a total ICU bed/total nursing staff ratio >2 (Supple-mentary Table 2, only online). The presence of intensivists reg-ulation in South Korea was at least one daytime worker per 30 ICU beds. In-hospital mortality and 28-day mortality rates were examined as final outcomes, and related variables were analyzed.
Fig. 1. Flow of study. ICU, intensive care unit.
The number of claims for reimbursement to the Korean National Health Insurance Service in Republic of Korea from January 1,
2011 to December 31, 2015 (n=14905721).
9714083 subjects without ICU admission experience before January 1, 2011 were composed in present study.
1498102 subjects were analyzed (male=861397, female=636705).
<Exclusion>
- 858024 subjects were excluded due to duplicate claim for reimbursement at same institute.
- 4333383 subjects who were experienced with ICU admission before January 1, 2011.
- 231 subjects were excluded due to hospital record exists even after the death record.
Additionally, 8215981 subjects without ICU admission experience were excluded during the study period, from
Ethical approval and consent to participate
This study was approved by the Institutional Review Board of the National Health Insurance Service of the Ilsan Hospital (approval number: NHIMC2017PR026), and it adhered to the tenets of the Declaration of Helsinki. Informed consent was waived by the institutional review board due to the study’s ret-rospective nature, and the data were de-identified in the used database.
Statistical analysis
All continuous data except hospital length of stay are described as mean±standard deviation, and categorical data are described as frequency and proportion. Length of hospital stay is shown as median and interquartile range. Continuous data were alyzed using the Student’s t test, and categorical data were an-alysed using the chi-square test. The risk factors for in-hospital and 28-day mortality are presented as hazard ratios using a Cox proportional hazards model. A trend test was performed on the effect of age and nursing grade on in-hospital mortality. All statistical analyses were conducted using the SAS ver. 9.4 soft-ware (SAS Institute, Cary, NC, USA). Two-sided p values <0.05 were considered statistically significant.
RESULTS
Baseline characteristics
Among a total of 1498102 subjects who were admitted to the ICU during the study period, 861397 were male (57.5%) and 636705 were female (42.5%). The mean age at admission was 63.4±18.2 years (male, 61.3; female, 66.3), and most patients were aged above 60 years (male, 58.4%; female, 70.8%). Ap-proximately 22.1% of the patients received mechanical venti-lation and 4.1% required renal replacement therapy. Vasopres-sor and inotropic drugs were used in 15.0% of the patients. Forty percent of patients were admitted to the ICU of a tertiary hos-pital; only 48.9% of patients were treated in the ICU by an in-tensivist who dedicated much of their clinical practice to ICU work. Nursing grades were variable; nursing services grade 2 or higher were provided in 86.4% of hospitals, indicating that one nurse cared for more than 2.5 patients in 86.4% of the fa-cilities. Other baseline characteristics of the study subjects are described in Table 1 and Supplementary Table 3 (only online). Change in characteristics of patients admitted to the ICU, 2011–2015
From 2011 to 2015, the number of patients admitted to the ICU and the rate of admission among patients aged over 70 years gradually increased (Fig. 2, p for trend <0.001). During the 5-year period, the median length of hospital stay was 12 days, and the in-hospital mortality rate was 12.9% (Table 1 and Supplemen-tary Table 3, only online). From 2011 to 2015, the mortality rate slightly decreased from 13.2% to 12.4% (Fig. 2, p for trend <0.001).
The proportion of patients who were managed by intensivists also slightly decreased over these 5 years (Fig. 2, p for trend <0.001). However, the proportion of ICU wards offering grade 1 nursing services showed an increase from 13.1% to 13.8% (Supplementary Table 3, only online).
Risk factors for in-hospital and 28-day mortality of ICU patients
Table 2 shows the statistically significant risk factors for in-hos-pital and 28-day mortality rates of ICU patients using a Cox pro-portional hazards model that includes sex, age, CCI, income, mechanical ventilator, vasopressor, nursing grade hospitaliza-tion type, and the presence of intensivist. Both in-hospital and 28-day mortality rates were significantly higher in male patients and those of lower socioeconomic status. With increasing age and lower number of nursing staff, the mortality risk increased significantly by two or three times. Patients who received me-chanical ventilator care, renal replacement therapy, or vaso-pressor and inotropic drugs showed higher mortality rates com-pared to those who did not. The mortality risk was lower in patients admitted to an ICU of a tertiary university hospital and an ICU where an intensivist worked.
In-hospital mortality according to age, nurse-to-patient ratio, presence of intensivist, and hospital type
We investigated the in-hospital mortality rate among all patients, as well as those using mechanical ventilation, those using vaso-pressor and inotropic drugs, and those receiving renal replace-ment therapy. Fig. 3 shows the results of our analysis. As age in-creased, in-hospital mortality increased in all groups including mechanical ventilation, vasopressor and inotropic drugs, and renal replacement (Fig. 3A, p for trend <0.001). In terms of nurs-ing grade, all patients, those usnurs-ing mechanical ventilators, as well as those using vasopressor and inotropic drugs showed an increasing trend of in-hospital mortality according to increas-ing nursincreas-ing grade (p for trend <0.001). Patients receivincreas-ing renal replacement therapy showed high in-hospital mortality rates regardless of nursing grade (Fig. 3B). All groups managed by intensivists showed lower in-hospital mortality rates compared to those without intensivists (without vs. with, 18.3% vs. 15.0%, p<0.001). Moreover, in-hospital mortality rates were significantly lower with intensivists compared to without intensivists in the analysis of all patients, patients using mechanical ventilation, and patients using vasopressor and inotropic drugs (Fig. 3C, p<0.001). Furthermore, analysis by hospital type showed that a tertiary hospital had significantly lower in-hospital mortality rates in all patients, patients using vasopressor and inotropic drugs, patients using mechanical ventilators, and patients us-ing renal replacement (Fig. 3D).
Table 1. Characteristics of ICU Hospitalizations in South Korea, 2011–2015
Variable Total Male Female p value
Number of hospitalizations 1498102 861397 636705
Number of patients 1150452 656409 494043
Age (yr) 63.4±18.2 61.3±17.4 66.3±18.8 <0.001
Age group (yr) <0.001
0–9 29770 (1.99) 16599 (1.93) 13171 (2.07) 10–19 17780 (1.19) 10956 (1.27) 6824 (1.07) 20–29 28268 (1.89) 16599 (1.93) 11669 (1.83) 30–39 59472 (3.97) 35253 (4.09) 24219 (3.8) 40–49 144893 (9.67) 97177 (11.28) 47716 (7.49 50–59 264167(17.63) 181836 (21.11) 82331 (12.93) 60–69 296215 (19.77) 190583 (22.12) 105632 (16.59) 70–79 394902 (26.36) 210365 (24.42) 184537 (28.98) 80–89 227610 (15.19) 91649 (10.64) 135961 (21.35) ≥90 35025 (2.34) 10380 (1.21) 24645 (3.87) <18 42389 (2.83) 24251 (2.82) 18138 (2.85) 0.223 ≥18 1455713 (97.17) 837146 (97.18) 618567 (97.15) Comorbidity Myocardial infarction 253652 (16.93) 159388 (18.5) 94264 (14.8) <0.001
Congestive heart failure 536474 (35.81) 287776 (33.41) 248698 (39.06) <0.001
Peripheral vascular disease 520002 (34.71) 283563 (32.92) 236439 (37.13) <0.001
Cerebrovascular disease 754821 (50.39) 407627 (47.32) 347194 (54.53) <0.001
Dementia 404308 (26.99) 187530 (21.77) 216778 (34.05) <0.001
Chronic pulmonary disease 1077478 (71.92) 602356 (69.93) 475122 (74.62) <0.001
Connective tissue disease 198078 (13.22) 89561 (10.4) 108517 (17.04) <0.001
Peptic ulcer disease 929906 (62.07) 525346 (60.99) 404560 (63.54) <0.001
Liver disease 955098 (63.75) 564587 (65.54) 390511 (61.33) <0.001 Diabetes mellitus 986796 (65.87) 568550 (66) 418246 (65.69) <0.001 Renal disease 389749 (26.02) 222923 (25.88) 166826 (26.2) <0.001 Hemiplegia 258928 (17.28) 146448 (17) 112480 (17.67) <0.001 Tumor 204757 (13.67) 120497(13.99) 84260 (13.23) <0.001 Leukaemia 491896 (32.83) 314903 (36.56) 176993 (27.8) <0.001 Lymphoma 96019 (6.41) 68227 (7.92) 27792 (4.36) <0.001
Metastatic solid tumor 139497 (9.31) 87247 (10.13) 52250 (8.21) <0.001
AIDS 2967 (0.2) 2003 (0.23) 964 (0.15) <0.001 CCI 6.98±3.84 7±3.96 6.95±3.68 <0.001 Income <0.001 Medicaid 202559 (13.52) 107239 (12.45) 95320 (14.97) Quintile 1 (lowest) 210809 (14.07) 115876 (13.45) 94933 (14.91) Quintile 2 189078 (12.62) 116467 (13.52) 72611 (11.4) Quintile 3 222309 (14.84) 133552 (15.5) 88757 (13.94) Quintile 4 268035 (17.89) 159092 (18.47) 108943 (17.11) Quintile 5 (highest) 405312 (27.06) 229171 (26.6) 176141 (27.66) Mechanical ventilation 331328 (22.12) 200815 (23.31) 130513 (20.5) <0.001 Renal replacement 61471 (4.1) 37584 (4.36) 23887 (3.75) <0.001
DISCUSSION
In this study, we investigated the changes of in-hospital mortal-ity rates and risk factors related to mortalmortal-ity in ICUs of South
Korea. The in-hospital mortality rates of patients admitted to all ICU types over the 5-year study period was 12.9%, while the mortality rate slightly decreased from 13.2% to 12.4% from 2011 to 2015. Male sex, older age, lower socioeconomic status, need Table 1. Characteristics of ICU Hospitalizations in South Korea, 2011–2015 (continued)
Variable Total Male Female p value
Nursing grade <0.001 Grade 1* 203635 (13.59) 119217 (13.84) 84418 (13.26) Grade 2 338125 (22.57) 197944 (22.98) 140181 (22.02) Grade 3 411535 (27.47) 239300 (27.78) 172235 (27.05) Grade 4 137967 (9.21) 80307 (9.32) 57660 (9.06) Grade 5 75653 (5.05) 42448 (4.93) 33205 (5.22) Grade 6 145941 (9.74) 79447 (9.22) 66494 (10.44) Grade 7 90598 (6.05) 49145 (5.71) 41453 (6.51) Grade 8 47449 (3.17) 28071 (3.26) 19378 (3.04) Grade 9† 47120 (3.15) 25470 (2.96) 21650 (3.4) Hospitalization type <0.001 Tertiary 599858 (40.04) 354119 (41.11) 245739 (38.6) General 856443 (57.17) 484880 (56.29) 371563 (58.36) Other 41722 (2.79) 22350 (2.59) 19372 (3.04) Intensivists 732931 (48.92) 428729 (49.77) 304202 (47.78) <0.001
Length of hospital stay, days, median (IQR) 12 (6–21) 12 (6–21) 12 (6–22) <0.001
In-hospital mortality 193118 (12.89) 113104 (13.13) 80014 (12.57) <0.001
28-day mortality 209216 (13.97) 121989 (14.16) 87227 (13.7) <0.001
ICU, intensive care unit; AIDS, acquired immunodeficiency syndrome; CCI, Charlson Comorbidity Index; IQR, interquartile range. Data are presented as mean±standard deviation or n (%).
*Nursing grade 1=total nursing staff-to-total ICU beds >2, †Nursing grade 9=total nursing staff-to-total ICU beds ≤0.5.
Fig. 2. Change in number and mortality rate of patients admitted to the ICU, 2011–2015. ICU, intensive care unit.
350000 300000 250000 200000 150000 100000 60 50 40 30 20 10 0 2011 Number of hospitalization In hospital morality *p for trend <0.001
Rate of ≥70 years among ICU hospitalization Proportion of intensivists Number of patients 2012 2013 2014 2015 Person Percent 262863 302243 290262 317515 325219 49.9 50.8 40.9 4.3 44.1 47.8 47.2 49.1* 46.1* 12.42* 12.65 12.96 13.32 13.22 44.7 227663 256728 227663 269034 274860
for mechanical ventilation, need for vasopressor and inotro-pic drugs, need for renal replacement therapy, ICU treatment without an intensivist, and ICU treatment with lower nursing
staff numbers were identified as risk factors associated with in-hospital mortality.
As reported in several previous studies, the need for mechan-ical ventilation, vasopressor and inotropic drugs, and renal re-placement treatment were shown to be risk factors of ICU mor-tality in our study.10-12 These factors by themselves indicated that
patients had multiple organ dysfunction, unstable vital signs, and high risk of mortality. Unfortunately, this study did not have data about the admission cause and management methods for individual patients. Therefore, we focused on the prevent-able and changeprevent-able factors. In our study, nursing grade (total ICU bed numbers/total nursing staff) and presence of inten-sivists were identified as changeable factors.
Many studies have reported that lower number of nursing staffs was associated with higher in-hospital mortality rate.13,14,21
Our study showed a similar trend in that the mortality risk in-creased with fewer nursing staffs. Previous studies reported an optimal nurse-to-ICU patient ratio.13,14,21 Although some
differ-ences exist, the American Nurse Association and British Asso-ciation of Critical Care Nurses recommend a ratio of 1:2 or less.22,23 Another study reported that a nurse-to-patient ratio
ex-ceeding 1:1.5 was associated with a lower in-hospital mortality rate than that with a 1:2 ratio.13 The authors of the previous study
assumed that working nurses with limited resources and time constraints were associated with a decreased nurse-to-patient ratio, which may increase the likelihood of mistakes by creat-ing a stressful environment with distractions and interruptions that adversely affect quality of care.13 A recent study of cohort
data reported that even 1 day of high staffing ratio is associated with increased mortality rates of critically ill patients.24 In this
study, nursing grade 1 was defined as a nurse-to-patient ratio of less than 1:2.5; and it is a sad reality that nursing grade 1 ac-counted for 13.6% of total ICU hospitalizations in South Korea. However, this means that if the nurse-to-patient ratio increases, the ICU mortality rate can be decreased. Actually, in this study, the proportion of nursing grades 1 and 2 increased from 29.5% to 43.8% from 2011 to 2015, and mortality decreased accord-ingly (Supplementary Table 3, only online).
The second related factor was the presence of intensivists in the ICU. Several studies have recommended the involvement of intensivists, since the majority of ICU patients tend to have multiple problems that require complex management.15,25-27 A
large meta-analytic study reported that the presence of an in-tensivist could reduce the in-hospital mortality risk to 0.83.15
Our study also showed that the presence of an intensivist could significantly lower the in-hospital mortality risk to 0.91. In par-ticular, patients treated with mechanical ventilation or vaso-pressor and inotropic drugs showed decreased mortality rates. This result may have been influenced by the fact that the use of mechanical ventilator, vasopressor, and inotropic drugs are adjusted in real-time according to a patient’s condition, and that the presence of an intensivist might satisfy this need. In the case of renal replacement therapy, it is supposed that the Table 2. Risk Factors for in-Hospital and 28-Day Mortality
In-hospital mortality HR (95% CI) 28-day mortality HR (95% CI) Sex Male 1 1 Female 0.89 (0.884–0.9) 0.88 (0.867–0.883)
Age group (yr)
0–9 1.00 1.00 10–19 1.20 (1.111–1.303) 1.49 (1.369–1.615) 20–29 1.14 (1.067–1.227) 1.49 (1.388–1.601) 30–39 1.36 (1.281–1.442) 1.86 (1.75–1.979) 40–49 1.69 (1.602–1.784) 2.45 (2.311–2.587) 50–59 1.95 (1.846–2.05) 2.78 (2.635–2.943) 60–69 2.26 (2.144–2.38) 3.25 (3.08–3.439) 70–79 3.02 (2.868–3.183) 4.69 (4.436–4.951) 80–89 4.21 (3.992–4.432) 6.86 (6.492–7.248) ≥90 5.70 (5.394–6.024) 9.79 (9.245–10.37) CCI 0.98 (0.979–0.981) 0.98 (0.974–0.976) Income Medicaid 1.00 1.00 Quintile 1 (lowest) 0.88 (0.866–0.895) 0.90 (0.887–0.916) Quintile 2 0.90 (0.882–0.913) 0.91 (0.891–0.921) Quintile 3 0.89 (0.877–0.907) 0.90 (0.882–0.911) Quintile 4 0.89 (0.879–0.908) 0.89 (0.872–0.899) Quintile 5 (highest) 0.88 (0.862–0.888) 0.85 (0.838–0.862) Mechanical ventilation 4.94 (4.886–4.989) 6.28 (6.215–6.341) Renal replacement 2.87 (2.829–2.904) 3.12 (3.075–3.161)
Vasopressor and inotropic drugs 2.28 (2.256–2.302) 2.35 (2.323–2.37) Nursing grade Grade 1* 1.00 1.00 Grade 2 1.57 (1.535–1.597) 1.65 (1.619–1.683) Grade 3 1.76 (1.729–1.798) 1.82 (1.787–1.857) Grade 4 1.89 (1.848–1.939) 1.98 (1.932–2.025) Grade 5 2.33 (2.271–2.399) 2.38 (2.321–2.448) Grade 6 2.62 (2.552–2.68) 2.68 (2.62–2.748) Grade 7 2.76 (2.693–2.836) 2.81 (2.739–2.882) Grade 8 2.56 (2.484–2.643) 2.62 (2.544–2.701) Grade 9† 2.86 (2.778–2.952) 2.80 (2.717–2.882) Hospitalization type Tertiary 1 1 General 1.06 (1.05–1.077) 1.05 (1.039–1.065) Other type 1.60 (1.562–1.646) 1.61 (1.568–1.648) Intensivist 0.91 (0.901–0.921) 0.90 (0.893–0.912)
Length of hospital stay, days 0.41 (0.408–0.412) 0.90 (0.898–0.9) HR, hazard ratio; CI, confidence interval; CCI, Charlson Comorbidity Index; ICU, intensive care unit.
*Nursing grade 1=total nursing staff-to-total ICU beds >2, †Nursing grade 9=total nursing staff-to-total ICU beds ≤0.5.
patient already had multiple organ failures and high severity; therefore, we could assume that the intensivist was less effec-tive due to the patient’s high severity condition. Since less than 50% of the patients in our study received management by in-tensivists, increasing the proportion of intensivists in ICU set-tings would decrease the in-hospital mortality rate. It should also be noted that, in South Korea, the definition of intensivist is one daytime worker per 30 ICU beds. In a previous statement from the Society of Critical Care Medicine (SCCM) taskforce, the intensivist-to-patient ratio in a closed ICU was discussed; however, the optimal ratio was not determined, due to too many variables.28 The SCCM advertised that an academic medical ICU
with a ratio less favourable than 1:14 negatively affected edu-cation, staff’s well-being, and patient care.28 In a recent study
in the United Kingdom, the optimal intensivist-to-patient ra-tio was 1:7.5, while the mortality rate increased when the in-tensivist-to-patient ratio decreased to less than 1:7.5.29 Although
it is difficult to generalize the current ICU findings to other coun-tries, this study showed that an optimal patient-to- intensivist ratio was associated with decreased in-hospital and ICU mor-tality rates.29,30 Therefore, in addition to the presence of
intensiv-ists, achieving the optimal intensivist-to-patient ratio will de-crease the in-hospital mortality rate.
Our study’s main strength is that it is the first to investigate the
factors associated with in-hospital mortality, including nursing grade and the presence of intensivist, among ICU patients us-ing large cohort data in South Korea. This study may have im-portant implications for critical care management in South Korea and other countries with similar medical environments. Nevertheless, our study also had some limitations. First, it used a homogeneous Asian cohort; therefore, our findings may not be generalizable. The reproducibility and applicability should be tested in future studies with other cohorts. Second, since our cohort data consisted of claims data for a single-insurer system, we could not adjust for severity using ICU mortality scores, such as the Acute Physiology and Chronic Health Evaluation score or the Sequential Organ Failure Assessment score. These fac-tors might have affected the multivariate analysis. Third, the facilities included in this study did not reflect the characteristics of specialized ICU settings such as medical, coronary, surgery, neurosurgery, and emergency, as they were not distinguished. Finally, the risk factor analysis associated with individual pa-tients did not include the data regarding the cause of admis-sion, rate of hospital visitation, or management method of in-dividual patients. For example, the patient’s income level might be associated with mortality due to the rate of hospital visita-tion and prevalence of comorbidities; however this was diffi-cult to prove due to the limitations of data. Therefore, prospec-Fig. 3. In-hospital mortality by (A) age, (B) nurse-to-patient ratio, (C) presence of intensivist, and (D) hospital type.
90 80 70 60 50 40 30 20 10 0 80 70 60 50 40 30 20 10 0 0–9 10–19 20–29 30–39 40–49 Without intensivists 18.3 53.1 46.3 70.2 15.0 40.3 38.0 69.3 With intensivists *p=0.05 ‡p<0.001 †p=0.001 ‡p<0.001 50–59 60–69 70–79 80–89 ≥90
1 degree 2 degree 3 degree 4 degree 5 degree 6 degree 7 degree 8 degree 9 degree
* * * * * * * (%) (%) A B 80 70 60 50 40 30 20 10 0 (%) C All Mechanical ventilation Vasopressor Renal replacement
Tertiary General Other type
† ‡ ‡ ‡ ‡ ‡ ‡ * 90 80 70 60 50 40 30 20 10 0 (%) D
All Mechanical ventilation Vasopressor Renal replacement All Mechanical ventilation Vasopressor Renal replacement All
Vasopressor
Mechanical ventilation Renal replacement *p for trend <0.001 *p for trend <0.001
tive multicenter cohort studies involving various patient data should be performed.
In conclusion, the number of nursing staffs and the presence of an intensivist at ICU were associated with the ICU mortality rate. Therefore, optimal nurse-to-patient ratio, intensivist pres-ence, and optimal intensivist-to-patient ratio would reduce the mortality rate among ICU patients.
ACKNOWLEDGEMENTS
This study used National Health Insurance Service (NHIS) 2011–2015 database (NHIS-2019-1-164). This work was sup-ported by the NHIS Ilsan Hospital grant (NHIMC 2017-20-026).
AUTHOR CONTRIBUTIONS
Conceptualization: Su Hwan Lee, Young Sam Kim, Eun Cheol Park, and Chang Hoon Han. Data curation: Young Sam Kim, Eun Cheol Park, and Chang Hoon Han. Formal analysis: Jung Hwa Hong and Eun Cheol Park. Funding acquisition: Chang Hoon Han. Investiga-tion: all authors. Methodology: Su Hwan Lee, Jung Hwa Hong, and Chang Hoon Han. Project administration: Young Sam Kim, Eun Cheol Park, and Chang Hoon Han. Resources: Jung Hwa Hong and Chang Hoon Han. Software: Jung Hwa Hong and Eun Cheol Park. Supervi-sion: Chang Hoon Han. Validation: Young Sam Kim and Eun Cheol Park. Visualization: Su Hwan Lee and Jung Hwa Hong. Writing—origi-nal draft: Su Hwan Lee and Jung Hwa Hong. Writing—review & edit-ing: all authors. Approval of final manuscript: all authors.
ORCID iDs
Su Hwan Lee https://orcid.org/0000-0002-3487-2574 Jung Hwa Hong https://orcid.org/0000-0003-4495-1695 Young Sam Kim https://orcid.org/0000-0001-9656-8482 Eun Cheol Park https://orcid.org/0000-0002-2306-5398 Sun Min Lee https://orcid.org/0000-0003-3325-3242 Chang Hoon Han https://orcid.org/0000-0002-4664-8924
REFERENCES
1. World Health Organization. Global Health and Aging. NIH Publi-cation no 11-7737; 2011 [Internet]. Geneva: World Health Organi-zation [accessed on 2018 Agust 1]. Available at: https://www.who. int/ageing/publications/global_health/en.
2. Gill TM, Allore HG, Holford TR, Guo Z. Hospitalization, restricted activity, and the development of disability among older persons. JAMA 2004;292:2115-24.
3. Dwyer R, Stoelwinder J, Gabbe B, Lowthian J. Unplanned transfer to emergency departments for frail elderly residents of aged care facilities: a review of patient and organizational factors. J Am Med Dir Assoc 2015;16:551-62.
4. Sprung CL, Artigas A, Kesecioglu J, Pezzi A, Wiis J, Pirracchio R, et al. The Eldicus prospective, observational study of triage decision making in European intensive care units. Part II: intensive care benefit for the elderly. Crit Care Med 2012;40:132-8.
5. Bagshaw SM, Webb SA, Delaney A, George C, Pilcher D, Hart GK, et al. Very old patients admitted to intensive care in Australia and New Zealand: a multi-centre cohort analysis. Crit Care 2009;13:R45.
6. Halpern NA, Pastores SM. Critical care medicine in the United States 2000-2005: an analysis of bed numbers, occupancy rates, payer mix, and costs. Crit Care Med 2010;38:65-71.
7. Curtis JR, Engelberg RA, Bensink ME, Ramsey SD. End-of-life care in the intensive care unit: can we simultaneously increase quality and reduce costs? Am J Respir Crit Care Med 2012;186: 587-92.
8. Lerolle N, Trinquart L, Bornstain C, Tadié JM, Imbert A, Diehl JL, et al. Increased intensity of treatment and decreased mortality in elderly patients in an intensive care unit over a decade. Crit Care Med 2010;38:59-64.
9. Kramer AA, Dasta JF, Kane-Gill SL. The impact of mortality on to-tal costs within the ICU. Crit Care Med 2017;45:1457-63.
10. Chen YC, Lin SF, Liu CJ, Jiang DD, Yang PC, Chang SC. Risk fac-tors for ICU mortality in critically ill patients. J Formos Med Assoc 2001;100:656-61.
11. Bickenbach J, Fries M, Rex S, Stitz C, Heussen N, Rossaint R, et al. Outcome and mortality risk factors in long-term treated ICU pa-tients: a retrospective analysis. Minerva Anestesiol 2011;77:427-38.
12. Mukhopadhyay A, Tai BC, See KC, Ng WY, Lim TK, Onsiong S, et al. Risk factors for hospital and long-term mortality of critically ill elderly patients admitted to an intensive care unit. Biomed Res Int 2014;2014:960575.
13. Sakr Y, Moreira CL, Rhodes A, Ferguson ND, Kleinpell R, Pickkers P, et al. The impact of hospital and ICU organizational factors on outcome in critically ill patients: results from the Extended Preva-lence of Infection in Intensive Care study. Crit Care Med 2015;43: 519-26.
14. Vincent JL, Rello J, Marshall J, Silva E, Anzueto A, Martin CD, et al. International study of the prevalence and outcomes of infection in intensive care units. JAMA 2009;302:2323-9.
15. Wilcox ME, Chong CA, Niven DJ, Rubenfeld GD, Rowan KM, Wunsch H, et al. Do intensivist staffing patterns influence hospi-tal morhospi-tality following ICU admission? A systematic review and meta-analyses. Crit Care Med 2013;41:2253-74.
16. Kim JH, Hong SK, Kim KC, Lee MG, Lee KM, Jung SS, et al. Influ-ence of full-time intensivist and the nurse-to-patient ratio on the implementation of severe sepsis bundles in Korean intensive care units. J Crit Care 2012;27:414.e11-21.
17. Park J, Jeon K, Chung CR, Yang JH, Cho YH, Cho J, et al. A nation-wide analysis of intensive care unit admissions, 2009-2014 - The Korean ICU National Data (KIND) study. J Crit Care 2018;44:24-30.
18. Seong SC, Kim YY, Park SK, Khang YH, Kim HC, Park JH, et al. Cohort profile: the National Health Insurance Service-National Health Screening Cohort (NHIS-HEALS) in Korea. BMJ Open 2017; 7:e016640.
19. Sundararajan V, Henderson T, Perry C, Muggivan A, Quan H, Ghali WA. New ICD-10 version of the Charlson comorbidity index predicted in-hospital mortality. J Clin Epidemiol 2004;57:1288-94. 20. World Health Organization. The anatomical therapeutic chemical
classification system with defined daily doses (ATC/DDD) (2004) [Internet]. Geneva: World Health Organization [accessed on 2020 July 1]. Available at: https://www.who.int/classifications/atcddd/ en.
21. Penoyer DA. Nurse staffing and patient outcomes in critical care: a concise review. Crit Care Med 2010;38:1521-8.
22. McMenamin P, Peterson C, McHugh MD, Sochalski J. Optimal Nurse Staffing to Improve Quality of Care and Patient Outcomes: Executive Summary. American Nurses Association, Avalere Health LLC, 2015.
al. Standards for nurse staffing in critical care units determined by: The British Association of Critical Care Nurses, The Critical Care Networks National Nurse Leads, Royal College of Nursing Critical Care and In-flight Forum. Nurs Crit Care 2010;15:109-11. 24. Lee A, Cheung YSL, Joynt GM, Leung CCH, Wong WT, Gomersall
CD. Are high nurse workload/staffing ratios associated with de-creased survival in critically ill patients? A cohort study. Ann In-tensive Care 2017;7:46.
25. Costa DK, Wallace DJ, Kahn JM. The association between daytime intensivist physician staffing and mortality in the context of other ICU organizational practices: a multicenter cohort study. Crit Care Med 2015;43:2275-82.
26. Angus DC, Shorr AF, White A, Dremsizov TT, Schmitz RJ, Kelley MA, et al. Critical care delivery in the United States: distribution of services and compliance with Leapfrog recommendations. Crit
Care Med 2006;34:1016-24.
27. Lilly CM, Zuckerman IH, Badawi O, Riker RR. Benchmark data from more than 240,000 adults that reflect the current practice of critical care in the United States. Chest 2011;140:1232-42. 28. Ward NS, Afessa B, Kleinpell R, Tisherman S, Ries M, Howell M, et
al. Intensivist/patient ratios in closed ICUs: a statement from the Society of Critical Care Medicine Taskforce on ICU Staffing. Crit Care Med 2013;41:638-45.
29. Gershengorn HB, Harrison DA, Garland A, Wilcox ME, Rowan KM, Wunsch H. Association of intensive care unit patient-to-intensiv-ist ratios with hospital mortality. JAMA Intern Med 2017;177:388-96.
30. Viglianti EM, Iwashyna TJ. Toward the ideal ratio of patients to in-tensivists: finding a reasonable balance. JAMA Intern Med 2017; 177:396-8.