1Department of Periodontology, Research Institute for Periodontal Regeneration, College of Dentistry, Yonsei University 2Research Institute for Medical Instruments & Rehabilitation Engineering, Yonsei University, Wonju
초
초록
록
연 연구구 목목적적:: 3차원 유한요소법(3-D FEA)은 3차원구조의 응력분산을 연구하는데 적절한 방법으로 생각된다. 이 연구의 목적은 유한요소법을 이용하여 각기 다른 골질과 골 량을 가지는 위축된 상악 후방 구치부에서 치관-임플란트 비율에 따른 임플란 트의 안정성을 알아보고자 한다. 연 연구구재재료료 및및 방방법법:: 제2소구치가 결손된 상악 유한요소 모형이 이번 연구에 사용되었다. 이 모형을 해면골량에 따라 3개의 실험 군으로 분류하였다. 첫번째 실험군은 해면골이 12mm이상인 군으로, 두번째 실험군은 5mm의 해면골을 가지는 군으로, 세 번째 실험군은 5mm의 해면골에 이식된 골을 가지는 군으로 분류하였다. 특히 세번째 실험군은 이식된 골의 골질에 따라 두 개의 하위군으로 분류하였다. 구개측 교두와 중심와에 각각 수직으로 200N 힘과 구개측 교두에 사선으로 200N 힘을 가하 였다. 연 연구구성성적적:: 중심와와 구개측 교두에 수직으로 힘을 가했을 경우에는 치관-임플란트비에 따라 응력의 차이가 없었다. 그러나 구 개측 교두에 사선으로 힘을 가했을 경우 치관-임플란트비에 비례하여 응력이 증가하는 것을 알 수 있었다. 해면골이 12mm이상인 군에서는 치관-임플란트비가 2.0인 경우 0.5의 치관-임플란트비를 가지는 경우보다 3배나 큰 응력 을 보였다. 결 결론론:: 임플란트에 중심 수직 부하와 측방 수직 부하를 가했을 경우 치관-임플란트 비에 따른 응력의 차이는 없었고 사선으로 부하가 가했졌을 경우 치관-임플란트 비에 정비례하여 응력이 증가하였다. 임플란트 주변골에서의 최고 응력은 임플란트목 주위의 구개측 피질골에서 나타났다. 주 주요요단단어어:: 상악동 이식술, 유한요소법, 임플란트지지 보철물, 치관-임플란트 비, 치관-치근 비Three-Dimensional Finite Element Analysis of Stability in Proportion to
Crown-to-Implant Ratio in the Different Maxillary Bone Conditions
Seung-Hwan Youn1, Won-Phil Park2, Do-Hyung Lim2, Han-Sung Kim2, Kyoo-Sung Cho1,
Jung-Kiu Chai1, Chong-Kwan Kim1, Seong-Ho Choi1
T
he therapeutic regimen for treating patients with missing teeth has been significantly expanded by modern implant methods. The prosthesis support-ed by implants has become an important part of restorative therapy for both completely and partially edentulous patients1,2).However, a prerequisite for successful oral implants is suf-ficient bone height3). Longer implants provide greater
sur-face area for direct bone contact, thereby the reducing local-ized stress in bone that can develop in crestal region due to transverse force components.
In using osseointegrated dental implants for partially eden-tulous patients, clinicians are frequently confronted with insufficient bone, especially in maxilla.
Thus, the implant placement in the maxilla can be difficult for many reasons, including inadequate posterior alveolus, increased pneumatization of maxillary sinus, and close approximation of sinus floor to crestal bone. The thickness of bone beneath the maxillary sinus correlates with the degree of pneumatization. Sinus pneumatization may mini-mize or completely eliminate the amount of vertical bone available4). In addition to the problem of a compromised
alveolar ridge, the maxillary sinus can vary in size and shape, making implant placement impossible without surgi-cal modification5).
Several techniques and a variety of materials have been reported to increase posterior maxillary bone height to per-mit successful dental implant placement6,7). But these are
very difficult methods and an additional surgery is needed.
For residual ridge with minimal bone height but adequate bone width, the use of short and wide implants may offer a simple and predictable treatment alternative in posterior area8,9,10).
The reasons are that the majority of the stress is concen-trated at the level of the first few threads to the crestal corti-cal bone when an implant is loaded10,11,12,13,14,15).
But in short implants, length of crown is important fac-tor16). As crown’s length is longer, bending moment is
greater. Moreover stress under oblique loading were approx-imately 10 times greater than under axial loading17,18).
Treatment planning for conventional fixed prosthodontic restorations using natural teeth as abutments requires consid-eration of the crown-to-root (C/R) ratio of these abutments19). In addition Ante’s law20)dictates that the
com-bined peri-cemental area of all of the abutment teeth should be equal to or greater than the peri-cemental area of the teeth to be replaced. Both the C/R ratio and peri-cemental area influence the degree of stress within the attachment mecha-nism. In the case of teeth, the mechanism of attachment is the periodontal ligament. Because this suspensory ligament is highly reactive to occlusal overload, it is generally recom-mended that a ratio of 2 lengths root structure embedded in healthy bone be used for 1 length of crown (ie, C/R ratio = 1:2 or 0.5). If this is not possible, an increased number of abutment teeth should be used. When the original Brånemark System implant was introduced, long implant fixtures were needed to avoid excessively high stress to cre-stal bone. Therefore small crown-to-implant ratio (ie, about 0.5) became the norm in implants 21,22,23,24,25,26).
The distribution of forces in peri-implant bone has been investigated by finite element analysis in several studies. Recently, the stress distribution in bone correlated with
implant-supported prosthesis design has been investigated primarily by means of 2-dimensional (2-D) and 3-dimen-sional (3-D) finite element analyses (FEAs). Studies com-paring the accuracy of these analyses showed that, if detailed stress information is required, then 3-D modeling is neces-sary. The 3-D FEA is considered an appropriate method for investigation of the stress distribution throughout a 3-D structure. Therefore in the present study, this method was selected for the evaluation of stress distribution when bone and implants are loaded.
The purpose of this study was to determine the implant stability in proportion to crown-to-implant ratio in various conditions with different bone quality and quantity of the atrophic posterior maxilla using finite element analysis. The
hypothesis tested was that the stress of implant fixture increases in proportion to the crown-to-implant ratio in the implant-supported prostheses and the stress of implant fix-ture of good bone quality is lower than that of bad bone qual-ity.
A 3-D finite element model of a maxillary bone section with a missing second premolar was used in this study. After taking 2D CT images using Skyscan 1076 Micro-CT(Skyscan Co., Kontich, Belgium) of maxillary edentulous
Ⅱ
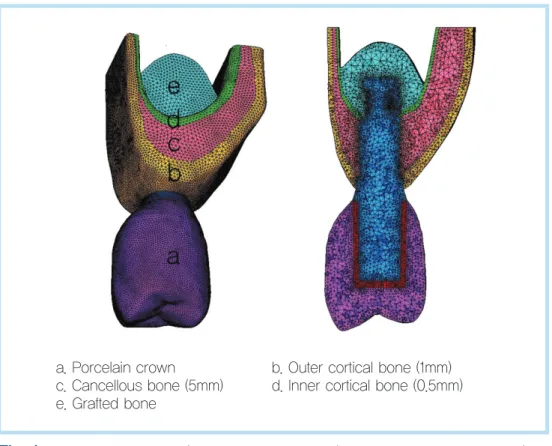
Fig. 1. Finite Element model ( Example in case of C/I ratio 1.0, 5.75mm bone level).
Seung-Hwan Youn et al: Three-Dimensional Finite Element Analysis of Stability in Proportion to Crown-to-Implant Ratio in the Different Maxillary Bone Conditions. Implantology 2008
a. Porcelain crown b. Outer cortical bone (1mm)
c. Cancellous bone (5mm) d. Inner cortical bone (0.5mm)
bone and implant fixture, we reconstructed 2D CT images to 3D CAD Model using BIONIX 3.3(CANTIBio Co., Suwon, Korea). Therefore, different bone dimensions were generat-ed to perform nonlinear calculations. The implant was placed into normal maxilla, an atrophic maxilla with crestal bone heights of 6.5mm, 5.75mm and an atrophic maxilla with grafted bone. Cancellous bone was modeled as a solid structure in cortical bone27,28)and classified by bone
quanti-ty.
A single-piece, 4.0 X 10mm screw-shaped dental implant system (Mk III implant, Brånemark; Nobel Biocare, Göteborg, Sweden) was selected for this study. Cobalt-Chromium (Wiron 99; Bego, Bremen, Germany) was simu-lated as a crown framework material, and feldspathic
porce-lain was used for the occlusal surface. Finite Element Model consist of 3-D 8-Node Structural Solid Element was made of 3D CAD model with Hyper Mesh 7.0(Altair Engineering, U.S.A.). The metal thickness used in this study was 1.0 mm. Cement thickness layer was not modeled28). All materials
were presumed to be linear elastic, homogenous, and isotropic12,18,27,29,30). Figure 1 displays the FE-model.
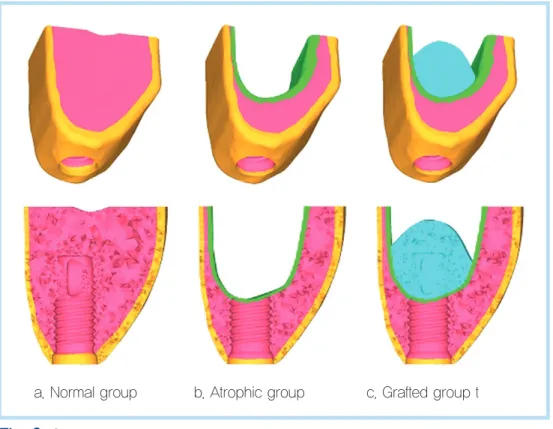
And we classified models into 3 groups according to the cancellous bone quantity. First group has over 12mm cancel-lous bone, second has 5mm height of cancelcancel-lous bone and third has grafted bone(Fig. 2).
In addition, we further classified the third group in two sub-groups considering the difference of bone quality in grafted bone.
Fig. 2. Classification of models according to cancellous bone quantity.
Seung-Hwan Youn et al: Three-Dimensional Finite Element Analysis of Stability in Proportion to Crown-to-Implant Ratio in the Different Maxillary Bone Conditions. Implantology 2008
Fig. 3. Crown-to-implant ratios in atrophic group(Examples in case of cancellous bone height : 5mm, length of fixture : 10mm).
Seung-Hwan Youn et al: Three-Dimensional Finite Element Analysis of Stability in Proportion to Crown-to-Implant Ratio in the Different Maxillary Bone Conditions. Implantology 2008
a. C/I ratio=0.5 b. C/I ratio=1 c. C/I ratio=1.5 d. C/I ratio=2
Table 1. Elastic properties of materials modeled.
Materials Modulus of elasticity, E (MPa) Poisson's ratio, v
Porcelain33) 68900 0.28
Cr-co alloy34) 218000 0.33
Titanium11) 110000 0.35
Cortical bone35) 13400 0.30
Cancellous bone36) 1370 0.30
Grafted bone37) Good : 690 Bad : 100
Good : 0.30 Bad : 0.20
Centric vertical loads Lateral vertical loads Oblique loads
Seung-Hwan Youn et al: Three-Dimensional Finite Element Analysis of Stability in Proportion to Crown-to-Implant Ratio in the Different Maxillary Bone Conditions. Implantology 2008
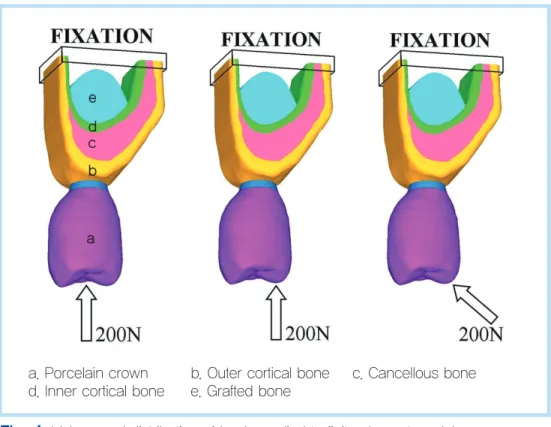
Fig. 4. Values and distribution of loads applied to finite element model.
Seung-Hwan Youn et al: Three-Dimensional Finite Element Analysis of Stability in Proportion to Crown-to-Implant Ratio in the Different Maxillary Bone Conditions. Implantology 2008
a. Porcelain crown b. Outer cortical bone c. Cancellous bone
d. Inner cortical bone e. Grafted bone
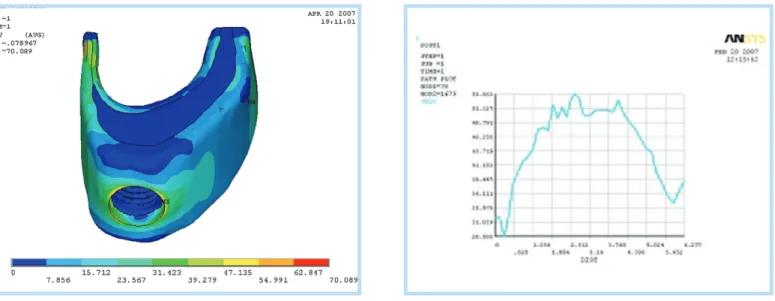
Fig. 5. Distribution of stresses in all locations with oblique loads (outer cortical: 0.5mm)
Seung-Hwan Youn et al: Three-Dimensional Finite Element Analysis of Stability in Proportion to Crown-to-Implant Ratio in the Different Maxillary Bone Conditions. Implantology 2008
Thus we classified 4 groups and said that the first group is normal group, the second group is atrophic group, the third group with good grafted bone quality is grafted (A) group, and the forth group with bad grafted bone quality is grafted (B) group .
Moreover we classified models according to Crown-to-implant ratio in atrophic maxilla. Crown-to-Implant ratio were 0.5, 1.0, 1.5 and 2.0(Fig. 3).
And cortical bone thickness used in this study was an inner thickness of 0.25 mm and outer thickness of 0.5 mm beneath the maxillary sinus for all bone levels.
The corresponding elastic properties such as Young’s modulus (E) and Poisson ratio (m) were determined from the literature15,30)and are summarized in Table I. Model consist
of elements and nodes(data not shown). A fixed bond between the bone and the implant along the interface was presumed. An occlusal force of 200 N was used. A vertical
load was applied at the palatal cusp (200 N) and central (200 N) area, and oblique load was applied at the palatal cusp (200 N) area (Fig. 4)15,31).
The final element on the x, y, z -axis for each design was assumed to be fixed, which defined the boundary condition. The applied forces were static. Stress levels were calculated using von Mises stresses32)values. The von Mises stresses
are the most commonly reported in FEA studies to summa-rize the overall stress state at a point12,18,27,29). The analyses
were performed on a computer (Intel Core2Duo E6600 ; Intel P965 Chipset) using software (ANSYS, version 10.0; ANSYS Corp, U.S.A.). Boundary conditions, loading, and mathematical models were prepared with finite element soft-ware. The outputs were transferred to the ANSYS program to display stress values and distributions. Data for stresses were produced numerically and color-coded.
Fig. 6. Von Mises stress value around implant in atrophic group.
Seung-Hwan Youn et al: Three-Dimensional Finite Element Analysis of Stability in Proportion to Crown-to-Implant Ratio in the Different Maxillary Bone Conditions. Implantology 2008
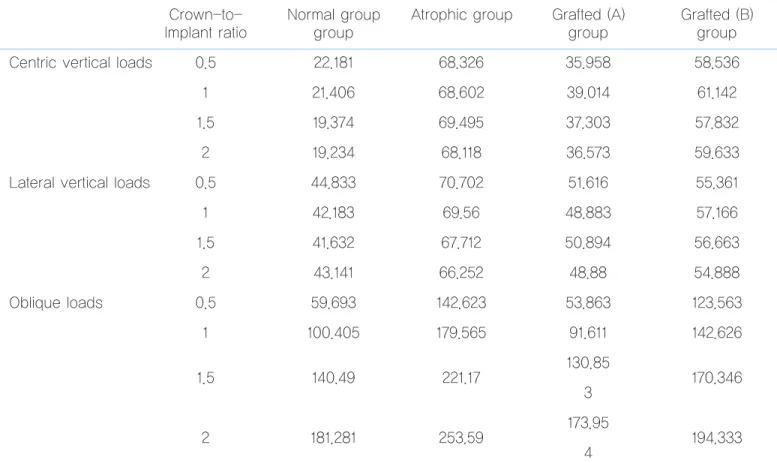
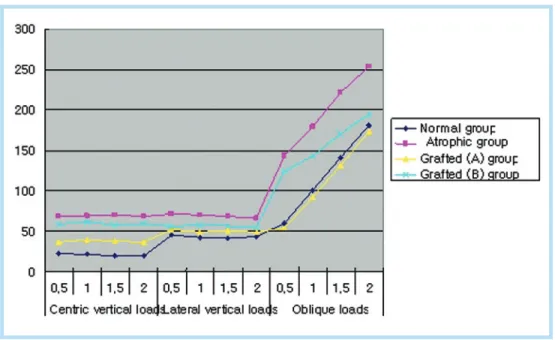
Table 2 represents maximum von Mises stress values by centric vertical loads, lateral vertical loads and oblique loads in 0.5mm outer cortical thickness in various maxillary bone conditions. For all bone levels, maximum von Mises stress values of 19.2 to 253.6 MPa were observed.
In centric vertical loads and lateral vertical loads, there are no progressions of von Mises stresses according to crown-to-implant ratio. But in oblique loads, there are in direct
pro-portion to crown-to-implant ratio.
In normal group with oblique loads, von Mises stress value of 2.0 crown-to-implant ratio is three times greater than that of 0.5 crown-to-implant ratio.
Figure 5 represent the stress distribution within bone struc-ture.
The maximum von Mises stress value was observed at the atrophic group in the 0.5mm outer cortical thickness and the lowest stress value was observed at the normal group in the outer cortical thickness 1.0mm.
Figure 6. Represents von Mises stress values around implant. Maximum stress values are on the maxilla cortex
Ⅲ
Table 2. Maximum von Mises stress values with centric vertical loads, lateral vertical loads and oblique loads in 0.5mm outer cortical thickness.
Crown-to- Normal group Atrophic group Grafted (A) Grafted (B)
Implant ratio group group group
Centric vertical loads 0.5 22.181 68.326 35.958 58.536
1 21.406 68.602 39.014 61.142
1.5 19.374 69.495 37.303 57.832
2 19.234 68.118 36.573 59.633
Lateral vertical loads 0.5 44.833 70.702 51.616 55.361
1 42.183 69.56 48.883 57.166 1.5 41.632 67.712 50.894 56.663 2 43.141 66.252 48.88 54.888 Oblique loads 0.5 59.693 142.623 53.863 123.563 1 100.405 179.565 91.611 142.626 130.85 1.5 140.49 221.17 170.346 3 173.95 2 181.281 253.59 194.333 4
Seung-Hwan Youn et al: Three-Dimensional Finite Element Analysis of Stability in Proportion to Crown-to-Implant Ratio in the Different Maxillary Bone Conditions. Implantology 2008
In the past two decades, finite element analysis (FEA) has been one of the most frequently used methods for the predic-tion of the effects of stress on the implant and surrounding bone. Vertical and oblique loads from mastication induce axial forces and bending moments, and result in stress gradi-ents in the implants, as well as in the bone. An important fac-tor for the success of a dental implant is the manner in which stresses are transferred to surrounding bone.
FEA allows investigators to predict stress distribution in the contact area of implants with cortical bone and around the apex of implants in spongy bone15).
In the model used in the present study, we made several hypotheses regarding the simulated structures. All structures
in the model were assumed to be homogeneous, isotropic, and to possess linear elasticity. Different properties of mate-rials were in the model of this study. Additionally, a implant-bone interface with 100% contact ratio was simulated, which does not necessarily simulate clinical situations38). Also, it is
important to note that the stress distribution patterns may be different depending on the materials and properties assigned to each layer of the model used in the experiments. Furthermore, the cement layer in prosthesis was not mod-eled. Thus, the inherent limitations in this study should be considered.
When applying FEA to dental implants, it is important to consider not only axial loads and horizontal forces (moment-causing loads) but also a combined load (oblique occlusal force), because the latter represents more realistic occlusal load pattern39).
The design of the occlusal surface of the model can
influ-Ⅳ
Fig. 7. Maximum von Mises stress values with centric vertical loads, lateral vertical loads and oblique loads in 0.5mm outer cortical thickness.
Seung-Hwan Youn et al: Three-Dimensional Finite Element Analysis of Stability in Proportion to Crown-to-Implant Ratio in the Different Maxillary Bone Conditions. Implantology 2008
ence the stress distribution pattern. In the present study, the area of the loading force was specifically applied to cusp tip and central fossa. However, the geometric form of the tooth surface can produce a pattern of stress distribution that is specific for the modeled form. The pattern could be different with even moderate changes to the occlusal surface of the crown. Although this occlusal form exists for this model, the same form would not represent all premolar teeth.
It was reported that the stress is concentrated in the neck of implant and is probably due to the rigid connection between the implant and bone. The elastic modulus of cortical bone is higher than spongy bone, and for this reason cortical bone is stronger and more resistant to deformation40,41,42).
As a result of 3-D finite element analysis, there was no dif-ference according to crown-to-root ratio in case that vertical loading was on palatal cusp and central fossa. There were small variations according to crown-to-implant ratio. However, in case of oblique loading on palatal cusp von Mises stress value increase directly in proportion to crown-to-implant ratio. For this result, it is thought that in vertical loading of central fossa and palatal cusp the quantity of bending moment is smaller than that of oblique loading. And the greater the crown’s length is, the bigger bending moment in oblique loading is.
Bending moment could cause a tensile force that is thought to be harmful to implants.
This is in agreement with the findings of Mische et al.26)
who stated that the greater the crown height, the greater the moment force or lever arm with any lateral force and as the crown-implant ratio increases, the number of implants and/or wider implants should be inserted to counteract the increase in stress.
This also corroborated the findings of Papavasiliou et al.,18)
who found the highest stresses were concentrated in the cor-tical bone and stresses under oblique loading were approxi-mately 10 times greater than under axial loading. The pre-sent findings support the theoretical analysis by Rangert et al.43) of forces and moments on implants. It suggested that
the axial force was more favorable, because it distributed stress more evenly throughout the implant. This supported the findings of Block et al.,44)who demonstrated that the
amount of bone directly in contact with the apical surface of a loaded implants was much less than that surrounding the remainder of the implant.
In addition, according to bone quantities, the difference in stress value appeared to be great.
In model with 0.5mm outer cortical bone, average stress value is 20.5MPa when vertical loading on central fossa of crown in normal group. In atrophic group with 5mm cancel-lous bone, average stress value is 68.6MPa which is three times as great as normal group. In grafted bone, average stress values are 37.2MPa when grafted bone quality is good. However, in case of bad quality, its value is 59.3MPa.
This corroborated the statement of Smet et al.45)that
sig-nificant marginal bone loss is observed around implants (Brånemark system) when excessive load is present. Moreover, Quirynen et al.46) observed a clear correlation between excessive marginal bone loss (> 1 mm) after the first year of load and implant loss with occlusal overload, but not with marginal gingivitis.
Meyer et al.12)stated that implant-transmitted overloading
to bone seems to depend mainly on bone quality. The amount of crestal height plays another but more minor role in the effects of stress and strains under mechanical loading.
In case of oblique loading, the stress value of grafted bone of atrophic maxilla is lower than that of normal group. It is
thought to be due to double cortical layer effect that inner cortical layer supports implants once more if grafted bone quality is not bad.
On the contrary, if grafted bone quality is bad, high von Mises stress value could exist. Even though grafted bone quality is bad, it’s stress value is lower than that of atrophic maxillary bone.
In present study, we classified model into two sub group according to grafted bone qualities. Moreover, because a variety of bone quality , we referred to Brodt et al.37)and
assumed two grafted bone qualities.
The stress was concentrated in the neck of implant as shown in Figure VI. Koca et al.11)stated that it was probably
due to the rigid connection between the implant and bone. According to the results of the present study, it is suggested that crown-to-implant ratio is directly in proportion to stress of cortical crestal regions.
Hereafter, further research what the variations of fixture length cause in relation to crown-to-root ratio and in case of severe bone resorption, the analysis that onlay bone graft or not for altering crown-to-root ratio are thought to be needed. How to apply this crown-to-root ratio to clinical situation such as implant surgery and prosthesis is thought to be important. In addition to crown-to-root ratio, the surface area of implants should be considered important factor. Thus fur-ther research about relationship between crown-to-root ratio and implant design is need to be thought.
Within the limitations of this study, the following
conclu-sions were drawn:
1. In cases of centric vertical loading and lateral vertical loading on implant, there were normal group, grafted bone (A) group, grafted bone (B) group and atrophic group in low stress value order. And there were no pro-gression of von Mises stress values according to crown-to-implant ratio.
2. In cases of oblique loading on implant, there were graft-ed bone (A) group, normal group, graftgraft-ed bone (B) group and atrophic group in low stress value order. Grafted bone (A) group showed lower von Mises stress values than normal group. And von Mises stress values increased in proportion to the crown-to-implant ratio. 3. Von Mises stress values in oblique loading showed three
times to nine times higher than that in central loading. 4. The maximum von Mises stress value was localized on
the palatal cortex.
In conclusion, in cases of centric vertical loading and later-al verticlater-al loading on implant, there were no progressions of von Mises stress values according to crown-to-implant ratio and in case of oblique loading on implants, von Mises stress increased in proportion to the crown-to-implant ratio. The maximum stress was localized on the palatal cortex for all levels of bone.
1. Jemt T, Lekholm U, Oral implant treatment in posterior partially eden-tulous jaws: a 5-year follow-up report. Int J Oral Maxillofac Implants, 1993. 8(6): 635-40.
2. Zarb GA, Schmitt A, The longitudinal clinical effectiveness of osseoin-tegrated dental implants in posterior partially edentulous patients. Int J
Prosthodont, 1993. 6(2): 189-96.
3. Knabe C, Hoffmeister B, The use of implant-supported ceramometal titanium prostheses following sinus lift and augmentation procedures: a clinical report. Int J Oral Maxillofac Implants, 1998. 13(1): 102-8. 4. Misch CE, Maxillary sinus augmentation for endosteal implants:
orga-nized alternative treatment plans. Int J Oral Implantol, 1987. 4(2): 49-58. 5. Winter AA, Pollack AS, Odrich RB, Placement of implants in the
severely atrophic posterior maxilla using localized management of the sinus floor: a preliminary study. Int J Oral Maxillofac Implants, 2002. 17(5): 687-95.
6. Tatum H, Jr., Maxillary and sinus implant reconstructions. Dent Clin North Am, 1986. 30(2): 207-29.
7. Boyne PJ, James RA, Grafting of the maxillary sinus floor with autoge-nous marrow and bone. J Oral Surg, 1980. 38(8): 613-6.
8. Ferrigno N, Laureti M, Fanali S et al., A long-term follow-up study of non-submerged ITI implants in the treatment of totally edentulous jaws. Part I: Ten-year life table analysis of a prospective multicenter study with 1286 implants. Clin Oral Implants Res, 2002. 13(3): 260-73. 9. Nedir R, Bischof M, Briaux JM et al., A 7-year life table analysis from a
prospective study on ITI implants with special emphasis on the use of short implants. Results from a private practice. Clin Oral Implants Res, 2004. 15(2): 150-7.
10. Griffin TJ, Cheung WS, The use of short, wide implants in posterior areas with reduced bone height: a retrospective investigation. J Prosthet Dent, 2004. 92(2): 139-44.
11. Koca OL, Eskitascioglu G,Usumez A, Three-dimensional finite-ele-ment analysis of functional stresses in different bone locations produced by implants placed in the maxillary posterior region of the sinus floor. J Prosthet Dent, 2005. 93(1): 38-44.
12. Meyer U, Vollmer D, Runte C et al., Bone loading pattern around implants in average and atrophic edentulous maxillae: a finite-element analysis. J Craniomaxillofac Surg, 2001. 29(2): 100-5.
13. Iplikcioglu H, Akca K, Comparative evaluation of the effect of diame-ter, length and number of implants supporting three-unit fixed partial prostheses on stress distribution in the bone. J Dent, 2002. 30(1): 41-6. 14. Himmlova L, Dostalova T, Kacovsky A et al., Influence of implant
length and diameter on stress distribution: a finite element analysis. J Prosthet Dent, 2004. 91(1): 20-5.
15. Geng JP, Tan KBLiu GR, Application of finite element analysis in implant dentistry: a review of the literature. J Prosthet Dent, 2001. 85(6): 585-98.
16. Simion M, Fontana F, Rasperini G et al., Long-term evaluation of
osseointegrated implants placed in sites augmented with sinus floor ele-vation associated with vertical ridge augmentation: a retrospective study of 38 consecutive implants with 1- to 7-year follow-up. Int J Periodontics Restorative Dent, 2004. 24(3): 208-21.
17. Lin S, Shi S, LeGeros RZ et al., Three-dimensional finite element analy-ses of four designs of a high-strength silicon nitride implant. Implant Dent, 2000. 9(1): 53-60.
18. Papavasiliou G, Kamposiora P, Bayne SC et al., Three-dimensional finite element analysis of stress-distribution around single tooth implants as a function of bony support, prosthesis type, and loading dur-ing function. J Prosthet Dent, 1996. 76(6): 633-40.
19. Penny RE, Kraal JH, Crown-to-root ratio: its significance in restorative dentistry. J Prosthet Dent, 1979. 42(1): 34-8.
20. IH. A, The fundamental principles of abutments. Mich Dent Soc Bull, 1926. 8: 14.
21. van Steenberghe D, Lekholm U, Bolender C et al., Applicability of osseointegrated oral implants in the rehabilitation of partial edentulism: a prospective multicenter study on 558 fixtures. Int J Oral Maxillofac Implants, 1990. 5(3): 272-81.
22. Naert I, Koutsikakis G, Duyck J et al., Biologic outcome of implant-supported restorations in the treatment of partial edentulism. part I: a longitudinal clinical evaluation. Clin Oral Implants Res, 2002. 13(4): 381-9.
23. Weng D, Jacobson Z, Tarnow D et al., A prospective multicenter clini-cal trial of 3i machined-surface implants: results after 6 years of follow-up. Int J Oral Maxillofac Implants, 2003. 18(3): 417-23.
24. Wyatt CC, Zarb GA, Treatment outcomes of patients with implant-sup-ported fixed partial prostheses. Int J Oral Maxillofac Implants, 1998. 13(2): 204-11.
25. Weiss CM WA, A Principles and Practice of Implant Dentistry. 2001, St.Louis: Mosby.
26. Misch CE, Contemporary Implant Dentistry. 1999, St.Louis: Mosby. 27. Holmes DC, Loftus JT, Influence of bone quality on stress distribution
for endosseous implants. J Oral Implantol, 1997. 23(3): 104-11. 28. Matsushita Y, Kitoh M, Mizuta K et al., Two-dimensional FEM
analy-sis of hydroxyapatite implants: diameter effects on stress distribution. J Oral Implantol, 1990. 16(1): 6-11.
29. Tada S, Stegaroiu R, Kitamura E et al., Influence of implant design and bone quality on stress/strain distribution in bone around implants: a 3-dimensional finite element analysis. Int J Oral Maxillofac Implants, 2003. 18(3): 357-68.
osseointe-gration percentages and patterns on implant-bone interfacial stresses. J Dent, 1997. 25(6): 485-91.
31. Sutpideler M, Eckert SE, Zobitz M et al., Finite element analysis of effect of prosthesis height, angle of force application, and implant offset on sup-porting bone. Int J Oral Maxillofac Implants, 2004. 19(6): 819-25. 32. Timoshenko S YD, Elements of strength of materials. 5th ed. 1968,
Florence: Wadsworth. 377.
33. Lewinstein I, Banks-Sills L, Eliasi R, Finite element analysis of a new system (IL) for supporting an implant-retained cantilever prosthesis. Int J Oral Maxillofac Implants, 1995. 10(3): 355-66.
34. Craig R, Reatorative dental materials. 8th ed. 1989, St. Louis (MO): Mosby. p.84.
35. Cook SD, Klawitter JJ, Weinstein AM, A model for the implant-bone interface characteristics of porous dental implants. J Dent Res, 1982. 61(8): 1006-9.
36. Farah JW, Craig RG, Meroueh KA, Finite element analysis of three-and four-unit bridges. J Oral Rehabil, 1989. 16(6): 603-11.
37. Brodt MD, Swan CC, Brown TD, Mechanical behavior of human morselized cancellous bone in triaxial compression testing. J Orthop Res, 1998. 16(1): 43-9.
38. Brunski JB, Puleo DA, Nanci A, Biomaterials and biomechanics of oral and maxillofacial implants: current status and future developments. Int J Oral Maxillofac Implants, 2000. 15(1): 15-46.
39. Holmgren EP, Seckinger RJ, Kilgren LM et al., Evaluating parameters of
osseointegrated dental implants using finite element analysis--a two-dimensional comparative study examining the effects of implant diameter, implant shape, and load direction. J Oral Implantol, 1998. 24(2): 80-8. 40. Gross MD, Nissan J, Stress distribution around maxillary implants in
anatomic photoelastic models of varying geometry. Part II. J Prosthet Dent, 2001. 85(5): 450-4.
41. Ichikawa T, Kanitani H, Wigianto R et al., Influence of bone quality on the stress distribution. An in vitro experiment. Clin Oral Implants Res, 1997. 8(1): 18-22.
42. Stegaroiu R, Sato T, Kusakari H et al., Influence of restoration type on stress distribution in bone around implants: a three-dimensional finite element analysis. Int J Oral Maxillofac Implants, 1998. 13(1): 82-90. 43. Rangert B, Jemt T, Jorneus L, Forces and moments on Branemark
implants. Int J Oral Maxillofac Implants, 1989. 4(3): 241-7.
44. Block MS, Finger IM, Fontenot MG et al., Loaded hydroxylapatite-coated and grit-blasted titanium implants in dogs. Int J Oral Maxillofac Implants, 1989. 4(3): 219-25.
45. De Smet E, van Steenberghe D, Quirynen M et al., The influence of plaque and/or excessive loading on marginal soft and hard tissue reac-tions around Branemark implants: a review of literature and experience. Int J Periodontics Restorative Dent, 2001. 21(4): 381-93.
46. Quirynen M, Naert Ivan Steenberghe D, Fixture design and overload influence marginal bone loss and fixture success in the Branemark sys-tem. Clin Oral Implants Res, 1992. 3(3): 104-11.
Corresponding author: Seong-Ho Choi
Department of Periodontology, Research Institute for Periodontal Regeneration, College of Dentistry, Yonsei University
Seodaemun-Gu Shinchon-Dong 134,Seoul, Korea Email: [email protected]
Received 2 October 2008 Accepted 5 November 2008