저작자표시-비영리-변경금지 2.0 대한민국 이용자는 아래의 조건을 따르는 경우에 한하여 자유롭게 l 이 저작물을 복제, 배포, 전송, 전시, 공연 및 방송할 수 있습니다. 다음과 같은 조건을 따라야 합니다: l 귀하는, 이 저작물의 재이용이나 배포의 경우, 이 저작물에 적용된 이용허락조건 을 명확하게 나타내어야 합니다. l 저작권자로부터 별도의 허가를 받으면 이러한 조건들은 적용되지 않습니다. 저작권법에 따른 이용자의 권리는 위의 내용에 의하여 영향을 받지 않습니다. 이것은 이용허락규약(Legal Code)을 이해하기 쉽게 요약한 것입니다. Disclaimer 저작자표시. 귀하는 원저작자를 표시하여야 합니다. 비영리. 귀하는 이 저작물을 영리 목적으로 이용할 수 없습니다. 변경금지. 귀하는 이 저작물을 개작, 변형 또는 가공할 수 없습니다.
A master dissertation
Potential predictors of peak aerobic
capacity in subacute stroke patients
Department of medicine
Graduate school
Jeju national university
December
, 2016
아급성기 뇌졸중 환자에서 최대
유산소 능력의 잠재적 예측 인자
지도교수 한 은 영
김 지 현
이 논문을 의학 석사학위 논문으로 제출함
2016 년 12 월
김지현의 의학 석사학위 논문을 인준함
심사위원장 印
위 원 印
위 원 印
제주대학교 일반대학원
2016 년 12 월
Potential predictors of peak aerobic
capacity in subacute stroke patients
Ji-Hyun Kim
(Supervised by professor Eun-Young Han)
A thesis submitted in partial fulfillment of the requirement
for the degree of Master of Science
2016.12.
This thesis has been examined and approved.
Department of medicine
GRADUATE SCHOOL
JEJU NATIONAL UNIVERSITY
I
ABSTRACT
Potential predictors of peak aerobic capacity
in subacute stroke patients
Ji-Hyun Kim
Department of medicine
GRADUATE SCHOOL
JEJU NATIONAL UNIVERSITY
Supervised by professor Eun Young Han
Objective: To investigate the potential predictors of peak aerobic capacity in subacute
stroke patients among body composition, balance function, walking capacity, and lower limb muscle strengths, and to compare the clinical functional outcomes with respect to balance function and gender.
II
Methods: This study was a descriptive, observational, cross-sectional study. Eighty-three
subacute stroke patients were enrolled in the study (47 males and 36 females; mean age: 62.95 ± 13.9 years). Gait capacity was assessed by gait velocity (10 m walk velocity: 10MWV) and gait endurance (6 minute walk distance: 6MWD). Balance function was evaluated with the Korean version of the Berg Balance Scale (K-BBS). The isometric muscle strengths of bilateral knee flexors and extensors were measured with an isokinetic dynamometer. Cardiovascular fitness was evaluated with an expired gas analyzer. Body composition was measured with a bioelectrical impedance analysis device. We attempted to identify the major determinants of peak aerobic capacity in subacute stroke patients and to compare clinical functional outcomes with respect to balance function and gender.
Results: In backward linear regression analyses, paretic isometric extensor strength (𝑝 < 0.001), fat mass (𝑝 = 0.005), and 10MWV (𝑝 < 0.001) were independent predictors of peak aerobic capacity (adjusted R2 = 0.449) in all patients. In addition, VO2peak, K-BBS,
10MWV, 6MWD, and paretic knee extensor and flexor strength significantly differed between the dependent and independent ambulatory groups (𝑝 < 0.05). Muscle mass, both knee extensor and flexor strength, and VO2peak significantly differed between males and
females (𝑝 < 0.05).
Conclusions: Our results confirmed that paretic knee extensor strength, gait velocity, and
fat mass were major determinants of peak aerobic capacity in subacute stroke patients. Therefore, therapeutic approaches should focus on improving gait velocity and paretic knee extensor strength and on managing fat mass in the early stages of recovery from stroke.
Keywords: cardiorespiratory fitness, muscle strength, body composition,
walking speed, stroke
III
CONTENTS
ABSTRACT ……….Ⅰ
CONTENTS ………...Ⅲ
LIST OF TABLES ………..Ⅴ
LIST OF FIGURES ………Ⅵ
LIST OF ABBREVIATIONS ………...Ⅶ
Ⅰ. INTRODUCTION ………...1
Ⅱ. METHODS ………...3
1. Participants
2. Bioelectrical impedance analysis and anthropometric measurements
3. Measurements of physical performance
4. Statistical analysis
Ⅲ. RESULTS ……….9
1. Baseline demographic and stroke-related data
2. Gait, balance, knee muscle strength, and cardiovascular fitness
3. Relationships between cardiovascular fitness, knee muscle strength,
gait performance, balance function, body composition, and predictors
of peak aerobic capacity
4. Functions of gait, balance, knee muscle strength, and cardiovascular fitness
between the dependent ambulatory and independent ambulatory groups
IV
cardiovascular fitness according to gender
Ⅳ. DISCUSSION ………....21
Ⅴ. STRENGTHS AND LIMITATION ………...24
Ⅵ. CONCLUSION ……….25
Ⅶ. REFERENCES ……….26
Ⅷ. ABSTRACT IN KOREAN ………..32
V
LIST OF TABLES
Table 1. Demographic and disease-related characteristics of the subjects (
𝑁 = 83)
Table 2.
The results of cardiovascular fitness, balance function, gait, knee muscle strengths (𝑁=83)Table 3. Correlation among VO
2peak, body composition, knee muscle strength,
6MWD, 10MWV and BBS
Table 4. Backward linear regression models of VO
2peakfor all subjects (𝑁=83)
Table 5. Comparison of the general characteristics, gait function, cardiovascular
fitness, and knee muscle strength according to balance
Table 6. Comparison of the body composition, gait function, cardiovascular
fitness, and knee muscle strength according to gender
VI
LIST OF FIGURES
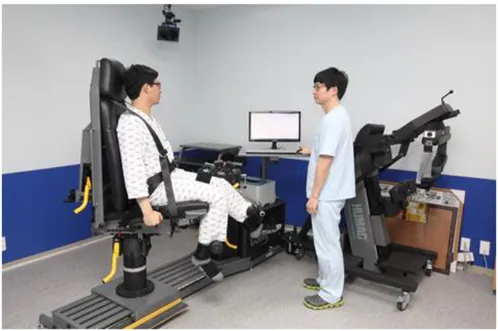
Figure 1. The figure shows Muscle isometric strength test with an isokinetic
dynamometer testFigure 2(A). Correlation between VO
2peakand Muscle mass
Figure 2(B). Correlation between VO
2peakand Fat mass
Figure 2(C). Correlation between VO
2peakand Paretic knee extensor strength
Figure 2(D). Correlation between VO
2peakand Non-paretic knee extensor strength
Figure 2(E). Correlation between VO
2peakand Paretic knee flexor strength
Figure 2(F). Correlation between VO
2peakand Non-paretic knee flexor strength
Figure 2(G). Correlation between VO
2peakand 6MWD
Figure 2(H). Correlation between VO
2peakand 10MWV
VII
LIST OF ABBREVIATIONS
BMI: body mass index
VO
2peak: peak oxygen consumption
RPP: rate pressure product
RSBP: peak systolic pressure
RDBP: peak diastolic pressure
PSBP: peak systolic pressure
PDBP: peak diastolic pressure
RHR: resting heart rate
PHR: peak heart rate
ETT duration: exercise treadmill testing time
RER: respiratory exchange ratio
BBS: berg balance scale
K-BBS: korean version of the berg balance scale
10MWV: 10-meter walk velocity
6MWD: 6-minute walk distance.
Watt: 1 joule per second.
1
Ⅰ. INTRODUCTION
Stroke is one of the most common causes of death and, in survivors, often induces chronic residual deficits that impair walking ability and the basic activities of daily living (ADL) [1]. Thus, the goals of stroke rehabilitation therapy at the subacute stage are to enhance locomotion and basic ADL skills [2]. Although 60–70% of subacute stroke patients can walk independently at discharge [3], only 7% of stroke patients have sufficient capacity to maintain an independent gait in the community [3,4]. The barriers to community ambulation are related to persistent functional deficits such as muscle weakness, poor balance, and reduced mobility, which result in decreased physical activity and cardiorespiratory fitness [1,5,6]. Because cardiorespiratory fitness is significantly associated with baseline status and recovery of functional outcomes at the subacute stage [7], the reduced aerobic capacity might contribute to poor rehabilitation outcomes [8-11] and exacerbate metabolic risk factors for recurrence of stroke, such as hypertension, obesity, and diabetes [7,12]. In addition, several studies have reported an association between body composition and cardiorespiratory fitness [13-15]. However, few studies in subacute stroke patients have comprehensively examined body composition and clinical functional outcomes including gait performance, muscle strength, balance function, and cardiorespiratory fitness.
In particular, balance dysfunction is an important factor in gait problems and physical deconditioning in stroke patients [16]. The Berg Balance Scale (BBS) is a reliable and valid tool for assessing individual balance function in those with stroke [17,18]. Lee et al. suggested 34 points as the cutoff value for independent ambulatory function in the Korean version of the BBS (K-BBS) [19]. However, although the K-BBS is commonly used to evaluate balance function in stroke patients, comparisons between balance
2
function and body composition, clinical functional outcomes, and cardiovascular fitness in subacute stroke patients have not been conducted [20].
Therefore, the objectives of this study were to assess the major determinants of peak aerobic capacity in subacute stroke patients among body composition, balance function, walking capacity, and lower limb muscle strengths, and to compare clinical functional outcomes with respect to balance function and gender.
3
Ⅱ. METHODS
Participants
Eighty-three patients from the Department of Physical Medicine & Rehabilitation were enrolled for this study between October 2014 and July 2016. Patients were all in the subacute stage (within 3 months of stroke onset) and had experienced their first-ever cerebral stroke involving cortical or subcortical areas. Lesions were confirmed through magnetic resonance imaging (MRI) or computed tomography (CT). The inclusion criteria were as follows: (1) Patient suffered a first-onset ischemic or hemorrhagic stroke as revealed by CT or MRI; (2) Stroke onset was within 3 months; (3) Patient presented with mild to moderate hemiparesis; (4) Patient was able to walk at least 3 m with or without a walking aid and without standby assistance. The exclusion criteria were as follows: (1) Patient had severe deficits in communication, memory, or understanding and could not follow instructions or communicate with the investigators; (2) Patient had cerebellar or brainstem lesions that may affect balance function; (3) Patient had any additional neurological or orthopedic disease causing motor deficits, such as fractures, degenerative joint changes, or clinical instability of the hip or knee joint; (4) Patient had psychiatric problems or unstable cardiorespiratory disease; (5) Patient had contraindication of maximal exercise testing, as defined by the American College of Sports Medicine (ACSM) [21].
Medical history, physical and neurological examinations, and body composition were reviewed retrospectively for all patients.
4
Bioelectrical impedance analysis and anthropometric measurements
Body weight, fat mass, and muscle mass were measured with a bioelectrical impedance analysis (BIA) device (InBody520®, Biospace Co. Ltd, Seoul, Korea). The test was performed with the subject standing on the machine platform and gripping an eight-point tactile electrode system. The machine measures 15 impedance values in five body segments at three different frequencies (5 kHz, 50 kHz, and 500 kHz). Detectable electrical signals are passed through the body, and segmental composition is measured from the impedance generated by different body tissues [22]. Height (cm) was also measured, and the body mass index (BMI) (weight (kg) / height (m)2) was then calculated.
Measurements of physical performance
Cardiovascular fitness: symptom-limited exercise tolerance test
Subjects underwent a symptom-limited exercise tolerance test (ETT) using a calibrated motorized treadmill (T-2100, GE Healthcare Inc., Chalfont St. Giles, UK) or a bicycle ergometer (Ergoselect 600K, Ergoline GmbH, Lindenstraße, Germany). The ETT was conducted in the presence of one physiatrist and one physical therapist. Patients were allowed to rest for 15 minutes in a seated position [23]. To select the fastest safe walking velocity, a zero-incline treadmill test was initiated at 0.5 mph and advanced slowly in 0.1 mph increments. For constant-velocity graded treadmill stress testing, patients walked on the treadmill at zero incline for the initial 2 minutes, followed by 2 minutes at a 4% incline, and then a 2% increase in incline every 2 minutes thereafter. Handrail support was minimally permitted, and a gait belt and supervision were provided as safety measures. The test was stopped if the patient asked or there was gait instability or signs of cardiovascular decompensation.
5
A bicycle ergometer test [24] was used for patients who could not perform the treadmill stress test. The bicycle ergometer test was performed at a rate of 50–60 revolutions per minute (rpm) with a workload of 10 W for the first 2 minutes. The workload was then increased by 5 W every 2 minutes. We decided whether the test was terminated prematurely according to the guidelines of the ACSM [21].
Peak exercise cardiovascular responses and maximal oxygen consumption (VO2max)
were assessed when at least two of the following five criteria for maximal effort were fulfilled: (1) a respiratory exchange ratio (RER) ≥ 1.0; (2) a plateau in VO2 (<150
mL/min) with an increase in exercise intensity; (3) no increase in heart rate (HR) after an increase in workload; (4) % HRpeak > 95% of age-predicted maximal HR; or (5) volitional
fatigue (a decline in cycling rate to < 30 rpm) [21,25]. If the criteria for maximal effort were not reached, the peak parameter values were used. The parameters measured were peak oxygen consumption (VO2peak), resting/peak heart rate (RHR/PHR), resting/peak
blood pressure (RBP/PBP), ETT duration, RER peak, and peak rate pressure product (RPPpeak). RPPpeak was calculated as HRpeak × systolic BPpeak/100, and %PHR was
calculated as the percentage (%) of the age-predicted maximal HR [PHR/(220 – age)×100] [21].
Muscle isometric strength test: knee flexor and extensor strength
Maximal isometric strength (torque) in the bilateral knee extensors was measured with an isokinetic dynamometer (HUMAC NORM, CSMI, Stoughton, MA, USA) while subjects were seated on a specially designed chair with hip angles at approximately 85° [26]. The distal shin pad of the dynamometer was fixed 2–3 cm above the lateral malleolus with a strap. To reduce inappropriate trunk mobility during thigh muscle contractions, straps were used across the chest, pelvis, and mid-thigh. The alignment
6
between the dynamometer rotational axis and the knee joint rotational axis (lateral femoral epicondyle) was adjusted at the start of each trial.
Gravity effect torque was recorded for each subject and used to correct torque measurements during all tests. Participants were asked to grasp sidebars during the testing procedure. The length of the moving arm measured from the lateral femoral epicondyle to the center of the force transducer at the shin was kept constant. Data were obtained from the digitized signals. After a structured warm up with the knee joint fixed at an angle of 60° flexion for maximal isometric force generation [27],
subjects were asked to
perform maximal voluntary contractions until the increase in torque was lower
than 5% for three successive attempts. Knee extension and flexion were carried
out discretely in a single direction (non-reciprocal). Each contraction was
maintained for 4 to 5 seconds separated by 2 minutes of rest. During each attempt,
subjects were loudly encouraged to achieve maximal performance. After 5
minutes of rest, the procedure was repeated with the other lower limb.
Figure 1. The figure shows the
muscle isometric strength test with an isokinetic dynamometer7 Gait performance
Gait performance was assessed by gait velocity (10 meter walk velocity: 10MWV) and gait endurance (6 minute walk distance: 6MWD). For 10MWV, subjects were instructed to walk 10 m at a comfortable but fastest possible safe pace without verbal encouragement. Time (s) was recorded using a stopwatch. Self-selected and fastest gait velocities (m/s) were calculated from the time taken to walk the 10 m track. For 6MWD, subjects were guided to walk as far as possible during 6 minutes, while walking through a 50 m hallway indicated with lines.
Balance function: BBS
Balance function was evaluated using the BBS [28]. The BBS measures a subject’s balance while performing functional tasks common in everyday life. In the BBS, each task is rated on a 5-point scale (0–4) with a maximal score of 56 indicating good balance [9,10]. The tasks progress from standing-up from a sitting position to tandem standing, and standing on one leg. Static and dynamic balance is assessed by tasks such as reaching, standing position, and transference. According to Lee et al., all patients were divided into two groups [19]: the independent ambulatory group (K-BBS ≥ 34) and dependent
ambulatory group (K-BBS < 34). ‘Independent ambulatory’ referred to patients able to achieve independent gait without any assistance.
8
Statistical analysis
Simple descriptive statistics were used to characterize the samples and the distribution of variables. Data are presented as mean ± standard deviation for continuous variables including age, fat mass, muscle mass, BMI, and stroke duration, and all parameters of clinical outcome and cardiopulmonary fitness.
Pearson’s correlation analysis was used to assess the relationships between clinical parameters and VO2peak. Multivariate linear regression analysis using a backward
selection linear regression model was employed to determine a significant predictor of cardiovascular fitness.
χ2
tests were used for categorical variables including lesion side and stroke type. The Student’s t-test was used to analyze intergroup differences in clinical outcome and cardiopulmonary fitness parameters according to balance function and gender.
All statistical analyses were performed using the SPSS statistical package ver. 18.0 (SPSS Inc., Chicago, IL, USA). A statistically significant difference was considered with a p-value of less than 0.05.
9
Ⅲ. RESULTS
Baseline demographic and stroke-related data
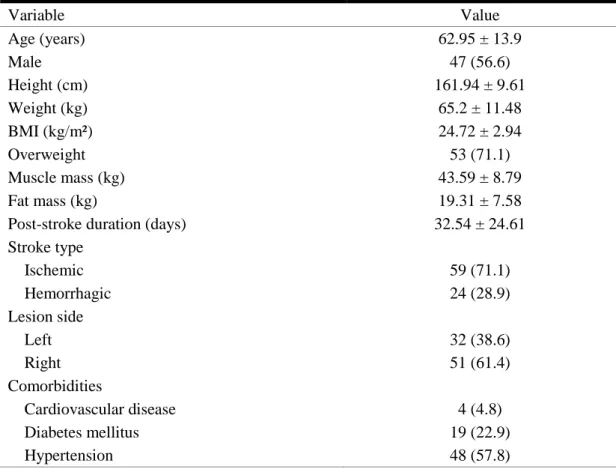
Baseline demographic and stroke-related data are presented in Table 1. The average age was 62.95 ± 13.9 years, and the average post-stroke duration was 32.54 ± 24.61 days.
Table 1. Demographic and disease-related characteristics of the subjects (𝑁=83)
Variable Value Age (years) 62.95 ± 13.9 Male 47 (56.6) Height (cm) 161.94 ± 9.61 Weight (kg) 65.2 ± 11.48 BMI (kg/m²) 24.72 ± 2.94 Overweight 53 (71.1) Muscle mass (kg) 43.59 ± 8.79 Fat mass (kg) 19.31 ± 7.58
Post-stroke duration (days) 32.54 ± 24.61
Stroke type Ischemic 59 (71.1) Hemorrhagic 24 (28.9) Lesion side Left 32 (38.6) Right 51 (61.4) Comorbidities Cardiovascular disease 4 (4.8) Diabetes mellitus 19 (22.9) Hypertension 48 (57.8)
Values represent mean ± standard deviation or number (%). N: number, BMI: body mass index.
10
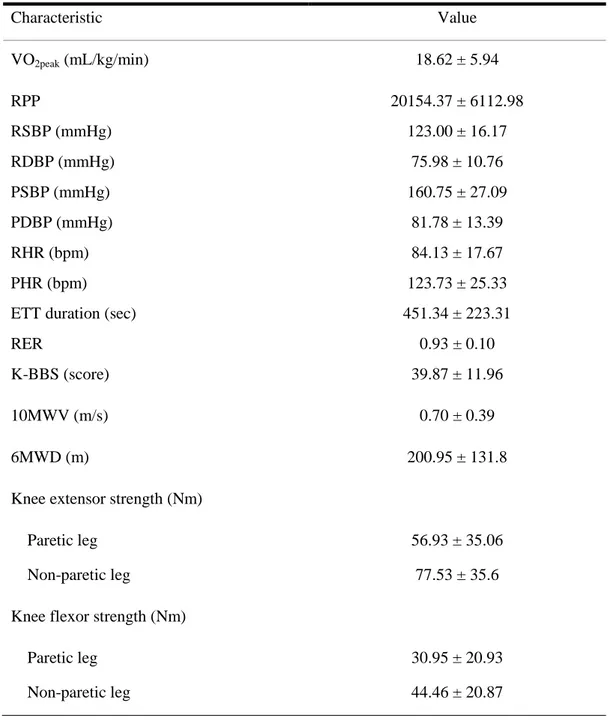
Gait, balance, knee muscle strength, and cardiovascular fitness
Results for gait, balance, knee muscle strengths, and cardiovascular fitness for all patients are presented in Table 2. Meanvalues were as follows: VO2peak (18.62 ± 5.94
mL/kg/min); K-BBS (39.87 ± 11.96); 10MWV (0.7 ± 0.39 m/s); 6MWD (200.95 ± 131.8 m); paretic and non-paretic knee extensor strength (56.93 ± 35.06 and 77.53 ± 35.6 Nm); paretic and non-paretic knee flexor strength (30.95 ± 20.93 and 44.46 ± 20.87 Nm).
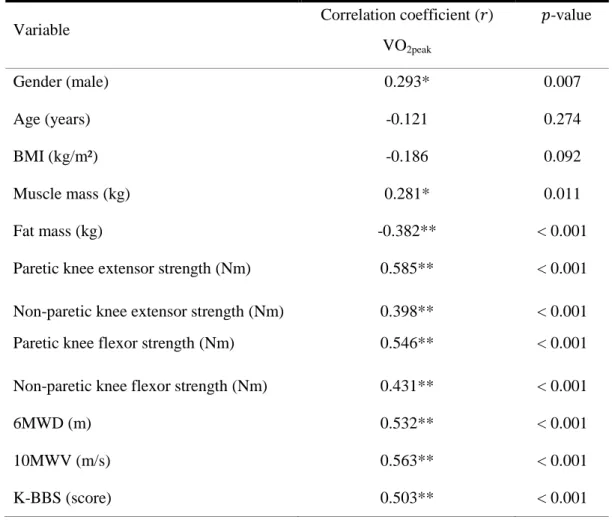
Relationships between cardiovascular fitness, knee muscle strengths, gait performance, balance function, body composition, and predictors of peak aerobic capacity
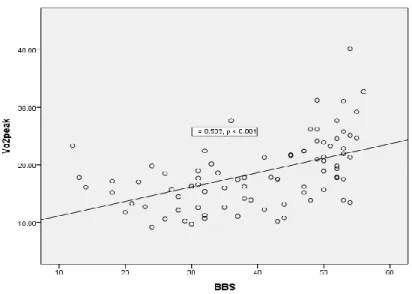
Peak aerobic capacity correlated significantly with male gender (𝑟 = 0.293, 𝑝 = 0.007), muscle mass (r = 0.281, p = 0.011), fat mass (r = –0.382, 𝑝 < 0.001), paretic knee extensor strength (𝑟 = 0.585, 𝑝 < 0.001), non-paretic knee extensor strength (𝑟 = 0.398, 𝑝 < 0.001), paretic knee flexor strength (𝑟 = 0.546, 𝑝 < 0.001), non-paretic knee flexor strength (𝑟 = 0.431, 𝑝 < 0.001), 6MWD (𝑟 = 0.532, 𝑝 < 0.001), 10MWV (𝑟 = 0.563, 𝑝 < 0.001), and K-BBS (𝑟 = 0.503, 𝑝 < 0.001) (Table 3; Figure 2(A)–(I)).
11
Table 2. The results of baseline evaluation of cardiovascular fitness, balance function,
gait, and knee muscle strengths (𝑁=83)
Characteristic Value VO2peak (mL/kg/min) 18.62 ± 5.94 RPP RSBP (mmHg) RDBP (mmHg) PSBP (mmHg) PDBP (mmHg) RHR (bpm) PHR (bpm) ETT duration (sec) RER K-BBS (score) 20154.37 ± 6112.98 123.00 ± 16.17 75.98 ± 10.76 160.75 ± 27.09 81.78 ± 13.39 84.13 ± 17.67 123.73 ± 25.33 451.34 ± 223.31 0.93 ± 0.10 39.87 ± 11.96 10MWV (m/s) 0.70 ± 0.39 6MWD (m) 200.95 ± 131.8
Knee extensor strength (Nm)
Paretic leg 56.93 ± 35.06
Non-paretic leg 77.53 ± 35.6
Knee flexor strength (Nm)
Paretic leg 30.95 ± 20.93
Non-paretic leg 44.46 ± 20.87
Values represent mean ± standard deviation
N: number, VO2peak: peak oxygen consumption, RPP: rate pressure product, RSBP: peak
systolic pressure, RDBP: peak diastolic pressure, PSBP: peak systolic pressure, PDBP: peak diastolic pressure, RHR: resting heart rate, PHR: peak heart rate, bpm: beats per minute, ETT duration: exercise treadmill testing time, RER: respiratory exchange ratio, K-BBS: Korean version of the Berg Balance Scale, 10MWV: 10-meter walk velocity, 6MWD: 6-minute walk distance, m/s: meter/second, m: meter, Nm: newton meter.
12
Table 3. Correlation between VO2peak and body composition, knee muscle strengths,
6MWD, 10MWV, and K-BBS
Variable Correlation coefficient (𝑟)
VO2peak 𝑝-value Gender (male) 0.293* 0.007 Age (years) -0.121 0.274 BMI (kg/m²) -0.186 0.092 Muscle mass (kg) 0.281* 0.011 Fat mass (kg) -0.382** < 0.001
Paretic knee extensor strength (Nm) 0.585** < 0.001
Non-paretic knee extensor strength (Nm) 0.398** < 0.001
Paretic knee flexor strength (Nm) 0.546** < 0.001
Non-paretic knee flexor strength (Nm) 0.431** < 0.001
6MWD (m) 0.532** < 0.001
10MWV (m/s) 0.563** < 0.001
K-BBS (score) 0.503** < 0.001
*𝑝 < 0.05, **𝑝 < 0.001.
BMI: body mass index, 10MWV: 10-meter walk velocity, 6MWD: 6-minute walk distance, VO2peak: peak oxygen consumption, K-BBS: Korean version of the Berg
13
Figure 2(A). Correlation between VO2peak and Muscle mass
14
Figure 2(C). Correlation between VO2peak and Paretic knee extensor strength
15
Figure 2(E). Correlation between VO2peak and Paretic knee flexor strength
16
Figure 2(G). Correlation between VO2peak and 6MWD
17
Figure 2(I). Correlation between VO2peak and BBS
In the backward linear regression analyses, paretic isometric extensor strength (𝑝 < 0.001), fat mass (𝑝 = 0.005), and 10MWV (𝑝 < 0.001) were independent predictors of peak aerobic capacity (adjusted R2 = 0.449) in all patients (Table 4).
Table 4. Backward linear regression models of VO2peak for all subjects (𝑁=83)
Variable Adjusted R² 𝑝-value
All subjects
Paretic knee extensor strength Fat mass 0.449 0.449 < 0.001** 0.005* 10MWV 0.449 < 0.001** *𝑝 < 0.05, **𝑝 < 0.001.
18
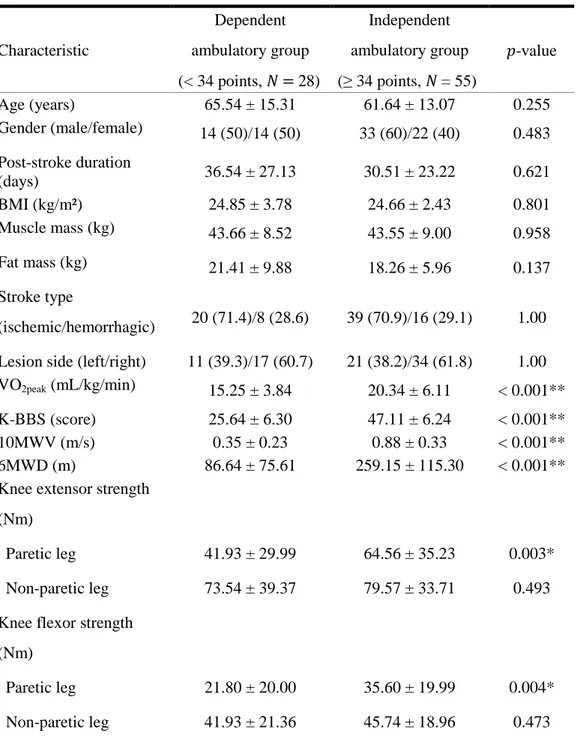
Comparisons of functions of gait, balance, knee muscle strengths, and cardiovascular fitness between the dependent ambulatory and independent ambulatory groups
Clinical characteristics including gait, balance, knee muscle strengths, and cardiovascular fitness parameters are compared between the two groups in Table 5. VO2peak, K-BBS, 10MWV, 6MWD, and paretic knee extensor and flexor strength showed
significant differences (𝑝 < 0.05) between the dependent ambulatory group and the independent ambulatory group (Table 5).
For 10MWV, the mean velocities were 0.35 ± 0.23 m/s for the dependent ambulatory group and 0.88 ± 0.33 m/s for the independent ambulatory group. For 6MWD, the mean distances were 86.64 ± 75.61 m for the dependent ambulatory group and 259.15 ± 115.30 m for the independent ambulatory group. Mean K-BBS scores were 25.64 ± 6.30 for the dependent ambulatory group and 47.11 ± 6.24 for the independent ambulatory group. For cardiovascular fitness, the mean VO2peak was 15.25 ± 3.84 mL/kg/min for the dependent
ambulatory group and 20.34 ± 6.11 mL/kg/min for the independent ambulatory group. Mean torques of the paretic and non-paretic knee extensors in the dependent ambulatory group were 41.93 ± 29.99 and 73.54 ± 39.37 Nm, respectively. For the independent ambulatory group, the corresponding values were 64.56 ± 35.23 and 79.57 ± 33.71 Nm. Mean torques of the paretic and non-paretic knee flexors in the dependent ambulatory group were 21.80 ± 20.00 and 41.93 ± 21.36 Nm, respectively. For the independent ambulatory group, the corresponding values were 35.60 ± 19.99 and 45.74 ± 18.96 Nm.
19
Table 5. Comparison of general characteristics, gait function, cardiovascular fitness, and
knee muscle strengths between the dependent and independent ambulatory groups
Characteristic Dependent ambulatory group (< 34 points, 𝑁 = 28) Independent ambulatory group (≥ 34 points, 𝑁 = 55) 𝑝-value Age (years) 65.54 ± 15.31 61.64 ± 13.07 0.255 Gender (male/female) 14 (50)/14 (50) 33 (60)/22 (40) 0.483 Post-stroke duration (days) 36.54 ± 27.13 30.51 ± 23.22 0.621 BMI (kg/m²) 24.85 ± 3.78 24.66 ± 2.43 0.801 Muscle mass (kg) 43.66 ± 8.52 43.55 ± 9.00 0.958 Fat mass (kg) 21.41 ± 9.88 18.26 ± 5.96 0.137 Stroke type (ischemic/hemorrhagic) 20 (71.4)/8 (28.6) 39 (70.9)/16 (29.1) 1.00 Lesion side (left/right) 11 (39.3)/17 (60.7) 21 (38.2)/34 (61.8) 1.00 VO2peak (mL/kg/min) 15.25 ± 3.84 20.34 ± 6.11 < 0.001**
K-BBS (score) 25.64 ± 6.30 47.11 ± 6.24 < 0.001**
10MWV (m/s) 0.35 ± 0.23 0.88 ± 0.33 < 0.001**
6MWD (m) 86.64 ± 75.61 259.15 ± 115.30 < 0.001**
Knee extensor strength (Nm)
Paretic leg 41.93 ± 29.99 64.56 ± 35.23 0.003*
Non-paretic leg 73.54 ± 39.37 79.57 ± 33.71 0.493
Knee flexor strength (Nm)
Paretic leg 21.80 ± 20.00 35.60 ± 19.99 0.004*
Non-paretic leg 41.93 ± 21.36 45.74 ± 18.96 0.473
Values represent mean ± standard deviation or number (%). *𝑝 < 0.05, **𝑝 < 0.001. N: number, BMI: body mass index, K-BBS: Korean version of the Berg Balance Scale, 10MWV: 10-meter walk velocity, 6MWD: 6-minute walk distance, VO2peak: peak oxygen
20
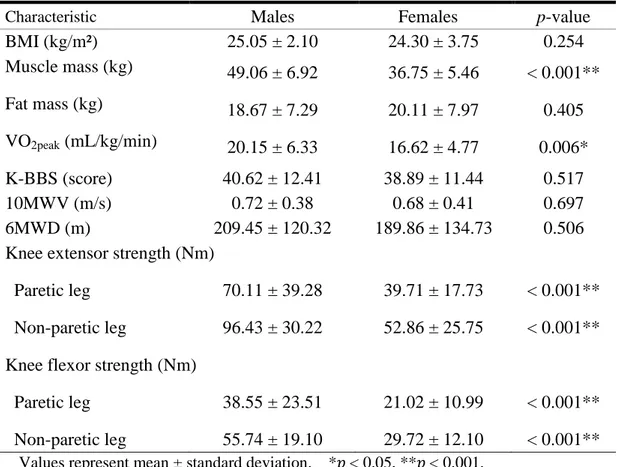
Comparisons of functions of gait, balance, knee muscle strengths, body composition, and cardiovascular fitness according to gender
Clinical characteristics including gait, balance, knee muscle strengths, body composition, and cardiovascular fitness parameters are compared between males and females in Table 6. Muscle mass, VO2peak, and bilateral isometric strength of both the
knee extensor and flexor significantly differed between males and females (𝑝 < 0.05). However, BMI, fat mass, function of gait, and K-BBS score did not significantly differ between the two genders (Table 6).
Table 6. Comparison of body composition, gait function, cardiovascular fitness,
and knee muscle strengths according to gender
Characteristic
Males
Females
p-value
BMI (kg/m²)
25.05 ± 2.10
24.30 ± 3.75
0.254
Muscle mass (kg)
49.06 ± 6.92
36.75 ± 5.46
< 0.001**
Fat mass (kg)
18.67 ± 7.29
20.11 ± 7.97
0.405
VO
2peak(mL/kg/min)
20.15 ± 6.33
16.62 ± 4.77
0.006*
K-BBS (score)
40.62 ± 12.41
38.89 ± 11.44
0.517
10MWV (m/s)
0.72 ± 0.38
0.68 ± 0.41
0.697
6MWD (m)
209.45 ± 120.32
189.86 ± 134.73
0.506
Knee extensor strength (Nm)
Paretic leg
70.11 ± 39.28
39.71 ± 17.73
< 0.001**
Non-paretic leg
96.43 ± 30.22
52.86 ± 25.75
< 0.001**
Knee flexor strength (Nm)
Paretic leg
38.55 ± 23.51
21.02 ± 10.99
< 0.001**
Non-paretic leg
55.74 ± 19.10
29.72 ± 12.10
< 0.001**
Values represent mean ± standard deviation. *𝑝 < 0.05, **𝑝 < 0.001.BMI: body mass index, VO2peak: peak oxygen consumption, K-BBS: Korean version of
the Berg Balance Scale, 10MWV: 10-meter walk velocity, 6MWD: 6-minute walk distance, m/s: meter/second, m: meter, Nm: newton meter.
21
Ⅳ. DISCUSSION
In this study, we comprehensively evaluated cardiovascular fitness, lower limb strengths, gait, and balance function in patients with subacute stroke and confirmed the close association of cardiorespiratory fitness with body composition and clinical functional outcomes.
Reduced aerobic fitness is common in subacute stroke patients [29], and the mean VO2peak is usually reported as 15.6–19.7 mL/kg/min [6,30]. The mean VO2peak of our
participants was 18.82 ± 5.94 mL/kg/min, which was comparable with previously reported values. Although few subjects met the criteria for maximal effort, they performed effectively in the symptom-limited exercise stress test, suggesting that the estimated values were reliable.
On the other hand, according to Kim et al. [7], light basic ADLs require approximately 3 metabolic equivalents (METs) (10.5 mL/kg/min) of oxygen consumption and more intense ADLs require about 5 METs (17.5 mL/kg/min). Thus, the aerobic capacity of our patients was insufficient to perform various activities in the community and we found that paretic knee extensor strength, gait speed, and fat mass were independent predictors of peak aerobic capacity in patients with subacute stroke.
Several studies revealed a close relationship between the peak aerobic capacity, gait
performance, and lower limb muscle strength [20,31]. In particular, gait endurance (6MWD) is strongly associated with VO2peak in mild stroke patients [20,32]. However,our data indicate that gait velocity rather than gait endurance predicts cardiovascular fitness. Walking speed can be considered an easy and accessible indicator of independent walking in the community [33]. Perry et al. found that gait velocity was highly related to different levels of ambulation [34]: household ambulation refers to a severe gait disorder with a walking velocity of less than 0.4 m/s; limited community and full community
22
ambulation indicate moderate to mild gait disorders with walking speeds greater than 0.4 m/s and 0.8 m/s, respectively. Another study reported that walking speed is potentially related to community ambulation, and a gait speed of 0.66 m/s could differentiate between community and non-community ambulatory groups of stroke patients [35]. Because reduced gait speed may increase the energy cost of walking [36], it may be a key determinant of peak exercise capacity in stroke patients.
Lower limb weakness occurs frequently in stroke survivors, especially in the quadriceps and hamstring, which induces several kinematic gait problems [37]. Our previous study [30] demonstrated that hemiparetic knee extensor strength is a predictor of gait endurance and that balance function is also a major determinant of gait speed and endurance in subacute stroke patients. During the stance phase of gait, the knee extensors support knee stability, thereby enabling the non-paretic limb to proceed in a swing phase during long-distance walking [38]. Furthermore, knee extensor weakness in stroke patients is caused by a reduction in recruitable motor units [39] and a diminished capacity for oxidative metabolism [39]. Thus, paretic lower limb strength is a strong predictor of gait function [40], and Suzuki et al. [41] reported that knee muscle strength is significantly related to walking performance in stroke patients. In this study, our findings also indicate that the peak torque of knee extensor strength is an independent predictor of cardiorespiratory fitness, and improving gait velocity and paretic leg extensor strength should be emphasized in patients with subacute stroke.
Furthermore, exercise capacity is dependent on the severity of disease and body composition [42,43]. Our anthropometric analysis revealed that body-fat mass was inversely related to maximal aerobic capacity, whereas muscle mass and BMI were positively correlated with peak aerobic capacity. Individuals with abnormally high body-fat levels or a body weight exceeding the standard measure are defined as overweight (BMI ≥ 23) or obese (BMI ≥ 25) [44]. Of our participants, 71.1% (𝑁 = 53) were
23
classed as overweight. Several studies have demonstrated a significant relationship between cardiorespiratory fitness and being overweight. Buchan et al. reported an independent association between cardiorespiratory fitness, waist circumference, and BMI [13], and Ortega et al. noted that cardiorespiratory fitness might have an effect on the association between being overweight and the level of physical activity [15]. These findings are consistent with the results of our present study.
Furthermore, there has been little research reporting the significant differences in
paretic knee extensor and flexor strength, gait speed, gait endurance, and peak
aerobic capacity according to balance function. The novel findings were that the
mean paretic knee extensor and flexor torques of the dependent ambulatory group
were approximately 50–60% compared with those of the non-paretic leg, while
the mean paretic knee extensor and flexor torques of the independent ambulatory
group were approximately 80% compared with those of the non-paretic leg.
Although the mean values were consistent with those published in previous
studies [30,45], we could not suggest baseline standard values due to the limited
sample size. Therefore, a further study is required to acquire baseline scientific
data and to determine a potential predictor according to balance function.
In addition,
this study compared functional clinical outcome, body composition, and peak aerobic capacity with respect to gender. The bilateral muscular strengths of knee extensors and flexors, muscle mass, and peak aerobic capacity significantly differed between males and females. Males commonly have a higher muscle mass than females, which results in increased muscle strengths [46] and aerobic capacity. The higher muscle mass is reported to be due to a greater capacity for muscular hypertrophy as a result of higher levels of testosterone in males [47].24
Ⅴ. STRENGTHS AND LIMITATION
Most previous studies have assessed gait function using gait speed or short-distance walking only, but we measured gait endurance and velocity, balance, body composition, and knee muscular strength comprehensively in a relatively large population of patients with subacute stroke. However, there are several limitations of this study. First, this was a retrospective cross-sectional study that focused on physical performance and we could not compare these parameters with those of healthy volunteers or confirm the long-term changes in clinical or cardiorespiratory parameters. Second, although various muscles such as those in the arm, hip, and ankle might affect gait performance, we only considered knee muscle strength because the paretic lower limb is mainly recovered in knee muscles soon after stroke, which is strongly correlated with gait function in patients with subacute stroke. Nevertheless, further studies should take various other muscles into account. Third, the participants of this study did not have cerebellum or brainstem lesions, which might disturb gait and balance function. A further study is warranted to assess the major clinical parameters according to the brain lesions. Finally, stroke patients with severe motor deficits who could not perform the ETT or gait performance tests were excluded from this study. Accordingly, this is a serious limitation for generalization of the findings to all stroke patients.
25
Ⅵ.
Conclusion
This study presents scientific evidence for a significant association between cardiovascular fitness and body composition, gait performance, knee muscle strengths, and balance function in subacute stroke patients. Moreover, our results show that gait speed, fat mass, and paretic knee extensor strength are major contributors to cardiovascular fitness in subacute stroke patients. Furthermore, there were significant differences in gait performance, aerobic capacity, and muscle strength of the paretic knee extensor and flexor with respect to balance function and in muscle mass, bilateral knee extensor and flexor strength, and aerobic capacity with respect to gender.
Therefore, therapeutic approaches should focus on improving gait velocity and paretic knee extensor strength, and on managing fat mass in the early stages of recovery from stroke.
26
Ⅶ. REFERENCES
1. Gresham GE, Fitzpatrick TE, Wolf PA, McNamara PM, Kannel WB, Dawber TR. Residual disability in survivors of stroke—the framingham study. N Engl J Med 1975;293:954-6.
2. Duncan PW, Gresham GE, Stason WB, Adams HP, Adelman AM, Alexander DN, et al. Post-stroke rehabilitation: Clinical practice guideline: Rockville: US department Health and Human services; 1995.
3. Hill K, Ellis P, Bernhardt J, Maggs P, Hull S. Balance and mobility outcomes for stroke patients: A comprehensive audit. 1997;43:173-80.
4. Goldie PA, Matyas TA, Evans OM. Deficit and change in gait velocity during rehabilitation after stroke. Arch Phys Med Rehabil 1996;77:1074-82.
5. Jorgensen HS, Nakayama H, Raaschou HO, Olsen TS. Stroke. neurologic and functional recovery the copenhagen stroke study. Phys Med Rehabil Clin N Am 1999;10:887-906.
6. Mayo NE, Wood-Dauphinee S, Ahmed S, Carron G, Higgins J, Mcewen S, et al. Disablement following stroke. Disabil Rehabil 1999;21:258-68.
7. Kim BR, Han EY, Joo SJ, Kim SY, Yoon HM. Cardiovascular fitness as a predictor of functional recovery in subacute stroke patients. Disabil Rehabil 2014;36:227-31.
8. Gillen G. Stroke rehabilitation: A function-based approach: Elsevier Health Sciences; 2015.
27
9. Steffen TM, Hacker TA, Mollinger L. Age- and gender-related test performance in community-dwelling elderly people: Six-minute walk test, berg balance scale, timed up & go test, and gait speeds. Phys Ther 2002;82:128-37.
10. Smith PS, Hembree JA, Thompson ME. Berg balance scale and functional reach: Determining the best clinical tool for individuals post acute stroke. Clin Rehabil 2004;18:811-8.
11. Potempa K, Lopez M, Braun LT, Szidon JP, Fogg L, Tincknell T. Physiological outcomes of aerobic exercise training in hemiparetic stroke patients. Stroke 1995;26:101-5.
12. Lee CD, Blair SN. Cardiorespiratory fitness and stroke mortality in men. Med Sci Sports Exerc 2002;34:592-5.
13. Buchan DS, Young JD, Boddy LM, Malina RM, Baker JS. Fitness and adiposity are independently associated with cardiometabolic risk in youth. Biomed Res Int
2013;2013:261698.
14. Fogelholm M, Stigman S, Huisman T, Metsämuuronen J. Physical fitness in
adolescents with normal weight and overweight. Scand J Med Sci Sports 2008;18:162-70.
15. Ortega FB, Artero EG, Ruiz JR, Vicente-Rodriguez G, Bergman P, Hagströmer M, et al. Reliability of health-related physical fitness tests in european adolescents. the
HELENA study. Int J Obes 2008;32:S49-57.
16. Michael KM, Allen JK, Macko RF. Reduced ambulatory activity after stroke: The role of balance, gait, and cardiovascular fitness. Arch Phys Med Rehabil 2005;86:1552-6.
28
17. Andersson Å , Kamwendo K, Seiger Å , Appelros P. How to identify potential fallers in a stroke unit: Validity indexes of 4 test methods. J Rehabil Med 2006;38:186-91.
18. Harris JE, Eng JJ, Marigold DS, Tokuno CD, Louis CL. Relationship of balance and mobility to fall incidence in people with chronic stroke. Phys Ther 2005;85:150-8.
19. Lee JJ, Lee HJ, Park JH, Han EY, Kim MJ, Jung HY. The korean version of berg balance scale as an index of activity related to ambulation in subjects with stroke. 2007;31:400-3.
20. Patterson SL, Forrester LW, Rodgers MM, Ryan AS, Ivey FM, Sorkin JD, et al. Determinants of walking function after stroke: Differences by deficit severity. Arch Phys Med Rehabil 2007;88:115-9.
21. Thompson W, Gordon NF, Pescatello L, American College of Sports Medicine. Guidelines for exercise testing and prescription. 2010.
22. Anderson LJ, Erceg DN, Schroeder ET. Utility of multifrequency bioelectrical impedance compared with dual-energy x-ray absorptiometry for assessment of total and regional body composition varies between men and women. Nutr Res 2012;32:479-85.
23. Macko RF, Katzel LI, Yataco A, Tretter LD, DeSouza CA, Dengel DR, et al. Low-velocity graded treadmill stress testing in hemiparetic stroke patients. Stroke
1997;28:988-92.
24. Pang MY, Eng JJ, Dawson AS. Relationship between ambulatory capacity and cardiorespiratory fitness in chronic stroke: Influence of stroke-specific impairments. 2005;127:495-501.
29
25. Howley ET, Bassett DR, Welch HG. Criteria for maximal oxygen uptake: Review and commentary. Med Sci Sports Exerc 1995;27:1292-301.
26. Maffiuletti NA, Bizzini M, Desbrosses K, Babault N, Munzinger U. Reliability of knee extension and flexion measurements using the Con‐Trex isokinetic dynamometer. 2007;27:346-53.
27. Thorstensson A, Karlsson J. Fatiguability and fibre composition of human skeletal muscle. Acta Physiol Scand 1976;98:318-22.
28. Berg K, Wood-Dauphine S, Williams J, Gayton D. Measuring balance in the elderly: Preliminary development of an instrument. 1989;41:304-11.
29. MacKay-Lyons MJ, Makrides L. Cardiovascular stress during a contemporary stroke rehabilitation program: Is the intensity adequate to induce a training effect? Arch Phys Med Rehabil 2002;83:1378-83.
30. Hyun CW, Han EY, Im SH, Choi JC, Kim BR, Yoon HM, et al. Hemiparetic knee extensor strength and balance function are predictors of ambulatory function in subacute stroke patients. 2015;39:577-85.
31. Kelly JO, Kilbreath SL, Davis GM, Zeman B, Raymond J. Cardiorespiratory fitness and walking ability in subacute stroke patients. Arch Phys Med Rehabil 2003;84:1780-5.
32. Baert I, Vanlandewijck Y, Feys H, Vanhees L, Beyens H, Daly D. Determinants of cardiorespiratory fitness at 3, 6 and 12 months poststroke. Disabil Rehabil 2012;34:1835-42.
33. Cesari M, Kritchevsky S, Newman A, Simonsick E, Harris T, Penninx B, et al. Health, aging and body composition study: Added value of physical performance measures in
30
predicting adverse health-related events: Results from the health, aging and body composition study. J Am Geriatr Soc 2009;57:251-9.
34. Perry J, Garrett M, Gronley JK, Mulroy SJ. Classification of walking handicap in the stroke population. Stroke 1995;26:982-9.
35. Van Kan GA, Rolland Y, Andrieu S, Bauer J, Beauchet O, Bonnefoy M, et al. Gait speed at usual pace as a predictor of adverse outcomes in community-dwelling older people an international academy on nutrition and aging (IANA) task force. J Nutr Health Aging 2009;13:881-9.
36. Ryan AS, Dobrovolny CL, Silver KH, Smith GV, Macko RF. Cardiovascular fitness after stroke: Role of muscle mass and gait deficit severity. 2000;9:185-91.
37. Moseley A, Wales A, Herbert R, Schurr K, Moore S. Observation and analysis of hemiplegic gait: Stance phase. 1993;39:259-67.
38. Perry J, Burnfield JM. Gait analysis: Normal and pathological function. 2th ed. USA: SLACK Incorporated; 2010. p. 1-576.
39. Potempa K, Braun LT, Tinknell T, Popovich J. Benefits of aerobic exercise after stroke. 1996;21:337-46.
40. Bohannon RW. Muscle strength and muscle training after stroke. J Rehabil Med 2007;39:14-20.
41. Suzuki K, Imada G, Iwaya T, Handa T, Kurogo H. Determinants and predictors of the maximum walking speed during computer-assisted gait training in hemiparetic stroke patients. Arch Phys Med Rehabil 1999;80:179-82.
31
42. Toth MJ, Gardner AW, Ades PA, Poehlman ET. Contribution of body composition and physical activity to age-related decline in peak VO2 in men and women. J Appl Physiol (1985) 1994;77:647-52.
43. Toth MJ, Gottlieb SS, Fisher ML, Poehlman ET. Skeletal muscle atrophy and peak oxygen consumption in heart failure. Am J Cardiol 1997;79:1267-9.
44. World Health Organization. The asia-pacific perspective: Redefining obesity and its treatment. 2000.
45. Combs SA, Van Puymbroeck M, Altenburger PA, Miller KK, Dierks TA, Schmid AA. Is walking faster or walking farther more important to persons with chronic stroke? Disabil Rehabil 2013;35:860-7.
32
Ⅷ. ABSTACT IN KOREAN
아급성기 뇌졸중 환자에서
최고
유산소 능력의
잠재적 예측 인자
김지현
제주대학교 일반대학원 의학과
지도교수 한은영
목적: 본 연구는 아급성기 뇌졸중 환자의 균형 기능에 따른 임상적 결과물들의 상관성을 조사하고, 뇌졸중 초기의 최대 유산소 능력의 잠재적 예측인자가 무엇인지를 알아보고자 하였다. 방법: 본 연구는 총 83 명 (평균 나이: 62.95 ± 13.9 세)의 아급성기 뇌졸중 환자가 모집되었다. 보행 능력은 보행 속도 (10 미터 걷기 속도: 10MWD)와 보행 지구력 (6 분 걷기 거리: 6MWD)을 사용하였고, 균형 기능은 한글판 버그균형검사 (K-BBS)로 평가하였다. 양측 무릎 폄 근 및 굽힘 근은 등운동성 동력계로 측정하였다. 심혈관계 체력은 호기가스분석기로 평가하였고, 신체 조성은 생체 전기 임피던스 분석 장비로 측정하였다. 결과: 후진 모델의 선형 회귀 분석에서, 모든 환자들에서 마비측 등척성 무릎 폄 근력 (𝑝 < 0.001), 체지방 (𝑝 = 0.005), 10 미터 걷기 속도 (𝑝 < 0.001)는 최대 유산소 능력의 독립적인 예후인자였다 (수정된 R 제곱 = 0.449). 또한 기능적 결과물에서 독립적 보행 여부에 따른 두 그룹 사이에 유의한 차이가 나타났다.33 결론: 우리의 연구 결과에서는 균형 기능에 따라서 마비측 폄 근력과 굽힘 근력, 보행 속도, 보행 지구력, 최대 유산소 능력에 유의한 차이가 있음이 나타났으며, 최대 유산소 능력의 중요한 결정인자는 마비측 무릎 폄 근력과 보행 속도, 체지방임을 알 수 있었다. 그러므로, 뇌졸중 초기 회복 단계에서의 치료적 접근은 보행 속도 향상과 마비측 무릎 폄 근력에 초점을 맞춰야 할 것으로 사료된다.
34
Ⅸ. APPENDICIES
Korean-version of Berg Balance Scale (K-BBS) 1. 앉은 상태에서 서기 <지시: 서 보세요. 이때 지지하기 위해 두 손을 사용하지 마십시오.> 4점: 손을 사용하지 않고 독립적으로 일어서고 안정화할 수 있다. 3점: 손을 사용하여 독립적으로 일어설 수 있다. 2점: 여러 번 시도 후 양 손을 사용하여 일어설 수 있다. 1점: 서거나 안정화되기 위해서 최소(25%)의 도움이 필요하다. 0점: 서기 위해서는 중등도 도움(50%) 또는 최대 도움(75%)이 필요하다. 2. 의지하지 않고 서 있기 <지시: 붙잡지 말고 2분 동안 서 있어 보세요.> 4점: 안전하게 2분 동안 서 있을 수 있다. 3점: 감독 하에 2분 동안 서 있을 수 있다. 2점: 의지하지 않고 30초간 서 있을 수 있다. 1점: 의지하지 않고 30초간 서 있기 위해 여러 번의 시도가 필요하다. 0점: 도움 없이는 30초간 서 있을 수 없다. *** 의지하지 않고 2분간 서 있을 수 있다면, 3번 항목은 검사하지 말고 3항목을 만점 처리하고, 4번 항목으로 가시오. 3. 기대지 않고 스스로 앉기 <지시: 두 팔에 의지하고 2분간 앉아 있으세요.> 4점: 안전하게 2분 동안 앉아 있을 수 있다. 3점: 감독 하에 2분 동안 앉아 있을 수 있다. 2점: 30초간 앉아 있을 수 있다. 1점: 10초간 앉아 있을 수 있다. 0점: 10초간 지지 없이 앉아 있을 수 없다. 4. 선 상태에서 앉기 <지시: 앉아보세요.> 4점: 양 손을 최소한으로 사용하여 안전하게 앉을 수 있다. 3점: 양 손을 사용하여 앉기 조절이 가능하다. 2점: 양다리를 의자에 기대어 앉기 조절이 가능하다. 1점: 독립적으로 앉지만 털썩 주저앉는다. 0점: 앉기에 도움이 필요하다. 5. 이동하기 <지시: 한쪽으로 이동할 수 있도록 의자를 배열해 놓는다. 팔걸이가 있는 의자로 가도록 환자에게 이동을 요구한다. 그리고 팔걸이가 없는 의자로 가도록 환자에게 이동을 요구한다(검사자는 팔걸이가 있는 의자 그리고 팔걸이가 없는 의자를 사용할 수도 있다.).> 4점: 양 손을 최소한으로 사용하여 안전하게 이동할 수 있다. 3점: 양 손을 적절히 사용하여 안전하게 이동할 수 있다.
35 2점: 구두지시나 또는 감독 하에 이동할 수 있다. 1점: 1명의 도움이 필요하다. 0점: 도움이나 안전을 위해 2명의 도움이 필요하다. 6. 눈감고 서 있기 <지시: 두 눈을 감고 10초 동안 서 있어 보세요.> 4점: 안전하게 10초간 서 있을 수 있다. 3점: 감독 하에 10초간 서 있을 수 있다. 2점: 3초간 서 있을 수 있다. 1점: 눈을 감은 채 3초간 유지하기가 어려우나 잠깐은 설 수 있다. 0점: 넘어지지 않으려면 도움이 필요하다. 7. 양 발 모으고 서 있기 <지시: 양 발을 모으고 잡지말고 서보세요.> 4점: 독립적으로 양 발을 모으고 안전하게 1분간 서 있을 수 있다. 3점: 독립적으로 양 발을 모으고 감독 하에 1분간 서 있을 수 있다. 2점: 독립적으로 양 발을 모으고 30초간 서 있을 수 있다. 1점: 자세 유지에 도움이 필요하지만 15초간 서 있을 수 있다. 0점: 자세 유지에 도움이 필요하고 15초간 서 있을 수 없다. 8. 선 자세에서 팔 펴고 뻗기 <지시: 팔을 90도로 올리시오. 손가락을 펴고 가능한 한 앞쪽으로 멀리 뻗어 보세요.(피검자가 팔을 90도로 들고 있는 동안 자를 손톱 끝에 놓는다. 손을 앞으로 뻗는 동안 자가 손가락에 닿지 않도록 한다. 측정된 거리는 손가락을 앞쪽으로 가장 멀리 뻗었을 때의 거리이다. 가능하면 몸통을 비틀어서 앞쪽으로 뻗지 못하도록 두 손을 모두 사용하여 뻗도록 한다.)> 4점: 25 cm (10 인치) 이상 앞으로 뻗을 수 있다. 3점: 12.5 cm (5 인치) 이상 안전하게 앞으로 뻗을 수 있다. 2점: 5 cm (2 인치) 이상 안전하게 앞으로 뻗을 수 있다. 1점: 앞으로 뻗을 수 있지만 감독이 필요하다. 0점: 시도하는 동안 균형을 잃고 외부의 도움이 필요하다. 9. 선 자세에서 바닥에서 물건 잡아 올리기 <지시: 피검사의 발 앞에 있는 신발/슬리퍼를 집어보세요.> 4점: 쉽고 안전하게 슬리퍼를 주울 수 있다. 3점: 슬리퍼를 주울 수 있지만 감독이 필요하다. 2점: 슬리퍼는 주울 수 없지만, 슬리퍼로부터 5 cm까지 접근할 수 있고, 독립적으로 균형을 유지할 수 있다. 1점: 시도하는 동안 도움이 필요하며 주울 수 없다. 0점: 시도할 수 없고 균형을 잃지 않고 넘어지지 않기 위해 도움이 필요하다. 10. 선 자세에서 양쪽 어깨를 넘어 뒤돌아보기 <지시: (선 자세에서) 좌측 어깨를 넘어 뒤를 돌아보세요. 우측 어깨를 넘어 뒤를 돌아보세요. 검사자는 피검자가 더 잘 뒤돌아볼 수 있도록 피검자 뒤에서 물건을 들고 있어도 된다.>
36 4점: 체중이동을 잘하며 양쪽 어깨 넘어 잘 뒤돌아 볼 수 있다. 3점: 한쪽은 가능하나 반대쪽은 체중이동이 잘 되지 않는다. 2점: 옆으로 돌아보기까지만 균형유지가 가능하다. 1점: 돌아볼 때 감독이 필요하다. 0점: 균형을 잃거나 넘어지는 것을 방지하기 위해 도움이 필요하다. 11. 360° 돌기 <지시: 한 바퀴를 완전히 돌고 또 반대 방향으로 한 바퀴를 완전히 돌아보세요.> 4점: 4초 내에 안전하게 360° 돌 수 있다. 3점: 4초 내에 한쪽으로만 360° 돌 수 있다. 2점: 안전하게 돌 수 있으나 시간이 오래 걸린다. 1점: 근접 감독이나 말로 지시를 해야 한다. 0점: 도는 동안 도움이 필요하다. 12. 선 자세에서 발판에 양 발 교대로 놓기 <지시: 양 발을 발판에 각각 교대로 올려놓아 보세요. 4번 반복해서 양 발을 교대로 발판에 올려놓아 보세요.> 4점: 발판에 8번 오르내리기를 20초 이내에 한다. 3점: 발판에 8번 오르내리기를 20초 이상 걸린다. 2점: 감독 하에 도움 없이 4번 오르내릴 수 있다. 1점: 최소한의 도움으로 2번 오르내릴 수 있다. 0점: 시도할 수 없거나 넘어지지 않기 위해 도움이 필요하다. 13. 한 발을 다른 발 앞에 놓고 지지 없이 서 있기 <지시: (피검자에게 시범을 보여준다.) 한 발을 다른 발 바로 앞에 놓는다. 피검자가 발을 다른 발을 바로 앞에 놓고 설 수 없다면, 설 수 있을 만큼 발을 앞으로 더 내밀어 앞발의 뒤꿈치가 뒷발의 앞꿈치보다 앞으로 가게하고 서도록 한다(보장이 한발 길이를 초과하고, 보폭은 거의 정상 범위라면 3점을 준다.).> 4점: 30초간 독립적으로 한 발을 다른 발 앞에 붙여서 놓을 수 있다. 3점: 30초간 독립적으로 한 발을 다른 발 앞에 띄어서 놓을 수 있다. 2점: 30초 동안 유지가 가능하며 독립적으로 작은 보폭으로 발 놓기를 할 수 있다. 1점: 15초간 유지가 가능하나 발 놓을 때 도움이 필요하다. 0점: 발 놓기 및 서 있는 동안 균형을 잃는다.