© Korean Powder Metallurgy Institute 1229
-1. Introduction
The amount of adsorption of hydrogen in a volumetric apparatus is calculated by the equations of state (EOS) by step-by-step method, i.e. changing pressure step-by-step and summing up the amount of adsorption at each step. The equations of state that could accurately determine PVT data must be chosen.
Bennedict-Webb-Rubin (BWR) equation of state is used to identify the adsorption amount. It is independent of pressure so that the volume of sample cell is not affected by the pressure. They evacuate whole the system every time for each point of pressure since step-by-step method has the accumulation of the error.
The BWR equation is accurate. However, the parameter values available are limited to 273K and higher. On the contrary the other equations such as van der Waals, SRK, RK equations can be applied to wider range of temperature. Evacuating every point takes longer time than step-by-step way, which may cause a trouble to the vacuum pump for frequent usage.
In this article, we consider the factors of error in step-by-step method and compare the performance of the equations.
2. Experimental and Results
Good equations should satisfy two conditions, high precision and low inaccuracy. The precision of the equations could be evaluated by compressibility factor, z-value. The error of experimental data comes from the pressure and temperature measurements, δp and δT in the assessment of molar volume (Vm). During the experiment, the fluctuation of pressure and temperature would generate the error of molar volume.
Compressibility factor (Z) is defined as:
RT PV nRT PV Z ≡ = m 1
...
1
2 3 2=
+
BP
+
CP
+
DP
+
Z
Z1 are obtained by calculating the molar volume by EOS. The calculated Z2 values are correlated with pressure by a polynomial function. As a consequence, the effect of experimental errors in the measurement of molar volume is alleviated. Comparison made between the z-values from the equations of state and those evaluated from the pressure polynomial function would suggest the precision of the equations.
The errors associated with the pressure (p) and temperature (T) controller would make an influence to the errors of molar volume or molar density (ρ). If ρ=ρ(p,T)then the total differential of ρ is defined as:
dT T dp p d p T ⎟ ⎠ ⎞ ⎜ ⎝ ⎛ ∂ ∂ + ⎟⎟ ⎠ ⎞ ⎜⎜ ⎝ ⎛ ∂ ∂ ≡ ρ ρ ρ
As can be seen in Fig. 2, we simulated the movement of precision and errors of z-value of equations of states. Fig. 2 shows that Redlich/Kwong(RK) equation performed best of all since error is being lowered and precision is relatively high as pressure increases.
We used a hydrogen adsorption metal material, 29. 172-2 HY-STOR®201calcium-nickel alloy (Aldrich) to make sure
the theoretical result. Fig. 3 indicates the adsorption of hydrogen on the material by step-by-step method at ith trial.
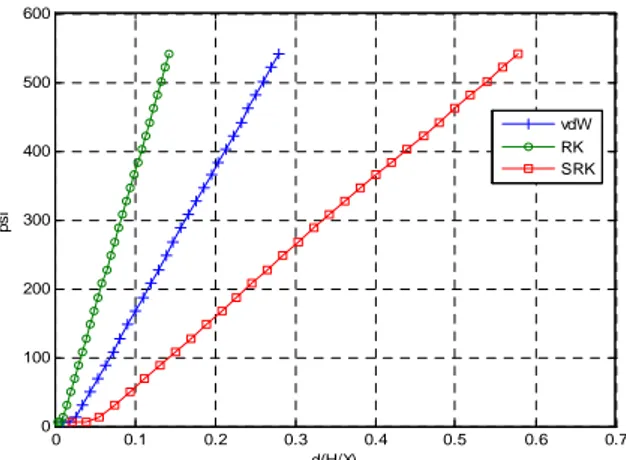
Fig. 4 is in accord with our simulated output. RK equation has the least error spans; the order of those is the same as the hypothetical consequence. The equations are defined as:
2006 POWDER METALLURGY World Congress
PC11-W-19
Accurate Determination of Hydrogen Adsorption on Metal Materials Considering
the Equations of State and its Influential Errors
Won Chul Cho1,a, Chu Sik Park1,b, and Sang Sup Han1,c
Hydrogen Energy Research Group Korea Institute of Energy Research
71-2 Jang-dong, Yuseong-gu, Daejeon 305-343, Korea
a
mizkee@kier.re.kr, bcspark@kier.re.kr, csshan@kier.re.kr Abstract
Adsorption isotherms of hydrogen by step-by-step method are widely used. However, the relations between the equations of state and the accumulated errors produced by step-by-step method and the mechanical errors of pressure or temperature controller were not analyzed. Considering the influence of various errors on the equations of state, we could find out the factors and compare the performance of the equations of state.
© Korean Powder Metallurgy Institute 1230 -) ( 6 . 201 ) / ( 2 dNsorb(i) X dX Nsorb(i) X dW X H d = = ⋅ − ⋅
[
]
[
]
[
]
()[
]
() ) ( ) ( ) ( ) ( ) ( i e sample reactor b i e sample reactor b a i j j e j c a i j j e j c i sorb d V V V dV dV dV V d d dV dN ρ ρ ρ ρ ρ ρ ⋅ − + + ⋅ + + + ⋅ + + ⋅ − =∑
∑
(1)d means error of the relevant data. ρc(i) and ρe(i) denotes the molar density contained in Va (both value 1 and value 2 are closed) and that stored in Va + Vb + Vcell (value 2 is open while valve 1 is closed in Fig. 1) at ith point of pressure
respectively. dVx is the volumetric error. The equation (1) shows that step-by-step method has the accumulated errors by summation of molar density and volume.
Fig. 1. Schematic diagram of the volumetric apparatus.
Fig. 2. Precision vs. error matrix with pressure.
0.2 0.4 0.6 0.8 1 1.2 1.4 1.6 1.8 0 0.5 1 1.5 2 2.5 3 3.5 4 H/X Mpa
Fig. 3. Result of adsorption measurement at 25 . H/X is the ℃
gram ratio of g(H2)/g(X).
3. Summary
The primary errors come from errors in the pressure and temperature values. There are mechanical errors in the controller so that the adsorption quantity has errors.
0 0.1 0.2 0.3 0.4 0.5 0.6 0.7 0 100 200 300 400 500 600 d(H/X) ps i vdW RK SRK
Fig. 4. Result of adsorption error measurement at 25 . ℃ The result showed that the error of RK equations was about 0.12 around 500 psi. Therefore, RK equation would be considered as an adequate equation. The step-by-step method has accured errors too. We suggested the patterns of errors and saw the results that support them. Therefore, these criteria would be applicable to other fields to examine the appropriate choice of the equations of state.
4. References
1. Li Zhou, Yaping Zhou. Determination of compressibility factor and fugacity coefficient of hydrogen in studies of adsorptive storage, Int’l Journal of Hydrogen Energy 26 (2001) 597-601
2. Tetsu Kiyobayashi, etc. Hydrogen adsorption in carbonaceous materials – How to determine the storage capacity accurately, Journal of Alloys and compounds 330-332 (2002) 666-669
3. Chao Zhang, etc. How to accurately determine the uptake of hydrogen in carboceous materials, Int’l Journal of Hydrogen Energy 29 (2004) 1271 – 1276