https://doi.org/10.3340/jkns.2020.0247 pISSN 2005-3711 eISSN 1598-7876
Diffusion-Weighted Magnetic Resonance Imaging in the
Diagnosis of Cerebral Venous Thrombosis : A
Meta-Anal-ysis
Bin Lv,1,* Feng Jing,1,* Cheng-lin Tian,1 Jian-chao Liu,2 Jun Wang,1 Xiang-yu Cao,1 Xin-feng Liu,1 Sheng-yuan Yu1
Department of Neurology,1 Chinese PLA General Hospital, Beijing, China
Department of Medical Statistics,2 Chinese PLA General Hospital, Beijing, China
Objective : A role of diffusion-weighted imaging (DWI) in the diagnosis of cerebral venous thrombosis (CVT) is not well-understood. This study evaluates the effectiveness of DWI in the diagnosis of CVT.
Methods : Literature search was conducted in electronic databases for the identification of studies which reported the outcomes of patients subjected to DWI for CVT diagnosis. Random-effects meta-analyses were performed to achieve overall estimates of important diagnostic efficiency indices including hyperintense signal rate, the sensitivity and specificity of DWI in diagnosing CVT, and the apparent diffusion coefficient (ADC) of DWI signal areas and surrounding tissue.
Results : Nineteen studies (443 patients with 856 CVTs; age 40 years [95% confidence interval (CI), 33 to 43]; 28% males [95% CI, 18 to 38]; symptom onset to DWI time 4.6 days [95% CI, 2.3 to 6.9]) were included. Hyperintense signals on DWI were detected in 40% (95% CI, 26 to 55) of the cases. The sensitivity of DWI for detecting CVT was 22% (95% CI, 11 to 34) but specificity was 98% (95% CI, 95 to 100). ADC values were quite heterogenous in DWI signal areas. However, generally the ADC values were lower in DWI signal areas than in surrounding normal areas (mean difference−0.33×10⁻³ mm2/s [95% CI, −0.44 to −0.23]; p<0.00001).
Conclusion : DWI has a low sensitivity in detecting CVT and thus has a high risk of missing many CVT cases. However, because of its high specificity, it may have supporting and exploratory roles in CVT diagnosis.
Key Words : Thrombosis, Cerebral venous · Magnetic resonance imaging, Diffusion weighted · Diagnosis · Specificity · Sensitivity.
• Received : August 24, 2020 • Revised : September 25, 2020 • Accepted : October 7, 2020 • Address for reprints : Cheng-lin Tian
Department of Neurology, Chinese PLA General Hospital, No 28, Fuxing Road, Beijing 100853, China
Tel : +86-10-55499018, Fax : +86-10-55499018, E-mail : [email protected], ORCID : https://orcid.org/0000-0002-4361-9466 *Bin Lv and Feng Jing contributed equally to this study.
This is an Open Access article distributed under the terms of the Creative Commons Attribution Non-Commercial License (http://creativecommons.org/licenses/by-nc/4.0) which permits unrestricted non-commercial use, distribution, and reproduction in any medium, provided the original work is properly cited.
INTRODUCTION
Cerebral venous thrombosis (CVT) is a distinct cerebrovas-cular disease which accounts for approximately 1–2% of all
adult stroke cases19)
. It has an annual incidence of 3–4 cases per million in adults and up to seven cases per million in chil-dren30)
. CVT mostly affects individuals aged 20–50 years and less than 10% victims are over 65 years of age. Females have a
3-fold greater risk of developing CVT29). Among the risk fac-tors for CVT incidence, heridetary thrombophilia, inflamma-tory disorders and cancer, pregnancy, diabetes, and oral con-traceptive use are more important4)
. The presentation is usually subacute as symptoms evolve over days to weeks. Commonly associated symptoms include headache, focal neurologic deficits, seizures, altered consciousness, obscura-tion of vision, nausea, vomiting, papilledema, cranial nerve palsies and coma27).
Diagnosis of CVT is difficult because clinical manifesta-tions are often nonspecific and relies mainly on neuroimaging findings which may also provide information about flow dy-namics of affected area32). Because a thrombus develops with time and can be associated with recanalization such as the chronic partially recanalized dural sinus thrombosis, neuro-imaging methods can have a compromised output17)
. In gen-eral, a diagnosis based on T2-weighted imaging (T2WI) in combination with magnetic resonance venography (MRV) is recommended as the first line modality12,35)
. Besides leaving a hyperintense signal on T2WI, a thrombus in cerebral vein or sinus may also produce a hyperintense signal on diffusion-weighted imaging (DWI)34)
. DWI is a method of magnetic res-onance imaging (MRI) technology which quantifies Brown-ian motion of water and is highly sensitive in detecting acute
arterial strokes and distinguishing cytotoxic and vasogenic edema.
The efficiency of DWI for the diagnosis of CVT is evaluated by several authors of retrospective studies19-23)
. However, the outcomes are considerably heterogenous which necessitates a systematic review of this area. The aim of the present study was to undertake a literature survey for the identifications of relevant studies and to perform a meta-analysis of important indices which can provide a refined evidence of the efficiency of DWI in diagnosing CVT.
MATERIALS AND METHODS
All analyses were based on previously published studies; therefore, no ethical approval or patient consent were re-quired.
Inclusion criteria
The inclusion criteria were: the study — 1) evaluated the ef-ficiency of DWI in the diagnosis of CVT; and 2) reported one or more relevant endpoint/s including the rate of hyperintense signal detection by DWI, area under receiver operator curve (AUROC) parameters for DWI utility in diagnosis CVT, and
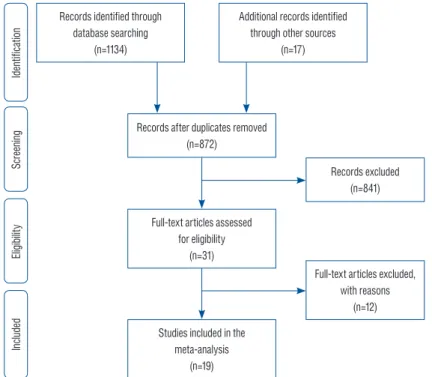
Fig. 1. A flowchart of study screening and selection process. Records identified through
database searching (n=1134)
Additional records identified through other sources
(n=17)
Records after duplicates removed (n=872)
Records excluded (n=841)
Full-text articles excluded, with reasons
(n=12) Full-text articles assessed
for eligibility (n=31)
Studies included in the meta-analysis (n=19) Id en tifi ca tio n Sc re eni ng Eli gib ilit y In clu de d
apparent diffusion coefficient (ADC) values of areas with and without DWI signal in patients with CVT.
Literature search
Electronic databases (EMBASE, Google Scholar, Ovid SP, and PubMed) were searched for the acquisition of research ar-ticles reporting the outcomes of diagnostic performance/utili-ty of DWI for CVT. Literature search was carried out by using important keywords in logical combinations. These included cerebral venous thrombosis, CVT, vein, sinus, clot, stroke, hemorrhage, edema, occlusion, magnetic resonance imaging, MRI, diffusion-weighted imaging, DWI, apparent diffusion
coefficient, ADC, hyperintense signal, area under operator re-ceiver curve (AUROC), specificity, sensitivity, diagnosis, and diagnostic accuracy. Database software suggested articles and cross references of important literary sources were also exam-ined.
Data extraction, synthesis, and statistical analysis
Relevant data (demographic, clinical, and pathological characteristics of the patients, study design and dates, techni-cal details of the procedures, outcome measures and out-comes) were extracted from published research articles of re-spective studies and were organized in specialized datasheets.
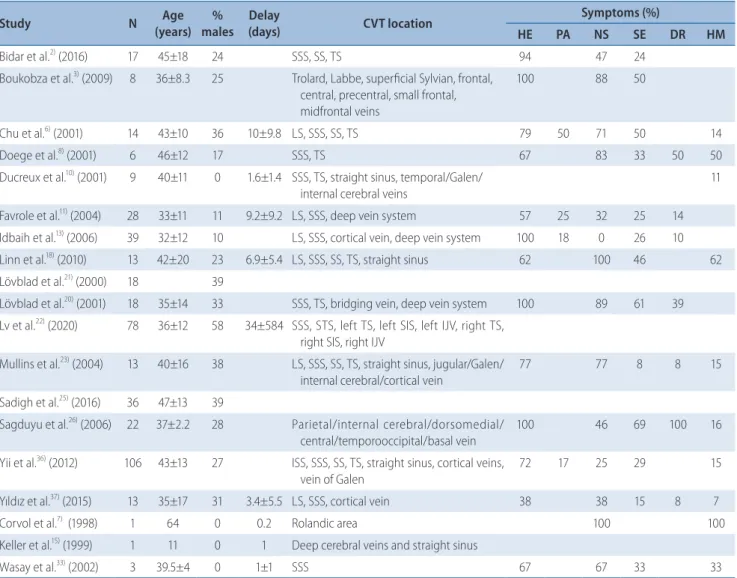
Table 1. Important characteristics of the included studies
Study N (years)Age males% (days)Delay CVT location Symptoms (%)
HE PA NS SE DR HM
Bidar et al.2) (2016) 17 45±18 24 SSS, SS, TS 94 47 24
Boukobza et al.3) (2009) 8 36±8.3 25 Trolard, Labbe, superficial Sylvian, frontal,
central, precentral, small frontal, midfrontal veins
100 88 50
Chu et al.6) (2001) 14 43±10 36 10±9.8 LS, SSS, SS, TS 79 50 71 50 14
Doege et al.8) (2001) 6 46±12 17 SSS, TS 67 83 33 50 50
Ducreux et al.10) (2001) 9 40±11 0 1.6±1.4 SSS, TS, straight sinus, temporal/Galen/
internal cerebral veins
11
Favrole et al.11) (2004) 28 33±11 11 9.2±9.2 LS, SSS, deep vein system 57 25 32 25 14
Idbaih et al.13) (2006) 39 32±12 10 LS, SSS, cortical vein, deep vein system 100 18 0 26 10
Linn et al.18) (2010) 13 42±20 23 6.9±5.4 LS, SSS, SS, TS, straight sinus 62 100 46 62
Lövblad et al.21) (2000) 18 39
Lövblad et al.20) (2001) 18 35±14 33 SSS, TS, bridging vein, deep vein system 100 89 61 39
Lv et al.22) (2020) 78 36±12 58 34±584 SSS, STS, left TS, left SIS, left IJV, right TS,
right SIS, right IJV
Mullins et al.23) (2004) 13 40±16 38 LS, SSS, SS, TS, straight sinus, jugular/Galen/
internal cerebral/cortical vein
77 77 8 8 15
Sadigh et al.25) (2016) 36 47±13 39
Sagduyu et al.26) (2006) 22 37±2.2 28 Parietal/internal cerebral/dorsomedial/
central/temporooccipital/basal vein 100 46 69 100 16
Yii et al.36) (2012) 106 43±13 27 ISS, SSS, SS, TS, straight sinus, cortical veins,
vein of Galen
72 17 25 29 15
Yıldız et al.37) (2015) 13 35±17 31 3.4±5.5 LS, SSS, cortical vein 38 38 15 8 7
Corvol et al.7) (1998) 1 64 0 0.2 Rolandic area 100 100
Keller et al.15) (1999) 1 11 0 1 Deep cerebral veins and straight sinus
Wasay et al.33) (2002) 3 39.5±4 0 1±1 SSS 67 67 33 33
CVT : cerebral venous thrombosis, HE : headache, PA : papilledema, NS : neurological symptoms, SE : seizures, DR : drowsiness, HM : hemiparesis, SSS : superficial sagittal sinus, SS : sigmoid sinus, TS : transverse sinus, LS : lateral sinus, STS : straight sinus, SIS : sigmoid sinus, IJV : internal jugular vein, ISS : inferior sagittal sinus
For achieving the pooled estimates of percent DWI hyperin-tense signals and AUROC parameters, the meta-analysis of proportions with Freeman-Tukey double arcsine
transforma-tion were performed with Stata software (version 12; Stata Corporation, College Station, TX, USA). For the evaluation of the significance of difference between DWI measured ADC of thrombosed sites and normal brain areas, a meta-analysis of mean differences was performed with RevMan software (ver-sion 5.3; Cochrane, Copenhagen, Denmark) under random effects model. Between-study inconsistency was tested with I2
index. Publication bias assessment was performed with Egger’s regression asymmetry test and trim and fill method was used to estimate the number of possible missing studies.
RESULTS
Nineteen studies were included (Fig. 1). The literature search identified 872 abstracts but vast majority (n=840) had to be excluded based on irrelevancy of title/abstract. Thirty-two re-search articles were found to have relevant text/data and were downloaded from databases. After the observance of eligibili-100
50
0
-50
0 10 20
S.E. of : theta, filled
Th
et
a,
fill
ed
Filled funnel plot with pseudo 95% confidence limits
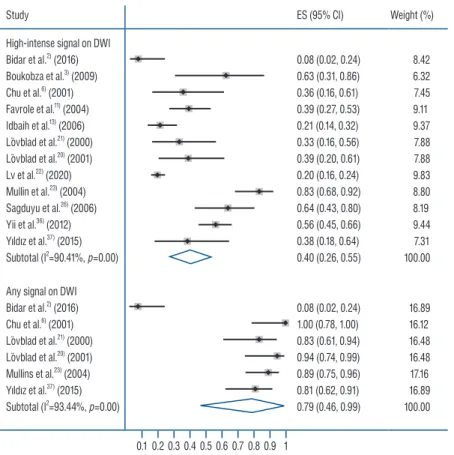
Fig. 2. A funnel plot corresponding to the meta-analysis of diffusion-weighted imaging hyperintense signal rate showing the outcomes of trim and fill method of publication bias assessment. Circles show studies included in the meta-analysis whereas circles within squares show possible missing studies. S.E. : standard error.
Study ES (95% CI) Weight (%)
High-intense signal on DWI Bidar et al.2) (2016) Boukobza et al.3) (2009) Chu et al.6) (2001) Favrole et al.11) (2004) Idbaih et al.13) (2006) Lövblad et al.21) (2000) Lövblad et al.20) (2001) Lv et al.22) (2020) Mullin et al.23) (2004) Sagduyu et al.26) (2006) Yii et al.36) (2012) Yıldız et al.37) (2015) Subtotal (I2=90.41%, p=0.00) Any signal on DWI Bidar et al.2) (2016) Chu et al.6) (2001) Lövblad et al.21) (2000) Lövblad et al.20) (2001) Mullins et al.23) (2004) Yıldız et al.37) (2015) Subtotal (I2=93.44%, p=0.00) 0.08 (0.02, 0.24) 0.63 (0.31, 0.86) 0.36 (0.16, 0.61) 0.39 (0.27, 0.53) 0.21 (0.14, 0.32) 0.33 (0.16, 0.56) 0.39 (0.20, 0.61) 0.20 (0.16, 0.24) 0.83 (0.68, 0.92) 0.64 (0.43, 0.80) 0.56 (0.45, 0.66) 0.38 (0.18, 0.64) 0.40 (0.26, 0.55) 0.08 (0.02, 0.24) 1.00 (0.78, 1.00) 0.83 (0.61, 0.94) 0.94 (0.74, 0.99) 0.89 (0.75, 0.96) 0.81 (0.62, 0.91) 0.79 (0.46, 0.99) 8.42 6.32 7.45 9.11 9.37 7.88 7.88 9.83 8.80 8.19 9.44 7.31 100.00 16.89 16.12 16.48 16.48 17.16 16.89 100.00 0.1 0.2 0.3 0.4 0.5 0.6 0.7 0.8 0.9 1
Fig. 3. A forest plot showing the overall effect size of percent rate of hyperintense signal on DWI in cerebral venous thrombosis cases. In study identities, in case of Linn et al.18), first values are for cortical vein, and second for superior sagittal sinus. In case of Sadigh et al.25), first and second values
ty criteria, 19 research articles were found useful for the cur-rent study. Studies that used DWI for other purposes such as
characterizing cytotoxic or vasogenic edema; studies that used DWI and other diagnostic modalities but did not report
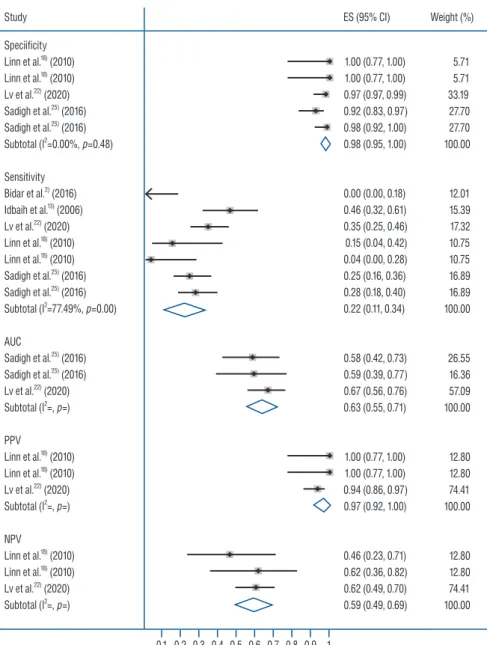
re-Fig. 4. A forest plot showing the pooled sensitivity and specificity values in diagnosing cerebral venous thrombosis by diffusion-weighted imaging. ES : effect size, CI : confidence interval, AUC : area under curve, PPV : positive predictive value, NPV : negative predictive value.
Study ES (95% CI) Weight (%)
Speciificity Linn et al.18) (2010) Linn et al.18) (2010) Lv et al.22) (2020) Sadigh et al.25) (2016) Sadigh et al.25) (2016) Subtotal (I2=0.00%, p=0.48) Sensitivity Bidar et al.2) (2016) Idbaih et al.13) (2006) Lv et al.22) (2020) Linn et al.18) (2010) Linn et al.18) (2010) Sadigh et al.25) (2016) Sadigh et al.25) (2016) Subtotal (I2=77.49%, p=0.00) AUC Sadigh et al.25) (2016) Sadigh et al.25) (2016) Lv et al.22) (2020) Subtotal (I2=, p=) PPV Linn et al.18) (2010) Linn et al.18) (2010) Lv et al.22) (2020) Subtotal (I2=, p=) NPV Linn et al.18) (2010) Linn et al.18) (2010) Lv et al.22) (2020) Subtotal (I2=, p=) 1.00 (0.77, 1.00) 1.00 (0.77, 1.00) 0.97 (0.97, 0.99) 0.92 (0.83, 0.97) 0.98 (0.92, 1.00) 0.98 (0.95, 1.00) 0.00 (0.00, 0.18) 0.46 (0.32, 0.61) 0.35 (0.25, 0.46) 0.15 (0.04, 0.42) 0.04 (0.00, 0.28) 0.25 (0.16, 0.36) 0.28 (0.18, 0.40) 0.22 (0.11, 0.34) 0.58 (0.42, 0.73) 0.59 (0.39, 0.77) 0.67 (0.56, 0.76) 0.63 (0.55, 0.71) 1.00 (0.77, 1.00) 1.00 (0.77, 1.00) 0.94 (0.86, 0.97) 0.97 (0.92, 1.00) 0.46 (0.23, 0.71) 0.62 (0.36, 0.82) 0.62 (0.49, 0.70) 0.59 (0.49, 0.69) 5.71 5.71 33.19 27.70 27.70 100.00 12.01 15.39 17.32 10.75 10.75 16.89 16.89 100.00 26.55 16.36 57.09 100.00 12.80 12.80 74.41 100.00 12.80 12.80 74.41 100.00 0.1 0.2 0.3 0.4 0.5 0.6 0.7 0.8 0.9 1 Study of subgroup
DWI signal area ADC Surrounding area ADC
Weight (%)
Mean difference Mean difference
Mean SD Total Mean SD Total IV, random, 95% CI IV, random, 95% CI
Case reports 0.78 0.34 6 0.86 0.31 6 7.8 –0.08 (–0.45, –0.29)
–1 –0.5 0 0.5 1
Favrole et al.11) (2011) 0.49 0.15 5 0.84 0.1 5 42.5 –0.35 (–0.51, –0.19) Lövblad et al.20) (2001) 0.66 0.19 7 1.02 0.035 3 49.7 –0.36 (–0.51, –0.21)
Total (95% CI) 18 14 100.0 –0.33 (–0.44, –0.23)
Heterogeneity : Tau2=0.00; chi2=1.99, df=2 (p=0.37); I2=0% Test for overall effect : Z=6.35 (p<0.00001)
Fig. 5. A forest plot showing the mean difference between ADC values in thrombosed areas and surrounding areas of patients with cerebral venous thrombosis. DWI : diffusion-weighted imaging, ADC : apparent diffusion coefficient, SD : standard deviation, CI : confidence interval.
sults for each method separately; studies published in a non-English language; and review articles were excluded.
Among the included studies, 16 were retrospective in desig ns2,3,6,8,10,11,13,18,20-23,25,26,36,37)
and three were the case reports7,15,33)
. In all, 443 patients with CVT were subjected to DWI exami-nations in these studies. Total number of CVTs studied was 856. Important characteristics of the included studies are pre-sented in Table 1. Study of a funnel plot corresponding to the meta-analysis of pooled incidence of hyperintense signal on DWI indicated the possibility of some missing studies (Fig. 2). Egger’s regression asymmetry test also showed significant publication bias (coefficient : 4.46 [95% confidence interval (CI), 2.31 to 6.60]; p=0.001).
Age of these patients was 40.1 years (95% CI, 33.1 to 43.1) and 28% (95% CI, 18 to 38) of these patients were male. Delay time from onset of symptoms to DWI was 4.61 days (95% CI, 2.3 to 6.9). Major symptoms in these patients were: headache 76.4% (95% CI, 62.6 to 90.3), neurological deficits 71.6% (95% CI, 56.0 to 87.2), seizures (33.6% [95% CI, 24.7 to 42.5]), hemi-paresis 32.3% (95% CI, 25.2 to 39.3), papilledema 27.2% (95% CI, 19.3 to 35.1), and drowsiness (21.0% [95% CI, 13.8 to 28.3]).
Eighty-two percent of cerebral thromboses were found in sinuses and 18% in veins. Among the sinuses, the incidence of thrombosis was 28% in superior sagittal sinus, 37% in lateral/ transverse sinus, 13% in sigmoid sinus, 4% in straight sinus, and 0.74% in inferior sagittal sinus. Among the cortical veins, the incidence of thrombosis was 0.55% in frontal vein, 0.37% in Trolard vein, 0.37% in Labbe vein, and 0.2% in superficial Sylvian vein. Within the deep cerebral veins, the incidence of thrombus was 1% in vein of Galen and 0.56% in internal cere-bral vein. Moreover, the thrombus incidence was 0.37% in jugular vein, 0.2% in central vein and 0.2% in precentral vein.
Hyperintense signals on DWI were detected in 40% (95% CI, 26 to 55) of the patients with CVT (Fig. 3). However, any signal of clinical interest on DWI was found in 79% (95% CI, 46 to 99) of the patients. The sensitivity of DWI in the diagno-sis of CVT was 22% (95% CI, 11 to 34). However, the specific-ity of DWI for detecting CVT was 98% (95% CI, 95 to 100) (Fig. 4).
ADC findings of the including studies were much heteroge-neous. The range of ADC (×10-3 mm2/s) values in the DWI signal areas noted by the individual studies were 0.25–1.223)
, 0.32–0.866) , 0.33–1.7410) , 0.49±0.15 (standard deviation)11) , 0.65–0.7920) , and 0.81–1.38)
. In general, the ADC values were
lower in DWI signal areas than in surrounding non-CVT ar-eas (mean difference−0.33×10⁻³
mm2/s [95% CI, −0.44 to
−0.23]; p<0.00001; Fig. 5).
DISCUSSION
In a sample population of patients with CVT who under-went DWI studies, we have found that the proportion of pa-tients with CVT in whom hyperintense signals were detected on DWI was approximately 40%. Only a few studies reported the AUROC data, based on which the sensitivity of DWI in detecting a CVT was only 22% whereas the specificity was 98%2,13,18,22,25)
. There was a wider range of ADC values for DWI signal areas but generally it was lower in thrombosed areas than in surrounding tissues.
Currently, the MRI is routinely used in patients suspected for the presence of CVT by using different MRI sequences. Although, we have observed that hyperintense signal on DWI is associated with low sensitivity to detect CVT, however, the hyperintense signal on DWI had high specificity for CVT. It is suggested that DWI can provide an additional clue for the di-agnosis of CVT which could be important in clinically unsus-pected patients37)
. By using DWI, Favrole et al.11)
detected 20 occluded veins or sinuses in 12 patients (41%) with recent CVT and suggested that the presence of hyperintense signal on DWI in occluded veins at the time of diagnosis might be predictive of a low rate of vessel recanalization 2 or 3 months later. They also suggested that the movements of water mole-cules are restricted within the venous clot according to the stage of CVT formation11)
. Using diffusion-tensor imaging for 77 CVTs in 33 children, Wagner et al.31)
found restricted dif-fusion patterns in 38% of thromboses.
We have found that the proportion of patients with CVT for whom DWI hyperintense signals were detected was approxi-mately 40%. The range was from 8% to 83% in the individual studies which contributed to a high statistical heterogeneity in this pooled analysis. Signal intensity on DWI mainly depends on restricted rates of diffusion. Compared with the normal white matter, stable but reduced diffusion has been observed in hyperacute, acute, and early subacute hematomas contain-ing hemoglobin within intact red blood cells1,14,28)
. A thrombus in the vein can be differentiated from an intracerebral hema-toma by the absence of extracellular f luid due to which
thrombus exhibits highly restricted diffusion that can result in more intense signal on DWI22)
.
The MRI intensity of venous thrombus varies according to time of imaging from the onset of thrombus formation. This may also affect the results of DWI to show high signal intensi-ty with low ADC due to restricted diffusion. Especially if symptoms are subtle and the progression of thrombus is not uniform, the onset of thrombus formation cannot be detected accurately always which may lead to a low sensitivity of this method. Diagnosis of a thrombus in the cerebral veins can also be influenced by the paramagnetic effect of deoxyhemo-globin in blood16)
. The latest AHA/ASA scientific statement recommends that gradient echo T2 susceptibility-weighted imaging with MRI should be used to improve the accuracy of CVT diagnosis27)
.
Use of DWI can be more valuable in discriminating the types of edema, in the assessment of tissue viability, in the de-tection of subclinical abnormalities, and in facilitation of basic imaging research related to the pathophysiology of CVT6)
. It has also been suggested that DWI may provide an additional clue to CVT diagnosis in clinically unsuspected patients after standard MRI scans but without sensitive MRI sequences such as contrast enhanced MRV or T2-weighted gradient recalled echo. Careful examination of cortical surface on diffusion MRI for clot signal or clot susceptibility signal can give addi-tional information when CVT is not suspected on routine T1 or T2 or fluid-attenuated inversion recovery sequence37)
. The presence of hyperintense signal on DWI has also been found to be predictive of clinical deterioration during hospital stay31).
ADC values were quite heterogenous in DWI signal areas among the included studies and less data were available to study ADC patterns comparatively. Generally, the ADC values were lower in DWI signal areas in comparison with surround-ing areas. Lower ADC values are usually associated with path-ological conditions including cerebrovascular events5,9,24)
. Moreover, ADC values change with time. In atypical ischemic event in brain, the ADC start decreasing from first hour of event to reach minimal levels at 24 hours after the onset of event and then start rising to become higher than surround-ing normal tissue after 3 days of onset2)
. In cerebral hemor-rhage patients too, a correlation is found between the signal intensity ratio on DWI with that of T2WI, but there existed no correlation between signal intensity and ADC28)
.
CONCLUSION
This meta-analytical review suggests that DWI has low di-agnostic efficiency and thus has a high risk of missing many CVT cases but may have supporting and exploratory roles. Although, hyperintense signals can be found at sites of throm-bosis on DWI in at least some patients with CVT, the DWI may be more useful in differentiating CVT from intravenous non-thrombotic tissue as well as subclinical abnormalities. However, more data will be required to precisely evaluate DWI performance for CVT detection in general or for a sub-group of patients.
CONFLICTS OF INTEREST
No potential conflict of interest relevant to this article was reported.
INFORMED CONSENT
This type of study does not require informed consent.
AUTHOR CONTRIBUTIONS
Conceptualization : CT Data curation : FJ Formal analysis : BL, FJ Funding acquisition : JW Methodology : JL Project administration : SY Visualization : XCWriting - original draft : XL Writing - review & editing : BL
ORCID
Bin Lv https://orcid.org/0000-0001-9858-8778
Feng Jing https://orcid.org/0000-0002-3532-2013
Cheng-lin Tian https://orcid.org/0000-0002-4361-9466 Jian-chao Liu https://orcid.org/0000-0001-5647-3518
Xiang-yu Cao https://orcid.org/0000-0003-0950-9674 Xin-feng Liu https://orcid.org/0000-0001-5551-0022 Sheng-yuan Yu https://orcid.org/0000-0003-4992-0521
References
1. Atlas SW, DuBois P, Singer MB, Lu D : Diffusion measurements in intra-cranial hematomas: implications for MR imaging of acute stroke. AJNR
Am J Neuroradiol 21 : 1190-1194, 2000
2. Bidar F, Faeghi F, Ghorbani A : Assessment of cerebral venous sinus thrombosis using T2 (*)-weighted gradient echo magnetic resonance imaging sequences. Iran J Neurol 15 : 96-99, 2016
3. Boukobza M, Crassard I, Bousser MG, Chabriat H : MR imaging features of isolated cortical vein thrombosis: diagnosis and follow-up. AJNR Am
J Neuroradiol 30 : 344-348, 2009
4. Chiewvit P, Piyapittayanan S, Poungvarin N : Cerebral venous thrombo-sis: diagnosis dilemma. Neurol Int 3 : e13, 2011
5. Choi SY, Chang YW, Park HJ, Kim HJ, Hong SS, Seo DY : Correlation of the apparent diffusion coefficiency values on diffusion-weighted imag-ing with prognostic factors for breast cancer. Br J Radiol 85 : e474-e479, 2012
6. Chu K, Kang DW, Yoon BW, Roh JK : Diffusion-weighted magnetic reso-nance in cerebral venous thrombosis. Arch Neurol 58 : 1569-1576, 2001
7. Corvol JC, Oppenheim C, Manaï R, Logak M, Dormont D, Samson Y, et al. : Diffusion-weighted magnetic resonance imaging in a case of cere-bral venous thrombosis. Stroke 29 : 2649-2652, 1998
8. Doege CA, Tavakolian R, Kerskens CM, Romero BI, Lehmann R, Einhäupl KM, et al. : Perfusion and diffusion magnetic resonance imaging in hu-man cerebral venous thrombosis. J Neurol 248 : 564-571, 2001 9. Drake-Pérez M, Boto J, Fitsiori A, Lovblad K, Vargas MI : Clinical
ap-plications of diffusion weighted imaging in neuroradiology. Insights
Imaging 9 : 535-547, 2018
10. Ducreux D, Oppenheim C, Vandamme X, Dormont D, Samson Y, Ran-curel G, et al. : Diffusion-weighted imaging patterns of brain damage associated with cerebral venous thrombosis. AJNR Am J Neuroradiol
22 : 261-268, 2001
11. Favrole P, Guichard JP, Crassard I, Bousser MG, Chabriat H : Diffusion-weighted imaging of intravascular clots in cerebral venous thrombosis.
Stroke 35 : 99-103, 2004
12. Guenther G, Arauz A : Cerebral venous thrombosis: a diagnostic and treatment update. Neurologia 26 : 488-498, 2011
13. Idbaih A, Boukobza M, Crassard I, Porcher R, Bousser MG, Chabriat H : MRI of clot in cerebral venous thrombosis: high diagnostic value of susceptibility-weighted images. Stroke 37 : 991-995, 2006
14. Kang BK, Na DG, Ryoo JW, Byun HS, Roh HG, Pyeun YS : Diffusion-weighted MR imaging of intracerebral hemorrhage. Korean J Radiol 2 : 183-191, 2001
15. Keller E, Flacke S, Urbach H, Schild HH : Diffusion- and
perfusion-weighted magnetic resonance imaging in deep cerebral venous throm-bosis. Stroke 30 : 1144-1146, 1999
16. Leach JL, Strub WM, Gaskill-Shipley MF : Cerebral venous thrombus signal intensity and susceptibility effects on gradient recalled-echo MR imaging. AJNR Am J Neuroradiol 28 : 940-945, 2007
17. Leach JL, Wolujewicz M, Strub WM : Partially recanalized chronic dural sinus thrombosis: findings on MR imaging, time-of-flight MR venogra-phy, and contrast-enhanced MR venography. AJNR Am J Neuroradiol
28 : 782-789, 2007
18. Linn J, Michl S, Katja B, Pfefferkorn T, Wiesmann M, Hartz S, et al. : Cor-tical vein thrombosis: the diagnostic value of different imaging modali-ties. Neuroradiology 52 : 899-911, 2010
19. Linn J, Pfefferkorn T, Ivanicova K, Müller-Schunk S, Hartz S, Wiesmann M, et al. : Noncontrast CT in deep cerebral venous thrombosis and sinus thrombosis: comparison of its diagnostic value for both entities. AJNR
Am J Neuroradiol 30 : 728-735, 2009
20. Lövblad KO, Bassetti C, Schneider J, Guzman R, El-Koussy M, Remonda L, et al. : Diffusion-weighted mr in cerebral venous thrombosis.
Cerebro-vasc Dis 11 : 169-176, 2001
21. Lövblad KO, Bassetti C, Schneider J, Ozdoba C, Remonda L, Schroth G : Diffusion-weighted MRI suggests the coexistence of cytotoxic and vasogenic oedema in a case of deep cerebral venous thrombosis.
Neu-roradiology 42 : 728-731, 2000
22. Lv B, Tian CL, Cao XY, Liu XF, Wang J, Yu SY : Role of diffusion-weighted imaging in the diagnosis of cerebral venous thrombosis. J Int Med Res
48 : 300060520933448, 2020
23. Mullins ME, Grant PE, Wang B, Gonzalez RG, Schaefer PW : Parenchy-mal abnorParenchy-malities associated with cerebral venous sinus thrombosis: assessment with diffusion-weighted MR imaging. AJNR Am J
Neuro-radiol 25 : 1666-1675, 2004
24. Mussi TC, Martins T, Tachibana A, Mousessian PN, Baroni RH : Objec-tive value on apparent diffusion coefficient (ADC) map to categorize the intensity of diffusion-weighted imaging (DWI) restriction for prostate cancer detection on multiparametric prostate MRI. Int Braz J Urol 44 : 882-891, 2018
25. Sadigh G, Mullins ME, Saindane AM : Diagnostic performance of MRI sequences for evaluation of dural venous sinus thrombosis. AJR Am J
Roentgenol 206 : 1298-1306, 2016
26. Sagduyu A, Sirin H, Mulayim S, Bademkiran F, Yunten N, Kitis O, et al. : Cerebral cortical and deep venous thrombosis without sinus thrombosis: clinical MRI correlates. Acta Neurol Scand 114 : 254-260, 2006 27. Saposnik G, Barinagarrementeria F, Brown RD Jr, Bushnell CD, Cucchiara
B, Cushman M, et al. : Diagnosis and management of cerebral venous thrombosis: a statement for healthcare professionals from the American Heart Association/American Stroke Association. Stroke 42 : 1158-1192, 2011
28. Silvera S, Oppenheim C, Touzé E, Ducreux D, Page P, Domigo V, et al. : Spontaneous intracerebral hematoma on diffusion-weighted images: Influence of T2-shine-through and T2-blackout effects. AJNR Am J
Neuroradiol 26 : 236-241, 2005
throm-bosis. Nat Rev Neurol 13 : 555-565, 2017
30. Stam J : Thrombosis of the cerebral veins and sinuses. N Engl J Med
352 : 1791-1798, 2005
31. Wagner MW, Bosemani T, Oshmyansky A, Poretti A, Huisman TA : Neu-roimaging findings in pediatric cerebral sinovenous thrombosis. Childs
Nerv Syst 31 : 705-712, 2015
32. Wasay M, Azeemuddin M : Neuroimaging of cerebral venous thrombo-sis. J Neuroimaging 15 : 118-128, 2005
33. Wasay M, Bakshi R, Bobustuc G, Dubey N, Cheema Z, Dai A : Diffusion-weighted magnetic resonance imaging in superior sagittal sinus throm-bosis. J Neuroimaging 12 : 267-269, 2002
34. Washida K, Kowa H, Tsuji Y, Sekiguchi K, Kanda F, Toda T : Multiple
deep white matter hyperintense lesions on diffusion-weighted imaging: early sign of straight sinus thrombosis. J Stroke Cerebrovasc Dis 25 : e131-e133, 2016
35. Weimar C, Masuhr F, Hajjar K : Diagnosis and treatment of cerebral ve-nous thrombosis. Expert Rev Cardiovasc Ther 10 : 1545-1553, 2012 36. Yii IY, Mitchell PJ, Dowling RJ, Yan B : Imaging predictors of clinical de-terioration in cerebral venous thrombosis. J Clin Neurosci 19 : 1525-1529, 2012
37. Yıldız ME, Ozcan UA, Turk A, Ulus OS, Erzen C, Dinçer A : Diffusion-weighted MR imaging findings of cortical vein thrombosis at 3 T. Clin