Analysis of Hospital Volume and Factors Influencing
Economic Outcomes in Cancer Surgery:
Results from a Population-based Study in Korea
Jung-A Lee
a, So-Young Kim
b,c, Keeho Park
d, Eun-Cheol Park
e, Jong-Hyock Park
b,c,daDepartment of Health and Medical Information, School of Arts and Health Care, Myongji College, Seoul, Korea
bDepartment of Health Information and Management, Chungbuk National University College of Medicine, Cheongju, Korea cGraduate School of Health Science Business Convergence, Chungbuk National University, Cheongju, Korea
dNational Cancer Control Research Institute, National Cancer Center, Goyang, Korea
eDepartment of Preventive Medicine and Institute of Health Services Research, Yonsei University College of Medicine, Seoul, Korea
Objectives: To evaluate associations between hospital volume, costs, and length of stay (LOS), and clinical and demographic outcome factors for five types of cancer resection. The main de-pendent variables were cost and LOS; the primary indede-pendent variable was volume.
Methods: Data were obtained from claims submitted to the Korean National Health Insurance scheme. We identified patients who underwent the following surgical procedures: pneumonec-tomy, colecpneumonec-tomy, mastecpneumonec-tomy, cystecpneumonec-tomy, and esophagectomy. Hospital volumes were divided into quartiles.
Results: Independent predictors of high costs and long LOS included old age, low health insur-ance contribution, non-metropolitan residents, emergency admission, Charlson score > 2, public hospital ownership, and teaching hospitals. After adjusting for relevant factors, there was an in-verse relationship between volume and costs/LOS. The highest volume hospitals had the lowest procedure costs and LOS. However, this was not observed for cystectomy.
Conclusion: Our findings suggest an association between patient and clinical factors and greater costs and LOS per surgical oncologic procedure, with the exception of cystectomy. Yet, there were no clear associations between hospitals’ cost of care and risk-adjusted mortality.
Key Words: neoplasms, surgical procedures, operative, hospital costs, length of stay, hospitalization
Corresponding author: Jong-Hyock Park
E-mail: [email protected]
INTRODUCTION
Numerous studies have demonstrated a volume–outcome relationship for medical and sur-gical care, whereby outcomes improve as the number of procedures performed at a particular hospital increases [1–5]. Some reports attribute this association to a “practice makes perfect” effect [1,2], the effect of improving outcomes by repetitively performing the same procedures
[6]. Within the corporate sector, a similar effect has been described, known as the volume–cost relationship. In this instance, the average cost of unit production decreases as total production increases. This association is thought to rely on the learning effect and economies of scale [7].
The volume–outcome relationship in health services has been thoroughly studied; however, few studies have examined the volume–cost relationship. Whereas the former focuses on aspects of health service quality, the latter has potential to support the regionalization of health services,
Copyright © 2017 Korea Centers for Disease Control and Prevention.
This is an open access article under the CC BY-NC-ND license (http://creativecommons.org/ licenses/by-nc-nd/4.0/).
Centers for Disease Control & Prevention
an important concept gaining substantial interest. Glasgow et al [8] reported that the identification of hospitals with superior patient outcomes for particular procedures could enable the regionalization of complex operations to provide the most effica-cious and cost-effective care. For example, in cases of complex surgical procedures that require expensive medical equipment and specialized skills, such as coronary artery bypass surgery and bone marrow or solid organ transplantation, the quality of care can be improved and costs can be reduced if certain hospitalizes specialize in those particular procedures, thereby accumulating more procedure-specific experience and knowledge. In support of this notion, hospitals that frequently perform complex surgical procedures have been shown to have lower associated costs [4,9].
Several studies have identified a trend of surgery costs de-creasing as the number of performed procedures increases, and this trend remains constant across demographic variables and diseases [2–4]. Furthermore, some reports have shown that the length of stay (LOS) per operation, a factor closely related with total cost, also decreases as the number of operations increases
[3,4]. While studies of this nature have been conducted in the past, they either focused only on one type of cancer surgery or were regionally limited to the United States or Europe. A recent study examined the volume–cost relationship for lung cancer resection in Asia [10]. However, that report considered only one type of procedure, making it difficult to generalize the relation-ship across cancer treatments.
Carey reported that costs per patient were determined by certain factors, including several major diagnoses, characteristics of hospitals and patients, and LOS. However, for any one disease, costs were most affected by LOS [11]. Thus, in this study, we ex-amined five major types of cancer surgical procedures and vari-ous factors that affect procedural costs and LOS.
MATERIALS AND METHODS
1. Databases
Using National Health Insurance (NHI) claim data, which covers almost the entire Korean population, we identified pa-tients who underwent the following cancer resections between 2002 and 2005: major pneumonectomy, colectomy, mastectomy, cystectomy, or esophagectomy. These data included the pay-ments for insurance-covered services, as well as patient socio-demographic information (gender, age, monthly insurance con-tribution, the residential area of all health service providers, and disease comorbidity) and other health-related information, such as specific surgical procedures performed and course of admis-sion. Prior to analysis, the personal identification number used
for data linkage was deleted. In addition, this study was a second-ary data analysis. For these reasons, the human research ethics committee of our institution did not have to review this study. 2. Patients and procedures
Admissions for each of the five cancer surgical procedures in our analysis were identified using appropriate procedural codes from the International Classification of Disease (ICD), 9th revi-sion, Clinical Modification (ICD-9-CM) [12]. In addition, ICD-9-CM codes for major cancer surgical procedures were modified for the Korean Electronic Data Interchange.
To ensure our data included only cancer resections and to increase the homogeneity of the study sample, we excluded patients whose file did not contain an accompanying cancer code related to the indexed procedure in the primary diagnosis. Secondary diagnostic codes were extracted to enumerate comor-bidity conditions, according to the Charlson comorcomor-bidity index, which has been validated as a good instrument to predict clinical outcomes, costs, and use of resources [13]. The monthly NHI contribution is income-based and serves as a reasonable proxy for income. Depending on whether the patients were admitted to the emergency department or the outpatient department, routes of admission were divided into emergency or non-emergency cases, respectively. All variables were either coded as categorical or dummy variables.
3. Outcome measures
The outcome variables were mean costs and LOS. These vari-ables were used to compare the relative use of resources among hospitals with differing volumes of cancer procedures. Using the National Health Insurance Corporation Input Price Indices, costs were defined as the cost per episode for surgery and were adjusted for inflation to 2005 premiums. LOS was defined as the period from index procedure to hospital discharge for the index admission. We also examined hospital standardized mortality ratios (HSMR) as an outcome variable of quality care for cancer procedures. The ratio was adjusted for other factors that affected mortality, such as age, gender, hospital stay duration, admission course, principal diagnosis, and comorbidities [14].
4. Hospital volume
The number of procedures performed at each hospital was determined using a unique hospital identification code. For each procedure, the hospitals were first ranked in order of increasing total volume as a continuous variable, after which volume cut-off points were selected to create volume groups with approximately equal numbers of patients. Hospital volume was stratified into quartiles (very high-, high-, low-, and very low-volume).
5. Statistical analyses
Descriptive analyses were performed to clarify the distribu-tions of patient demographics, hospital volume, and economic outcomes. The differences in patient characteristics were com-pared across hospital volume groups using the chi-squared sta-tistic for categorical variables. Bivariate analyses of covariance (ANCOVA) were performed to determine differences in costs and LOS between the four groups.
We used multiple linear regressions to examine the relation-ship between hospital volume and economic outcome, after adjusting for patient demographics and clinical information [15].
All statistical analyses pertaining to costs and LOS were based on the log-transformed data. The p-values < 0.05 indicated statistical significance. Data analyses were performed using the IBM SPSS Statistics software (ver. 22.0; IBM Co., Armonk, NY, USA).
RESULTS
1. Patient characteristics and clinical information
Between 2002 and 2005, 62,549 patients underwent the speci-fied types of cancer-related procedures at 535 hospitals. Table 1
shows the distribution of patient characteristics by hospital
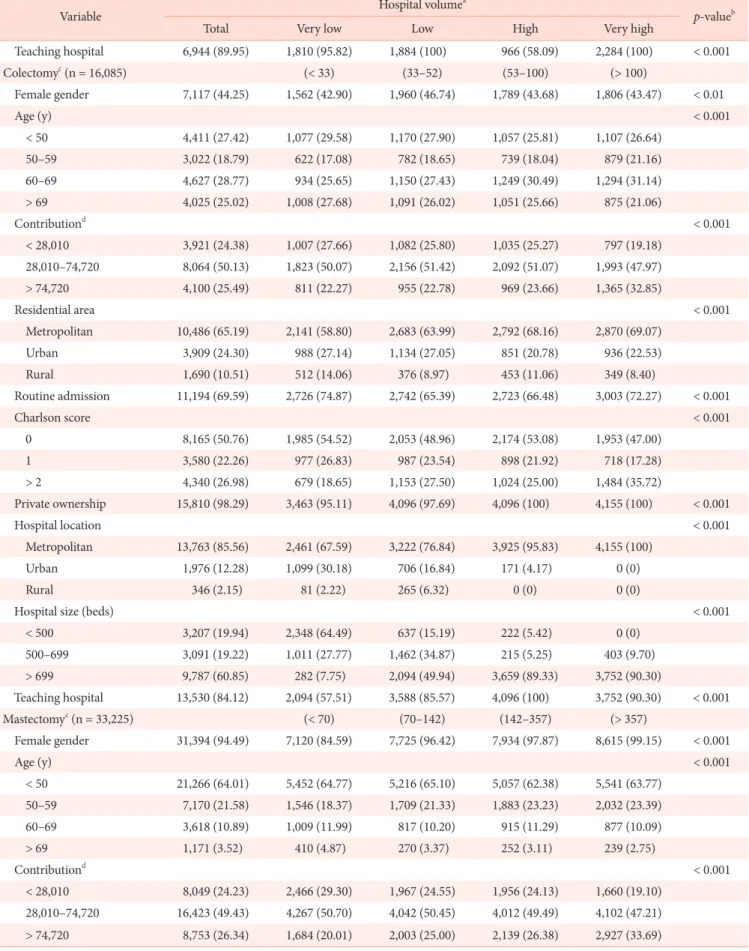
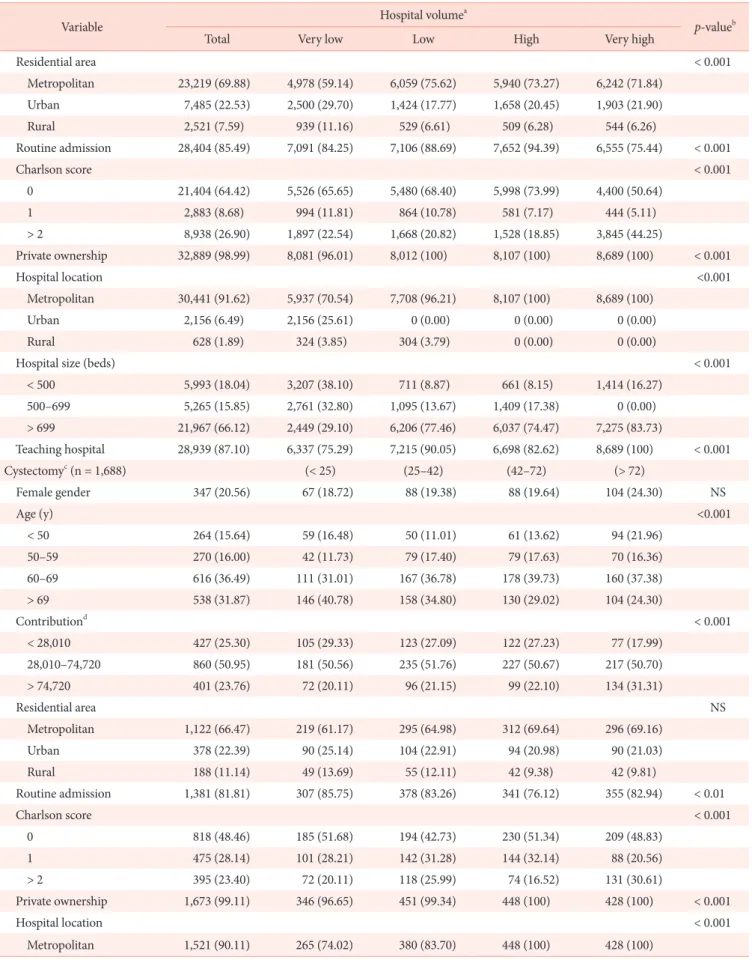
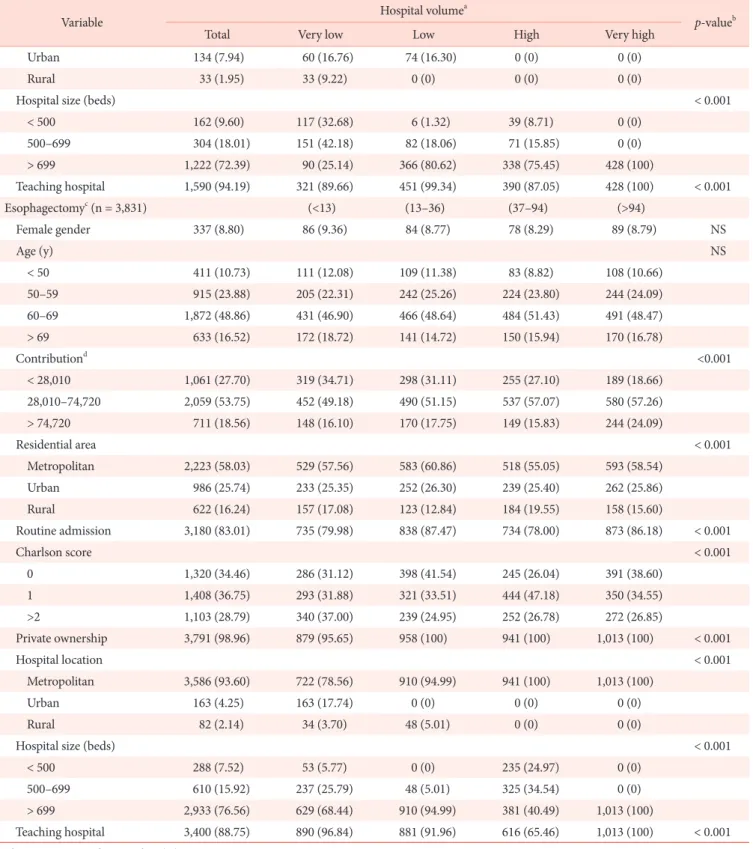
vol-Table 1. Characteristics of patients who underwent cancer surgery according to hospital volume
Variable Hospital volume
a
p-valueb
Total Very low Low High Very high
Pneumonectomyc (n = 7,720) (< 26) (26–50) (51–133) (> 133) Female gender 2,340 (30.31) 582 (30.81) 565 (29.99) 457 (27.48) 736 (32.22) < 0.05 Age (y) < 0.001 < 50 1,738 (22.51) 471 (24.93) 453 (24.04) 280 (16.84) 534 (23.38) 50–59 1,781 (23.07) 391 (20.70) 444 (23.57) 395 (23.75) 551 (24.12) 60–69 2,935 (38.02) 688 (36.42) 698 (37.05) 697 (41.91) 852 (37.30) > 69 1,266 (16.40) 339 (17.95) 289 (15.34) 291 (17.50) 347 (15.19) Contributiond < 0.001 < 28,010 1,781 (23.07) 558 (29.54) 480 (25.48) 387 (23.27) 356 (15.59) 28,010–74,720 3,942 (51.06) 944 (49.97) 1,030 (54.67) 861 (51.77) 1,107 (48.47) > 74,720 1,997 (25.87) 387 (20.49) 374 (19.85) 415 (24.95) 821 (35.95) Residential area < 0.001 Metropolitan 5,048 (65.39) 1,177 (62.31) 1,176 (62.42) 1,112 (66.87) 1,583 (69.31) Urban 1,838 (23.81) 473 (25.04) 493 (26.17) 387 (23.27) 485 (21.23) Rural 834 (10.80) 239 (12.65) 215 (11.41) 164 (9.86) 216 (9.46) Routine admission 6,537 (84.68) 1,571 (83.17) 1,432 (76.01) 1,485 (89.30) 2,049 (89.71) < 0.001 Charlson score < 0.001 0 3,277 (42.45) 784 (41.50) 907 (48.14) 693 (41.67) 893 (39.10) 1 1,786 (23.13) 556 (29.43) 522 (27.71) 387 (23.27) 321 (14.05) > 2 2,657 (34.42) 549 (29.06) 455 (24.15) 583 (35.06) 1,070 (46.85) Private ownership 7,653 (99.13) 1,822 (96.45) 1,884 (100) 1,663 (100) 2,284 (100) < 0.001 Hospital location < 0.001 Metropolitan 7,206 (93.34) 1,476 (78.14) 1,783 (94.64) 1,663 (100) 2,284 (100) Urban 338 (4.38) 338 (17.89) 0 (0) 0 (0) 0 (0) Rural 176 (2.28) 75 (3.97) 101 (5.36) 0 (0) 0 (0)
Hospital size (beds) < 0.001
< 500 371 (4.81) 185 (9.79) 0 (0) 186 (11.18) 0 (0)
500–699 1,118 (14.48) 612 (32.40) 0 (0) 506 (30.43) 0 (0)
Table 1. Continued
Variable Hospital volume
a
p-valueb
Total Very low Low High Very high
Teaching hospital 6,944 (89.95) 1,810 (95.82) 1,884 (100) 966 (58.09) 2,284 (100) < 0.001 Colectomyc (n = 16,085) (< 33) (33–52) (53–100) (> 100) Female gender 7,117 (44.25) 1,562 (42.90) 1,960 (46.74) 1,789 (43.68) 1,806 (43.47) < 0.01 Age (y) < 0.001 < 50 4,411 (27.42) 1,077 (29.58) 1,170 (27.90) 1,057 (25.81) 1,107 (26.64) 50–59 3,022 (18.79) 622 (17.08) 782 (18.65) 739 (18.04) 879 (21.16) 60–69 4,627 (28.77) 934 (25.65) 1,150 (27.43) 1,249 (30.49) 1,294 (31.14) > 69 4,025 (25.02) 1,008 (27.68) 1,091 (26.02) 1,051 (25.66) 875 (21.06) Contributiond < 0.001 < 28,010 3,921 (24.38) 1,007 (27.66) 1,082 (25.80) 1,035 (25.27) 797 (19.18) 28,010–74,720 8,064 (50.13) 1,823 (50.07) 2,156 (51.42) 2,092 (51.07) 1,993 (47.97) > 74,720 4,100 (25.49) 811 (22.27) 955 (22.78) 969 (23.66) 1,365 (32.85) Residential area < 0.001 Metropolitan 10,486 (65.19) 2,141 (58.80) 2,683 (63.99) 2,792 (68.16) 2,870 (69.07) Urban 3,909 (24.30) 988 (27.14) 1,134 (27.05) 851 (20.78) 936 (22.53) Rural 1,690 (10.51) 512 (14.06) 376 (8.97) 453 (11.06) 349 (8.40) Routine admission 11,194 (69.59) 2,726 (74.87) 2,742 (65.39) 2,723 (66.48) 3,003 (72.27) < 0.001 Charlson score < 0.001 0 8,165 (50.76) 1,985 (54.52) 2,053 (48.96) 2,174 (53.08) 1,953 (47.00) 1 3,580 (22.26) 977 (26.83) 987 (23.54) 898 (21.92) 718 (17.28) > 2 4,340 (26.98) 679 (18.65) 1,153 (27.50) 1,024 (25.00) 1,484 (35.72) Private ownership 15,810 (98.29) 3,463 (95.11) 4,096 (97.69) 4,096 (100) 4,155 (100) < 0.001 Hospital location < 0.001 Metropolitan 13,763 (85.56) 2,461 (67.59) 3,222 (76.84) 3,925 (95.83) 4,155 (100) Urban 1,976 (12.28) 1,099 (30.18) 706 (16.84) 171 (4.17) 0 (0) Rural 346 (2.15) 81 (2.22) 265 (6.32) 0 (0) 0 (0)
Hospital size (beds) < 0.001
< 500 3,207 (19.94) 2,348 (64.49) 637 (15.19) 222 (5.42) 0 (0) 500–699 3,091 (19.22) 1,011 (27.77) 1,462 (34.87) 215 (5.25) 403 (9.70) > 699 9,787 (60.85) 282 (7.75) 2,094 (49.94) 3,659 (89.33) 3,752 (90.30) Teaching hospital 13,530 (84.12) 2,094 (57.51) 3,588 (85.57) 4,096 (100) 3,752 (90.30) < 0.001 Mastectomyc (n = 33,225) (< 70) (70–142) (142 –357) (> 357) Female gender 31,394 (94.49) 7,120 (84.59) 7,725 (96.42) 7,934 (97.87) 8,615 (99.15) < 0.001 Age (y) < 0.001 < 50 21,266 (64.01) 5,452 (64.77) 5,216 (65.10) 5,057 (62.38) 5,541 (63.77) 50–59 7,170 (21.58) 1,546 (18.37) 1,709 (21.33) 1,883 (23.23) 2,032 (23.39) 60–69 3,618 (10.89) 1,009 (11.99) 817 (10.20) 915 (11.29) 877 (10.09) > 69 1,171 (3.52) 410 (4.87) 270 (3.37) 252 (3.11) 239 (2.75) Contributiond < 0.001 < 28,010 8,049 (24.23) 2,466 (29.30) 1,967 (24.55) 1,956 (24.13) 1,660 (19.10) 28,010–74,720 16,423 (49.43) 4,267 (50.70) 4,042 (50.45) 4,012 (49.49) 4,102 (47.21) > 74,720 8,753 (26.34) 1,684 (20.01) 2,003 (25.00) 2,139 (26.38) 2,927 (33.69)
Table 1. Continued
Variable Hospital volume
a
p-valueb
Total Very low Low High Very high
Residential area < 0.001 Metropolitan 23,219 (69.88) 4,978 (59.14) 6,059 (75.62) 5,940 (73.27) 6,242 (71.84) Urban 7,485 (22.53) 2,500 (29.70) 1,424 (17.77) 1,658 (20.45) 1,903 (21.90) Rural 2,521 (7.59) 939 (11.16) 529 (6.61) 509 (6.28) 544 (6.26) Routine admission 28,404 (85.49) 7,091 (84.25) 7,106 (88.69) 7,652 (94.39) 6,555 (75.44) < 0.001 Charlson score < 0.001 0 21,404 (64.42) 5,526 (65.65) 5,480 (68.40) 5,998 (73.99) 4,400 (50.64) 1 2,883 (8.68) 994 (11.81) 864 (10.78) 581 (7.17) 444 (5.11) > 2 8,938 (26.90) 1,897 (22.54) 1,668 (20.82) 1,528 (18.85) 3,845 (44.25) Private ownership 32,889 (98.99) 8,081 (96.01) 8,012 (100) 8,107 (100) 8,689 (100) < 0.001 Hospital location <0.001 Metropolitan 30,441 (91.62) 5,937 (70.54) 7,708 (96.21) 8,107 (100) 8,689 (100) Urban 2,156 (6.49) 2,156 (25.61) 0 (0.00) 0 (0.00) 0 (0.00) Rural 628 (1.89) 324 (3.85) 304 (3.79) 0 (0.00) 0 (0.00)
Hospital size (beds) < 0.001
< 500 5,993 (18.04) 3,207 (38.10) 711 (8.87) 661 (8.15) 1,414 (16.27) 500–699 5,265 (15.85) 2,761 (32.80) 1,095 (13.67) 1,409 (17.38) 0 (0.00) > 699 21,967 (66.12) 2,449 (29.10) 6,206 (77.46) 6,037 (74.47) 7,275 (83.73) Teaching hospital 28,939 (87.10) 6,337 (75.29) 7,215 (90.05) 6,698 (82.62) 8,689 (100) < 0.001 Cystectomyc (n = 1,688) (< 25) (25–42) (42–72) (> 72) Female gender 347 (20.56) 67 (18.72) 88 (19.38) 88 (19.64) 104 (24.30) NS Age (y) <0.001 < 50 264 (15.64) 59 (16.48) 50 (11.01) 61 (13.62) 94 (21.96) 50–59 270 (16.00) 42 (11.73) 79 (17.40) 79 (17.63) 70 (16.36) 60–69 616 (36.49) 111 (31.01) 167 (36.78) 178 (39.73) 160 (37.38) > 69 538 (31.87) 146 (40.78) 158 (34.80) 130 (29.02) 104 (24.30) Contributiond < 0.001 < 28,010 427 (25.30) 105 (29.33) 123 (27.09) 122 (27.23) 77 (17.99) 28,010–74,720 860 (50.95) 181 (50.56) 235 (51.76) 227 (50.67) 217 (50.70) > 74,720 401 (23.76) 72 (20.11) 96 (21.15) 99 (22.10) 134 (31.31) Residential area NS Metropolitan 1,122 (66.47) 219 (61.17) 295 (64.98) 312 (69.64) 296 (69.16) Urban 378 (22.39) 90 (25.14) 104 (22.91) 94 (20.98) 90 (21.03) Rural 188 (11.14) 49 (13.69) 55 (12.11) 42 (9.38) 42 (9.81) Routine admission 1,381 (81.81) 307 (85.75) 378 (83.26) 341 (76.12) 355 (82.94) < 0.01 Charlson score < 0.001 0 818 (48.46) 185 (51.68) 194 (42.73) 230 (51.34) 209 (48.83) 1 475 (28.14) 101 (28.21) 142 (31.28) 144 (32.14) 88 (20.56) > 2 395 (23.40) 72 (20.11) 118 (25.99) 74 (16.52) 131 (30.61) Private ownership 1,673 (99.11) 346 (96.65) 451 (99.34) 448 (100) 428 (100) < 0.001 Hospital location < 0.001 Metropolitan 1,521 (90.11) 265 (74.02) 380 (83.70) 448 (100) 428 (100)
Table 1. Continued
Variable Hospital volume
a
p-valueb
Total Very low Low High Very high
Urban 134 (7.94) 60 (16.76) 74 (16.30) 0 (0) 0 (0)
Rural 33 (1.95) 33 (9.22) 0 (0) 0 (0) 0 (0)
Hospital size (beds) < 0.001
< 500 162 (9.60) 117 (32.68) 6 (1.32) 39 (8.71) 0 (0) 500–699 304 (18.01) 151 (42.18) 82 (18.06) 71 (15.85) 0 (0) > 699 1,222 (72.39) 90 (25.14) 366 (80.62) 338 (75.45) 428 (100) Teaching hospital 1,590 (94.19) 321 (89.66) 451 (99.34) 390 (87.05) 428 (100) < 0.001 Esophagectomyc (n = 3,831) (<13) (13–36) (37–94) (>94) Female gender 337 (8.80) 86 (9.36) 84 (8.77) 78 (8.29) 89 (8.79) NS Age (y) NS < 50 411 (10.73) 111 (12.08) 109 (11.38) 83 (8.82) 108 (10.66) 50–59 915 (23.88) 205 (22.31) 242 (25.26) 224 (23.80) 244 (24.09) 60–69 1,872 (48.86) 431 (46.90) 466 (48.64) 484 (51.43) 491 (48.47) > 69 633 (16.52) 172 (18.72) 141 (14.72) 150 (15.94) 170 (16.78) Contributiond <0.001 < 28,010 1,061 (27.70) 319 (34.71) 298 (31.11) 255 (27.10) 189 (18.66) 28,010–74,720 2,059 (53.75) 452 (49.18) 490 (51.15) 537 (57.07) 580 (57.26) > 74,720 711 (18.56) 148 (16.10) 170 (17.75) 149 (15.83) 244 (24.09) Residential area < 0.001 Metropolitan 2,223 (58.03) 529 (57.56) 583 (60.86) 518 (55.05) 593 (58.54) Urban 986 (25.74) 233 (25.35) 252 (26.30) 239 (25.40) 262 (25.86) Rural 622 (16.24) 157 (17.08) 123 (12.84) 184 (19.55) 158 (15.60) Routine admission 3,180 (83.01) 735 (79.98) 838 (87.47) 734 (78.00) 873 (86.18) < 0.001 Charlson score < 0.001 0 1,320 (34.46) 286 (31.12) 398 (41.54) 245 (26.04) 391 (38.60) 1 1,408 (36.75) 293 (31.88) 321 (33.51) 444 (47.18) 350 (34.55) >2 1,103 (28.79) 340 (37.00) 239 (24.95) 252 (26.78) 272 (26.85) Private ownership 3,791 (98.96) 879 (95.65) 958 (100) 941 (100) 1,013 (100) < 0.001 Hospital location < 0.001 Metropolitan 3,586 (93.60) 722 (78.56) 910 (94.99) 941 (100) 1,013 (100) Urban 163 (4.25) 163 (17.74) 0 (0) 0 (0) 0 (0) Rural 82 (2.14) 34 (3.70) 48 (5.01) 0 (0) 0 (0)
Hospital size (beds) < 0.001
< 500 288 (7.52) 53 (5.77) 0 (0) 235 (24.97) 0 (0)
500–699 610 (15.92) 237 (25.79) 48 (5.01) 325 (34.54) 0 (0)
> 699 2,933 (76.56) 629 (68.44) 910 (94.99) 381 (40.49) 1,013 (100)
Teaching hospital 3,400 (88.75) 890 (96.84) 881 (91.96) 616 (65.46) 1,013 (100) < 0.001
Values are presented as number (%). NS, not significant.
aTo estimate average total hospital volume, we divided the observed Medicare volume (per year) by the proportion of Medicare patients undergoing each procedure (as determined by the Nationwide Inpatient Sample).
bAll p-values reflect two-sided comparisons within hospital volume groups, and were calculated using the chi-squared test. cCutoffs for hospital volume quartiles are reported in parentheses.
ume group. The criteria used to define the four strata of hospital volume varied noticeably according to procedure.
For all procedures with the exception of mastectomies, the majority of the patients were male. According to the hospital volume strata, most patients underwent procedures at very high-volume hospitals for cystectomies, whereas fewest patients un-derwent procedures at very low-volume hospitals for mastecto-mies. Regarding age, a large number of patients were aged 60–69 years for all procedures, except mastectomies, which had a high number of patients from the < 50 years age group. For cystecto-mies, there was a high number of very high-volume procedures in the lower age group. For most procedures, patients with lower monthly NHI contributions were more likely to undergo surgery at lower-volume hospitals. Similarly, residents of rural areas were more likely to have surgery at a low-volume hospital than resi-dents of more metropolitan areas. A comorbidity index score of > 2 tended to be more prevalent at high-volume hospitals. Fi-nally, most patients who underwent tumor resection at teaching hospitals were in metropolitan areas and private hospitals with more than 699 beds.
2. Costs
Costs also varied widely across procedures by hospital volume
(Table 2). The mean cost was lowest for mastectomies (1,934,027
Korean Won [KRW]) and highest for esophagectomies (8,825,781 KRW). There were also statistically significant associations
between volume and costs for all five procedures (p < 0.001). The mean cost for esophagectomies, pneumonectomies, and mastectomies were significantly higher at very low-volume hospitals as opposed to very high-volume hospitals (8,494,271 vs. 7,428,923 KRW, 5,466,067 vs. 4,788,979 KRW, 2,014,838 vs. 1,934,027 KRW, respectively; p < 0.001). Costs were lower in very high-volume hospitals than in very low-, low-, and high-volume hospitals for the three procedures (pneumonectomies, mastecto-mies, andesophagectomies), but higher in very and high-volume hospitals for the two other procedures (colectomies and cystectomies).
Table 3 shows regression estimates of the cost differences for
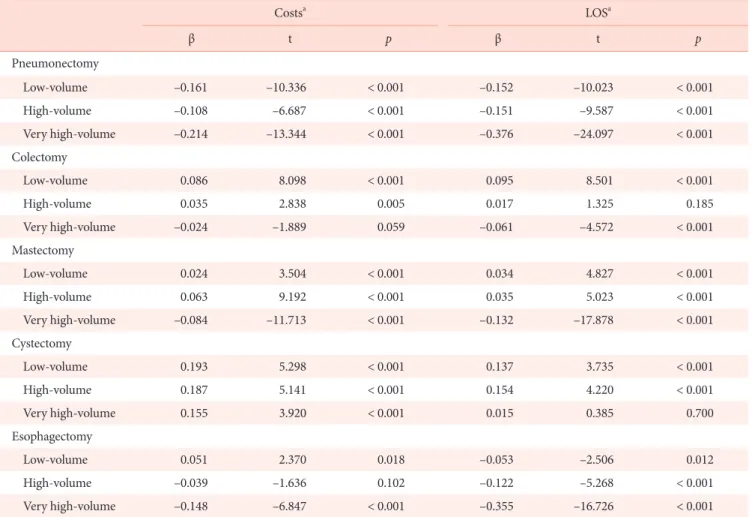
each cancer procedure by hospital volume, adjusting for patient and hospital characteristics. Low-, high-, and very high-volume hospitals performed pneumonectomies at lower costs than very low-volume hospitals (p < 0.001). Likewise, very high-volume hospitals performed mastectomies and esophagectomies at lower costs than very low-volume hospitals (p < 0.001).
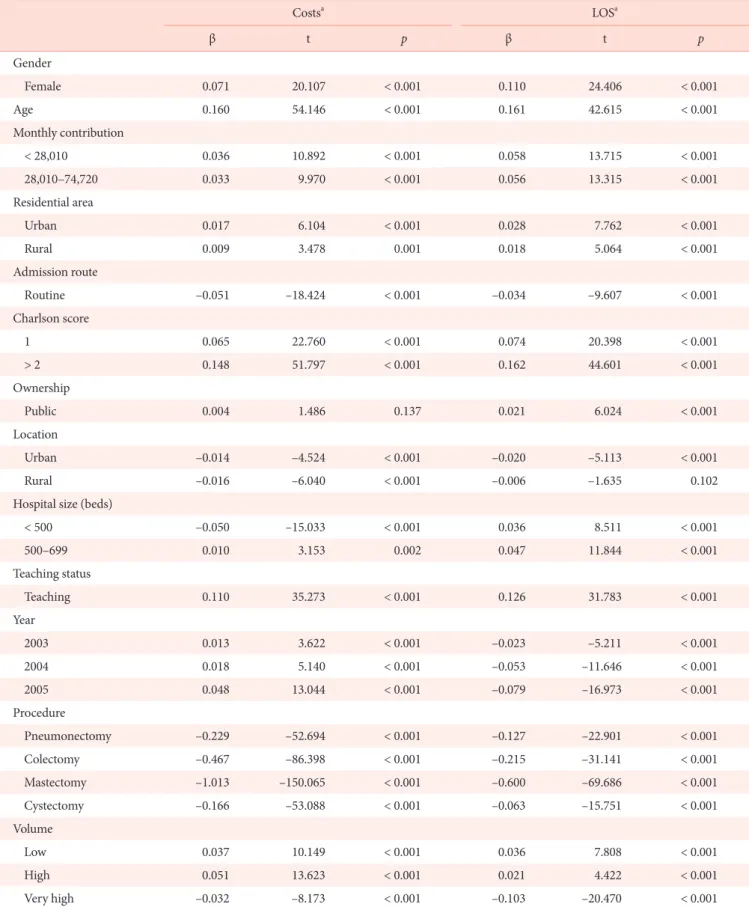
Regression analysis revealed that independent predictors of higher costs included female gender, older age, lower health in-surance contribution, non-metropolitan residence, emergency admission, a Charlson score > 2, public ownership, teaching hospitals, and hospitals with many beds (Table 4). In the cost re-gression model, hospital volume continually showed significant effects.
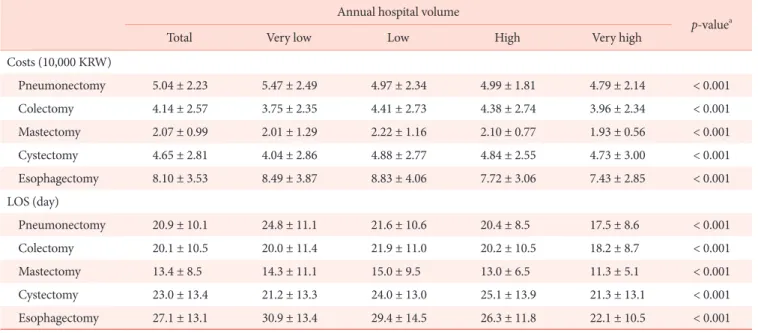
Table 2. Hospital costs and length of stay (LOS) for cancer surgery types by hospital volume Annual hospital volume
p-valuea
Total Very low Low High Very high
Costs (10,000 KRW) Pneumonectomy 5.04 ± 2.23 5.47 ± 2.49 4.97 ± 2.34 4.99 ± 1.81 4.79 ± 2.14 < 0.001 Colectomy 4.14 ± 2.57 3.75 ± 2.35 4.41 ± 2.73 4.38 ± 2.74 3.96 ± 2.34 < 0.001 Mastectomy 2.07 ± 0.99 2.01 ± 1.29 2.22 ± 1.16 2.10 ± 0.77 1.93 ± 0.56 < 0.001 Cystectomy 4.65 ± 2.81 4.04 ± 2.86 4.88 ± 2.77 4.84 ± 2.55 4.73 ± 3.00 < 0.001 Esophagectomy 8.10 ± 3.53 8.49 ± 3.87 8.83 ± 4.06 7.72 ± 3.06 7.43 ± 2.85 < 0.001 LOS (day) Pneumonectomy 20.9 ± 10.1 24.8 ± 11.1 21.6 ± 10.6 20.4 ± 8.5 17.5 ± 8.6 < 0.001 Colectomy 20.1 ± 10.5 20.0 ± 11.4 21.9 ± 11.0 20.2 ± 10.5 18.2 ± 8.7 < 0.001 Mastectomy 13.4 ± 8.5 14.3 ± 11.1 15.0 ± 9.5 13.0 ± 6.5 11.3 ± 5.1 < 0.001 Cystectomy 23.0 ± 13.4 21.2 ± 13.3 24.0 ± 13.0 25.1 ± 13.9 21.3 ± 13.1 < 0.001 Esophagectomy 27.1 ± 13.1 30.9 ± 13.4 29.4 ± 14.5 26.3 ± 11.8 22.1 ± 10.5 < 0.001
Values are presented as mean ± standard deviation. KRW, Korean Won.
3. Length of stay
LOS varied widely according to procedure (Table 2). The mean LOS was the shortest for mastectomies and longest for esophagec-tomies. In general, patients who underwent more complex cancer surgical procedures had a longer mean LOS than those who un-derwent less complex cancer surgical procedures. There were sta-tistically significant associations between volume and LOS for all five procedures (p < 0.001). Mean LOS decreased across volume strata for three procedures (pneumonectomies, mastectomies, and esophagectomies).
Volume was associated with meaningful differences in LOS for only a limited number of procedures. The largest differences occurred in esophagectomies and pneumonectomies, with a mean LOS of 8.9 days and 7.3, respectively, in very high-volume hospitals as compared to very low-volume hospitals. The mean LOS at very low-volume versus very high-volume hospitals dif-fered by more than one day for four procedures
(pneumonec-tomies, colec(pneumonec-tomies, mastec(pneumonec-tomies, and esophagectomies). LOS was shorter in high-volume hospitals for four procedures (pneu-monectomies, colectomies, mastectomies, and esophagectomies), but longer in high-volume hospitals for the other procedure (cys-tectomies).
Table 3 shows regression estimates of LOS differences for each
cancer procedure according to hospital volume, after adjusting for patient and hospital characteristics. Patients who underwent pneumonectomy and esophagectomy surgical procedures had shorter stays in low-, high-, and very high-volume hospitals than in very low-volume hospitals (p < 0.001). Likewise, mastectomy patients had shorter stays in very high-volume hospitals than in very low-volume hospitals (p < 0.001).
Multiple regression analysis revealed that independent pre-dictors of longer LOS included female gender, older age, lower health insurance contribution, non metropolitan residents, emer-gency admission, Charlson score > 2, public ownership, teaching hospitals, and hospitals with fewer beds (Table 4). The differences
Table 3. Costs and length of stay (LOS) of cancer surgical procedures according to hospital volume
Costsa LOSa β t p β t p Pneumonectomy Low-volume –0.161 –10.336 < 0.001 –0.152 –10.023 < 0.001 High-volume –0.108 –6.687 < 0.001 –0.151 –9.587 < 0.001 Very high-volume –0.214 –13.344 < 0.001 –0.376 –24.097 < 0.001 Colectomy Low-volume 0.086 8.098 < 0.001 0.095 8.501 < 0.001 High-volume 0.035 2.838 0.005 0.017 1.325 0.185 Very high-volume –0.024 –1.889 0.059 –0.061 –4.572 < 0.001 Mastectomy Low-volume 0.024 3.504 < 0.001 0.034 4.827 < 0.001 High-volume 0.063 9.192 < 0.001 0.035 5.023 < 0.001 Very high-volume –0.084 –11.713 < 0.001 –0.132 –17.878 < 0.001 Cystectomy Low-volume 0.193 5.298 < 0.001 0.137 3.735 < 0.001 High-volume 0.187 5.141 < 0.001 0.154 4.220 < 0.001 Very high-volume 0.155 3.920 < 0.001 0.015 0.385 0.700 Esophagectomy Low-volume 0.051 2.370 0.018 –0.053 –2.506 0.012 High-volume –0.039 –1.636 0.102 –0.122 –5.268 < 0.001 Very high-volume –0.148 –6.847 < 0.001 –0.355 –16.726 < 0.001
aAdjusted for age, gender, contribution, residential area, inpatient course, comorbidity, ownership, hospital location, beds, teaching hospital status, and year. The reference group for hospital volume was very low-volume hospitals.
Table 4. Multiple regression analysis of costs and length of stay (LOS) according to clinical and demographic predictors Costsa LOSa β t p β t p Gender Female 0.071 20.107 < 0.001 0.110 24.406 < 0.001 Age 0.160 54.146 < 0.001 0.161 42.615 < 0.001 Monthly contribution < 28,010 0.036 10.892 < 0.001 0.058 13.715 < 0.001 28,010–74,720 0.033 9.970 < 0.001 0.056 13.315 < 0.001 Residential area Urban 0.017 6.104 < 0.001 0.028 7.762 < 0.001 Rural 0.009 3.478 0.001 0.018 5.064 < 0.001 Admission route Routine –0.051 –18.424 < 0.001 –0.034 –9.607 < 0.001 Charlson score 1 0.065 22.760 < 0.001 0.074 20.398 < 0.001 > 2 0.148 51.797 < 0.001 0.162 44.601 < 0.001 Ownership Public 0.004 1.486 0.137 0.021 6.024 < 0.001 Location Urban –0.014 –4.524 < 0.001 –0.020 –5.113 < 0.001 Rural –0.016 –6.040 < 0.001 –0.006 –1.635 0.102
Hospital size (beds)
< 500 –0.050 –15.033 < 0.001 0.036 8.511 < 0.001 500–699 0.010 3.153 0.002 0.047 11.844 < 0.001 Teaching status Teaching 0.110 35.273 < 0.001 0.126 31.783 < 0.001 Year 2003 0.013 3.622 < 0.001 –0.023 –5.211 < 0.001 2004 0.018 5.140 < 0.001 –0.053 –11.646 < 0.001 2005 0.048 13.044 < 0.001 –0.079 –16.973 < 0.001 Procedure Pneumonectomy –0.229 –52.694 < 0.001 –0.127 –22.901 < 0.001 Colectomy –0.467 –86.398 < 0.001 –0.215 –31.141 < 0.001 Mastectomy –1.013 –150.065 < 0.001 –0.600 –69.686 < 0.001 Cystectomy –0.166 –53.088 < 0.001 –0.063 –15.751 < 0.001 Volume Low 0.037 10.149 < 0.001 0.036 7.808 < 0.001 High 0.051 13.623 < 0.001 0.021 4.422 < 0.001 Very high –0.032 –8.173 < 0.001 –0.103 –20.470 < 0.001
aThe reference groups for categorical variables were male gender, monthly contribution > 74,720, metropolitan residential area, emergency admis-sion, Charlson score = 0, private hospital ownership, metropolitan hospital location, beds > 699, non-teaching hospital, year 2002, esophagectomy procedure, very low-volume.
between very low-volume and very high-volume hospital were statistically significant.
4. Costs and hospital standardized mortality ratios
We examined the relationship between the mean hospital’s
cost and HSMR to determine whether there was a systematic re-lationship between cost and quality of care. We found no associa-tion (Figure 1). Mean cost (10,000 KR W) HSMR
Colectomy (correlation coefficient 0.06, -value .3)p .00 100.00 200.00 300.00 400.00 100 700 600 500 400 300 200 Mean cost (10,000 KR W) 0 HSMR 1,400 1,200 1,000 800 600 400 100 200 300 400 500 Mean cost (10,000 KR W) Mean cost (10,000 KR W) HSMR 0 50 350 300 250 200 150 100 50 100 150 200
Mastectomy (correlation coefficient 1.64, -value .3)p
Esophagectomy (correlation coefficient 0.03, -value .8)p
Cystectomy (correlation coefficient 0.09, -value .5)p 0 HSMR 100 200 300 400 800 600 400 200 HSMR
Pneumonectomy (correlation coefficient 0.12, -value .2)p
Mean cost (10,000 ) KR W 0 200 800 700 600 500 400 300 50 100 150 200 250
Figure 1. Hospital costs versus hospital standardized mortality ratio (HSMR).
DISCUSSION
Consistent with previously published data, we showed that the volume of cancer surgical procedures performed by hospitals is statistically associated with costs and LOS [3–5]. Specifically, patients treated at very high-volume hospitals had lower costs and LOS as compared to very low-volume hospitals, after case-mix adjustment. When the results were analyzed for each of the different types of cancer surgeries, a consistent trend of lower costs and LOS at higher-volume hospitals was found. For four of the five procedures, LOS and costs were significantly lower in very high-volume hospitals as compared to very low-volume hospitals. However, this was not shown for cystectomies. In ad-dition, for mastectomies and colectomies, the reverse was seen for and high-volume hospitals as compared to very low-volume hospitals. In our study, using the low-volume cut-off points approach, cancers with a high risk for surgical procedures, such as pneumonectomies and esophagectomies were associated with significantly lower costs and LOS in very high-volume hospitals as compared to very low-volume hospitals. However, in cancers with a low risk for surgical procedures, such as mastectomies and colectomies, low- and high-volume hospitals are thought to have no significant difference, with the volume cut-off points falling within the ‘gray zone’. For this reason, we performed an addi-tional p trend analysis to verify the significance of linearity. This result of a p trend < 0.05 suggests that the linear trend is statisti-cally significant for colectomies (p for trend < 0.001), mastecto-mies (p for trend < 0.001), and cystectomastecto-mies (p for trend = 0.088). Compared to very low-volume hospitals, pneumonectomies were 16.1%, 10.8%, and 21.4% less costly in low , high , and very high-volume hospitals, respectively, and mastectomies and esopha-gectomies were 8.4% and 14.8% less costly in very high-volume hospitals, respectively. In addition, relative to very low-volume hospitals, the LOS for pneumonectomies was 15.2%, 15.1%, and 37.6% shorter in low-, high-, and very high-volume hospitals, respectively. Furthermore, relative to very low-volume hospitals, the LOS for colectomies and mastectomies was 6.1% and 13.2% shorter in very high-volume hospitals, respectively, and the LOS for esophagectomies was 5.3%, 12.2%, and 35.5% shorter in low-, high-, and very high-volume hospitals, respectively.
These relationships can be explained by the learning effect theory, as presented in previous reports. This theory states that increasing the number of treatments leads to a reduction in costs and LOS because of improved efficiency in early medical deci-sions, leading to fewer complications and shortened LOS in high-volume hospitals [1,4,9]. However, in addition to these factors, high-volume hospitals in Korea have a tendency to encourage early discharge by switching patients to home care in an effort
to increase the turnover rate of hospital beds. This tendency is a characteristic of the Korean medical system and appears to have contributed to decreased LOS at high-volume hospitals, which, in turn, lowers costs.
Multivariate regression was used to rank variables according to their strength of association with the outcome. Increased age, female sex, non metropolitan residents, emergency admission, increased Charlson score, publicly-owned hospitals, and teach-ing hospitals were significantly associated with higher costs and a longer LOS. These findings are generally consistent with previous studies that used clinical data to identify preoperative determi-nants of total or postoperative costs and LOS [4,16–18].
Initially, we expected costs and LOS to be lower for the vul-nerable populations, but this study showed that costs and LOS generally increased among the vulnerable populations. This correlation seems to be because elderly and low-income families in rural areas generally have a worse health condition as com-pared to other groups, thereby contributing to higher medical demands. Considering this and the limited availability of family members to care for sick relatives, even an unnecessary hospi-talization requires a long period of time. This could account for the increasing tendency of costs and LOS among the vulnerable populations of this study [19,20].
Contrast to the popular belief that hospital ownership is a ma-jor factor in determining the type of treatment, and that costs of treatment are cheaper at public hospitals, this study showed that costs and LOS were higher at public hospitals. It seems that the operation of Korean public hospitals is not very different from that of private hospitals, and the longer LOS indicates a problem in effective management of available beds. Further, this study considered only the health insurance payment for treatment, ex-cluding any uncovered amounts. This could have caused the costs to be higher at public hospitals per episode, since a longer LOS may reflect an attempt to maintain hospital income by increas-ing bed occupation. Public hospitals have a greater probability of prolonging hospitalization for the same surgical procedures.
Although it is known that costs of hospitalization increase as the number of beds at a hospital increases, this study showed that it was not always the case in hospitals with more than a specific number of beds. After controlling for other variables and catego-rizing the number of beds, we found that costs decreased even when LOS increased in hospitals with fewer than 500 beds. In addition, costs increased as LOS increased in hospitals with more than 500 beds. This can be explained by economies of scale, with revenue decreasing as the average costs increase in hospitals with more than a specific number of beds. A majority of the previous studies on economies of scale have reported that there are certain economies of scale in hospitals [21,22]. In the case of Korea, the
average cost increases significantly in hospitals with more than 450 beds, which, in turn, decreases revenue. Reports show that medical revenue can increase by shortening the LOS in an effort to increase the turnover rate of beds [23].
Hospitals with similar costs or LOS may differ in how re-sources are used during hospitalization, and intensity of care is known to differ between teaching and non teaching hospitals [15]. In general, patients treated at teaching hospitals tend to receive more diagnostic tests and spend more time in the intensive care unit [5].
As expected, patients who underwent complex cancer surgical procedures, such as esophagectomies, had significantly higher costs and a longer LOS than those who underwent less complex surgical procedures, such as colectomies and mastectomies.
Our study has some limitations. First, we excluded Medicaid beneficiaries, who account for approximately 3.1% of all Korean residents, because the NHI claims database did not provide suf-ficient information regarding these claimants. Second, we used an administrative claims database that lacked information about cancer specific clinical severity, such as disease stage and tumor size; thus, some residual confounding due to these covariates is possible [24,25]. However, we minimized this problem by only including patients who underwent major surgery; thus, the study population individuals were likely to be at similar cancer stages. Third, because the study was based on limited cross-sectional re-search using data from 2002 to 2005, there are limits to
general-izing the observed relationships. Thus, there is a need to confirm our findings with additional studies across different time periods and in-depth serial research over time. Despite these limitations, our results have important implications from the health policy perspective. This is a population-level description of economic outcomes and the factors, including volume, that impact costs and LOS after cancer surgery in an Asian country. In addition, this study provide useful information about costs and treatment quality for patients selecting a hospital for a particular cancer surgery.
CONFLICTS OF INTEREST
No potential conflict of interest relevant to this article was re-ported.
ACKNOWLEDGMENTS
This work was supported by a National Research Foundation of Korea (NRF) grant, funded by the Korea government (MSIP) (No. 2016R1A2B4011045); the National R&D Program for Can-cer Control (No. 1020010); and the Ministry of Health and Wel-fare, Korea (administrative support).
REFERENCES
1. Hillner BE, Smith TJ, Desch CE. Hospital and physician volumeor specialization and outcomes in cancer treatment: importance in quality of cancer care. J Clin Oncol 2000;18:2327-40. https://doi. org/10.1200/jco.2000.18.11.2327
2. Ho V, Aloia T. Hospital volume, surgeon volume, and patient costs for cancer surgery. Med Care 2008;46:718-25. https://doi. org/10.1097/MLR.0b013e3181653d6b
3. Dimick JB, Cattaneo SM, Lipsett PA, et al. Hospital volume is related to clinical and economic outcomes of esophageal resection in Mary-land. Ann Thorac Surg 2001;72:334-9; discussion 339-41. https:// doi.org/10.1016/S0003-4975(01)02781-3
4. Swisher SG, Deford L, Merriman KW, et al. Effect of operative vol-ume on morbidity, mortality, and hospital use after esophagectomy for cancer. J Thorac Cardiovasc Surg 2000;119:1126-34. https://doi. org/10.1067/mtc.2000.105644
5. Goodney PP, Stukel TA, Lucas FL, et al. Hospital volume, length of stay, and readmission rates in high-risk surgery. Ann Surg 2003;238:161-7. https://doi.org/10.1097/01.SLA.0000081094.66659. c3
6. Laffel GL, Barnett AI, Finkelstein S, et al. The relation between experience and outcome in heart transplantation. N Engl J Med 1992;327:1220-5. https://doi.org/10.1056/NEJM199210223271707 7. Woods JR, Saywell RM Jr, Nyhuis AW, et al. The learning curve and
the cost of heart transplantation. Health Serv Res 1992;27:219-38. 8. Glasgow RE, Showstack JA, Katz PP, et al. The relationship between
hospital volume and outcomes of hepatic resection for hepatocel-lular carcinoma. Arch Surg 1999;134:30-5. https://doi.org/10.1001/ archsurg.134.1.30
9. Begg CB, Cramer LD, Hoskins WJ, et al. Impact of hospital volume on operative mortality for major cancer surgery. JAMA 1998;280: 1747-51.
10. Lien YC, Huang MT, Lin HC. Association between surgeon and hos-pital volume and in-hoshos-pital fatalities after lung cancer resections: the experience of an Asian country. Ann Thorac Surg 2007;83:1837-43. https://doi.org/10.1016/j.athoracsur.2006.12.008
11. Carey K. Hospital length of stay and cost: a multilevel modeling analysis. Health Serv Outcome Res Methodol 2002;3:41-56. https:// doi.org/10.1023/A:1021530924455
12. Centers for Disease Control and Prevention. International classifica-tion of diseases, ninth revision, clinical modificaclassifica-tion (ICD-9-CM) [Internet]. Atlanta: Centers for Disease Control and Prevention; 2005 [updated 2013 June 18; cited 2016 Jan 7]. Available from: http:// www.cdc.gov/nchs/icd/icd9cm.htm.
13. Charlson ME, Pompei P, Ales KL, et al. A new method of clas-sifying prognostic comorbidity in longitudinal studies: develop-ment and validation. J Chronic Dis 1987;40:373-83. https://doi. org/10.1016/0021-9681(87)90171-8
14. Jarman B, Bottle A, Aylin P, et al. Monitoring changes in hospi-tal standardised morhospi-tality ratios. BMJ 2005;330:329. https://doi. org/10.1136/bmj.330.7487.329
15. Sicras-Mainar A, Navarro-Artieda R, Blanca-Tamayo M, et al. The relationship between effectiveness and costs measured by a risk-adjusted case-mix system: multicentre study of Catalonian population data bases. BMC Public Health 2009;9:202. https://doi. org/10.1186/1471-2458-9-202
16. Rosenthal GE, Harper DL, Quinn LM, et al. Severity-adjusted mortality and length of stay in teaching and nonteaching hospitals. Results of a regional study. JAMA 1997;278:485-90. https://doi. org/10.1001/jama.1997.03550060061037
17. Lee KT, Chang WT, Huang MC, et al. Influence of surgeon volume on clinical and economic outcomes of laparoscopic cholecystectomy. Dig Surg 2004;21:406-12. https://doi.org/10.1159/000082334 18. Taub DA, Miller DC, Cowan JA, et al. Impact of surgical
vol-ume on mortality and length of stay after nephrectomy. Urology 2004;63:862-7. https://doi.org/10.1016/j.urology.2003.11.037 19. Kim CW, Lee SY, Hong SC. Equity in utilization of cancer inpatient
services by income classes. Health Policy 2005;72:187-200. https:// doi.org/10.1016/j.healthpol.2004.03.009
20. Kim SY, Park JH, Kim SG, et al. Disparities in utilization of high-volume hospitals for cancer surgery: results of a Korean popula-tion-based study. Ann Surg Oncol 2010;17:2806-15. https://doi. org/10.1245/s10434-010-1133-x
21. Cohen HA. Variations in cost among hospitals of different sizes. Southern Econ J 1967;33:355-66. https://doi.org/10.2307/1055117 22. Long MJ, Ament RP, Dreachslin JL, et al. A reconsideration of
economies of scale in the health care field. Health Policy 1985;5:25-44. https://doi.org/10.1016/0168-8510(85)90064-8
23. Chun KH, Cho WH, Kim YK. An empirical study on the economies of scale of hospital service in Korea. Korean J Health Policy Adm 1994;4:107-22.
24. Birkmeyer JD, Siewers AE, Finlayson EV, et al. Hospital volume and surgical mortality in the United States. N Engl J Med 2002;346:1128-37. https://doi.org/10.1056/NEJMsa012337
25. Aranda MA, McGory M, Sekeris E, et al. Do racial/ethnic disparities exist in the utilization of high-volume surgeons for women with ovar-ian cancer? Gynecol Oncol 2008;111:166-72. https://doi.org/10.1016/ j.ygyno.2008.08.009