Original article
GEMiCCL: mining genotype and expression data
of cancer cell lines with elaborate visualization
Inhae Jeong
1,†, Namhee Yu
2,†, Insu Jang
3,†, Yukyung Jun
4, Min-Seo
Kim
3, Jinhyuk Choi
3, Byungwook Lee
3,* and Sanghyuk Lee
1,2,4,*
1Department of Bio-Information Science, Ewha Womans University, Seoul 03760, Republic of Korea,
2Department of Life Science, Ewha Womans University, Seoul 03760, Republic of Korea,
3Korean
Research Institute of Bioscience and Biotechnology, Korean Bioinformation Center, Daejeon 34141,
Republic of Korea and
4Ewha Research Center for Systems Biology, Ewha Womans University, Seoul
03760, Republic of Korea
*Corresponding author: Tel:þ82 2 3277 2888; Fax: þ82 2 3277 6809; Email: [email protected], Correspondence may also be addressed to Byungwook Lee. Tel:þ82 42 879 8531; Fax: þ82 42 879 8519; Email: [email protected]
†
These authors contributed equally to this work.
Citation details: Jeong, I., Yu, N., Jang, I. et al. GEMiCCL: mining genotype and expression data of cancer cell lines with elaborate visualization. Database (2018) Vol. 2018: article ID bay041; doi:10.1093/database/bay041
Received 4 December 2017; Revised 23 March 2018; Accepted 5 April 2018
Abstract
Cancer cell lines are essential components for biomedical research. However, proper
choice of cell lines for experimental purposes is often difficult because genotype and/or
expression data are missing or scattered in diverse resources. Here, we report Gene
Expression and Mutations in Cancer Cell Lines (GEMiCCL), an online database of human
cancer cell lines that provides genotype and expression information. We have collected
mutation, gene expression and copy number variation (CNV) data from three
representa-tive databases on cell lines—Cancer Cell Line Encyclopedia , Catalogue of Somatic
Mutations in Cancer and NCI60. In total, GEMiCCL includes 1406 cell lines from 185
can-cer types and 29 tissues. Gene expression, mutation and CNV information are available
for 1304, 1334 and 1365 cell lines, respectively. We removed batch effects due to different
microarray platforms using the ComBat software and re-processed the entire gene
ex-pression and SNP chip data. Cell line names and clinical information were standardized
using Cellosaurus from ExPASy. Our user interface supports cell line search, gene
search, browsing for specific molecular characteristics and complex queries-based on
Boolean logic rules. We also implemented many interactive features and user-friendly
visualizations. Providing molecular characteristics and clinical information, we believe
that GEMiCCL would be a valuable resource for biomedical research for functional or
screening studies.
Database URL: GEMiCCL is available at https://www.kobic.kr/GEMICCL/
VCThe Author(s) 2018. Published by Oxford University Press. Page 1 of 8
This is an Open Access article distributed under the terms of the Creative Commons Attribution License (http://creativecommons.org/licenses/by/4.0/), which permits unrestricted reuse, distribution, and reproduction in any medium, provided the original work is properly cited.
(page number not for citation purposes) doi: 10.1093/database/bay041
Original article
Introduction
Cell lines are widely used in a variety of biomedical studies because of their unlimited supply, homogeneous character-istics, convenience and cost-effectiveness. Thousands of cell lines are commercially available from public and pri-vate resources such as ATCC and Sigma-Aldrich. They are routinely used for various purposes ranging from testing compound toxicity to production of eukaryotic proteins in vitro. Thus, cell lines are firmly established as an essen-tial component of drug development.
Many immortalized cell lines originate from cancer cells. Both clinical and molecular characteristics are important in selecting cell lines suitable for a study design. Several attempts have been made to gather clinical information on
frequently used cell lines (1, 2). Cellosaurus from ExPASy
aims to be a knowledge resource on cell lines by providing extensive curated information that includes cell line names (recommended and synonyms), species, diseases, short tan-dem repeat, categories, publications and cross-references
(3). Among the existing collection of databases with
molec-ular information, CellLineNavigator provides mRNA
ex-pression information for a limited number of cell lines (4).
In line with the increasing importance of molecular characteristics of cell lines, several groups have performed large-scale genomic projects on cancer cell lines. Two nota-ble examples are the Cancer Cell Line Encyclopedia
(CCLE) project (5) by Broad-Novartis collaboration and
the Sanger’s Catalogue of Somatic Mutations in Cancer
(COSMIC) cell lines project (6), which independently
yielded genetic and expression data for about 1000 cell lines. Although two thirds of their entries overlap, direct comparison is difficult because of their platform difference. Inefficient data visualization is another limiting factor for general users since CCLE was developed mostly for testing drug sensitivity and COSMIC was focused on somatic
mutations. The canSAR database (7) maintains cell line
in-formation with mutation, copy number variation (CNV), expression data collected from COSMIC and NCI60, but no visualization or comparison is supported.
Prior knowledge of molecular and clinical characteris-tics including genetic abnormalities would allow more in-formed choice of cell lines in biological experiments and drug testing. Moreover, molecular information may be helpful in authentication and quality control of cell lines
(8). Therefore, there is an immediate need for a
compre-hensive resource that provides molecular and clinical infor-mation in a unified manner. Gene Expression and Mutations in Cancer Cell Lines (GEMiCCL) integrated three representative genomic data resources to obtain gene expression, mutation and copy number alteration in-formation. It covers the largest number of cancer cell lines
to date, and our web interface supports diverse types of searches, browsing and comparison with intuitive visuali-zation and interactive features.
Materials and methods
Cell line information
We standardized all cell line names as downloaded from the Cellosaurus (ftp://ftp.expasy.org/databases/cellosaurus)
database (3). Disease names were selected from the MeSH
terms, and tissue names were chosen using information provided by the COSMIC and CCLE databases.
Mutation information
Since several databases did not provide raw sequencing data, we collected mutation information as provided from the original databases—COSMIC (CellLinesCodingMuts. vcf.gz file at http://cancer.sanger.ac.uk/cell_lines/down load, Illumina exome sequencing), CCLE (CCLE_hybrid_
capture1650_HGNC_info_2012.02.20.txt file from
https://portals.broadinstitute.org/ccle/data, hybrid capture sequencing) and NCI60 (DNA: Sanger sequencing option at https://discover.nci.nih.gov/cellminer/loadDownload.do, Sanger and exome sequencing).
Gene expression data analysis
Original microarray data were downloaded from COSMIC (https://www.ebi.ac.uk/arrayexpress/experiments/E-MTAB-3610, Affymetrix hg U219 array), CCLE (https://www.ncbi. nlm.nih.gov/geo/query/acc.cgi? acc¼GSE36133, Affymetrix hg U133 plus 2.0 array) and NCI60 (https://www.ncbi.nlm. nih.gov/geo/query/acc.cgi? acc¼GSE32474, Affymetrix hg
U133 plus 2.0 array). We used the Affy R package (9) for
RMA normalization and the hg19 genome for gene annota-tion. We further removed batch effects using the ComBat
software (10). To compare gene expression values for the
same cell line among three data sources, we calculated per-centile values of gene expression for visualization.
CNV data analysis
CNV values were obtained from SNP chip data for all three resources. We downloaded raw CEL files from the CCLE (https://www.ncbi.nlm.nih.gov/geo/query/acc. cgi? acc¼GSE36138, SNP array 6.0) and NCI60 (https:// www.ncbi.nlm.nih.gov/geo/query/acc.cgi? acc¼GSE32264, Affymetrix GeneChip Human mapping 500 K array set) websites. COSMIC only provided processed results; thus, we downloaded the final results from the website
Page 2 of 8 Database, Vol. 2018, Article ID bay041
(cell_lines_copy_number.csv file at http://cancer.sanger.ac. uk/cell_lines/download). Raw CEL files were processed
us-ing the PennCNV-Affy package (11) to obtain LRR (log R
ratio) and BAF (B allele frequency) values. Then the CBS al-gorithm (12) in the DNAcopy R package was used for segmentation. Again, hg19 genome was used for gene an-notation. To detect copy number aberrations, we sorted out the copy number values of all genes and identified two inflection points after LOESS curve fitting. Then, genes in the bottom and top 50 percentile beyond the inflection points were designated as copy number deletions and amplifications, respectively.
Results
System overview
GEMiCCL integrated three genomic resources for cell
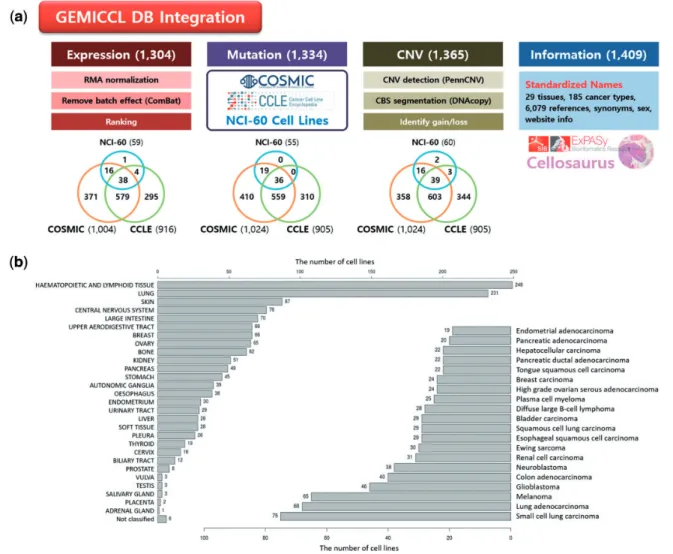
lines—COSMIC, CCLE, and NCI60.Figure 1shows data
types and statistics for each source database. Cell line
names, tissues, diseases and cancer types were integrated via Cellosaurus. Overall, GEMiCCL covers gene expres-sion, mutation and copy number data for 1304, 1334 and 1365 cell lines, respectively. The Venn diagrams show the number of cell lines with the corresponding data type from each resource, where COSMIC and CCLE are the two dominant contributors. The distribution of cell lines
across tissues and cancer types is shown in Figure 1b,
where cell lines from hematopoietic and lung cancers were most frequent. COSMIC and CCLE were the largest contributors, with almost half of the cell line entries hav-ing independent duplicate information from multiple resources.
One of the important advantages of GEMiCCL is that it allows users to compare molecular characteristics from dif-ferent resources, which is only possible after removing batch effects and reprocessing raw data. In addition, whereas the original resources provide raw data (numbers) in a tabular format, our web interface supports elaborate
Figure 1. Overview of GEMiCCL database. (a) Data types and statistics according to source databases. Numbers in the parenthesis and the Venn dia-gram indicate the number of cell lines with relevant information. Gene expression and copy number data were reprocessed with our own pipelines as summarized. (b) Distribution of cell lines across 29 tissue types and top 20 cancer types.
searches/browsing with molecular output characteristics visualized in intuitive graphics. For example, smart searches like ‘melanoma cell lines with BRAF mutation’ or ‘lung cancer cell lines with high EGFR expression’ can be easily achieved by Boolean logic queries.
Comparison of different DB sources
Each resource has varying platforms (e.g. microarray ver-sions) and analysis methods. This leads to source-dependent batch effects, making direct comparison across different resources almost impossible. Whenever possible, we analyzed the raw data ourselves using our own pipe-lines and applied a statistical method to remove batch effects as indicated in the Materials and methods section.
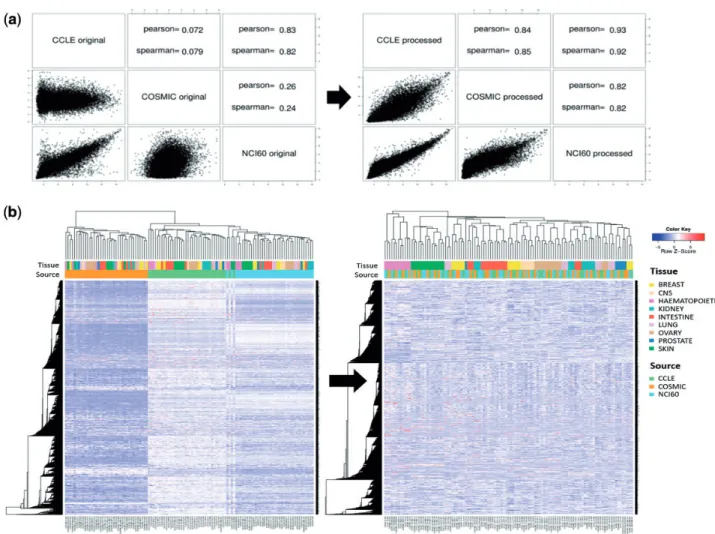
Gene expression microarray data were available from all three resources. They were processed using a standard protocol for Affymetrix chips (i.e. Affy R package).
Figure 2ashows the correlation of gene expression values
for the A-549 cell line among the three resources.
Reasonable agreement was obtained only after removing batch effects with the ComBat program. Note that CCLE and NCI60 data showed higher correlation probably be-cause they were obtained from the same microarray ver-sion (hg U133 plus 2.0). Clustering of cell lines based on gene expression data yielded the same conclusion. As
shown inFigure 2b, cell lines were grouped by source
data-base before removing batch effects, whereas they were grouped by tissue type after applying the ComBat pro-gram. Thus, direct comparison was possible only after re-moving batch effects.
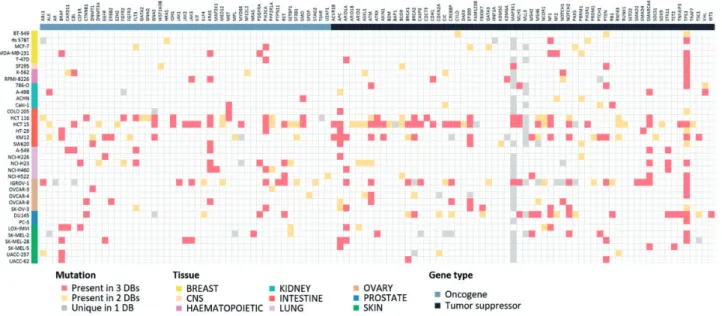
Mutation information is probably of uttermost interest. Because of unavailability of raw sequencing data, we col-lected and compared the final results from the source data-bases. Differences in sequencing and analysis details are expected to yield somewhat different mutation profiles. For 36 cell lines where all three resources report mutation
data, we show the comparison plot in Figure 3 for 125
driver genes selected by Vogelstein and coworkers (13).
About 214 (54.5%) mutations showed agreement in all
Figure 2. Batch effect in gene expression data. (a) Correlation plots and coefficients for gene expression data of A-549 cell line from three different resources. Left and right figures were obtained before and after removing batch effect with ComBat program. (b) Hierarchical clustering of gene ex-pression data for 38 cell lines before and after removing batch effect. Pearson correlation coefficient and complete linkage were used in clustering.
Page 4 of 8 Database, Vol. 2018, Article ID bay041
three resources, but 110 (28.0%) mutations had agreement in only two resources. 69 (17.6%) mutations had
resource-specific mutations. BRAF, KRAS, PIK3CA, APC,
ARID1A, NF1, PTEN, SMARCA4 and TP53 genes were frequently mutated and their mutations were mostly com-mon acom-mong the three resources. Many of MAP3K1 and MLL3 mutations were unique in the CCLE database with much higher frequency than expected, which raises some questions on the reliability of variant calling. Thus, users should be careful in assessing the significance of mutations reported from the original databases.
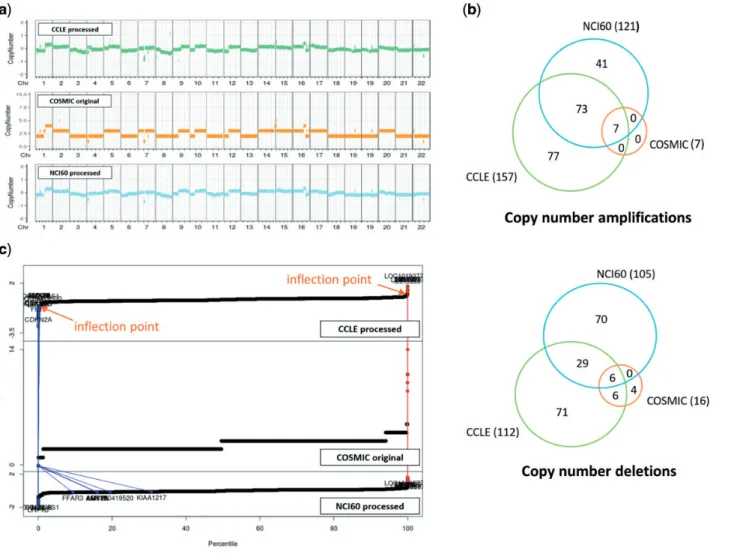
CNVs are even more complicated to compare. For two resources where raw data were available, we reprocessed the raw data and identified copy number aberrations using our own method as described in the Materials and methods section. For COSMIC which does not provide raw data, we just imported the processed CNV values (given in integer). CNV plots were produced for the NCI-H460 cell line, which is frequently used in lung cancer research
(Figure 4a). Visual inspection indicated that CNV plots
were in good agreement among the three resources, but calls for copy number amplifications and deletions yielded
gene lists with partial overlaps as indicated inFigure 4b.
We find that the COSMIC calls are biased toward copy number deletions (i.e. less number of copy number amplifi-cations) in most cell lines. Note that both CCLE and NCI60 give a lot more aberrations with good overlaps, but COSMIC reports much less copy number aberrations probably because of different data processing methods and their policy favoring deletions over amplifications. Plots of
CNV values of all genes in ascending order (Figure 4c)
im-ply that CNV values are almost contiguous and it is not
easy to select cut-off values to identify copy number ampli-fications and deletions.
User interface and visualization
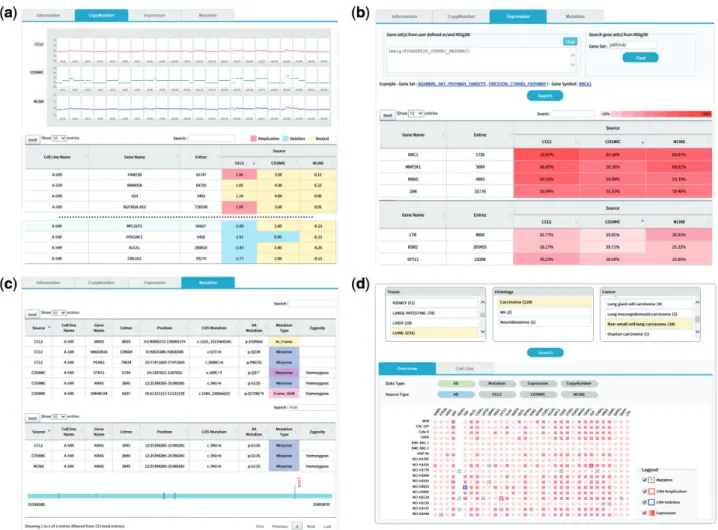
GEMiCCL supports cell line search, gene search, browsing with histological characteristics and complex queries based on the Boolean logic rules. Cell line search shows summary information, copy number, gene expression and mutation data displayed in separate tab pages.
The copy number tab shows CNV plots from available data sources with a table of CNV values as shown in
Figure 5. The CNV values can be sorted using the built-in
sort function within the table to identify genes with copy number amplifications and deletions as colored in red and blue, respectively.
The expression tab shows a table of gene expression
val-ues again with sorting and searching functions (Figure 5b).
Here the expression values are shown in percentiles among all genes in the cell line because a universal reference sam-ple could not be defined. It is common for users to want to examine expression values only for a group of genes. We implemented a filtering scheme to allow users to input a list of interested genes. Alternatively, users may search the
MSigDB (14) that contains 17 786 gene sets covering
diverse curated pathways, gene ontology, targets of tran-scription factors and microRNAs and oncogenic and
im-munologic signatures.Figure 5b is an illustration of gene
expression in the A-549 cell line for genes in the b-catenin pathway as defined by the MSigDB. This feature should fa-cilitate users to concentrate on activities of genes or path-ways of interest.
Figure 3. Mutational landscape of 125 driver genes defined by Vogelstein in 36 cell lines. Mutated genes were colored according to overlap in data-base sources. We omitted 16 genes with no mutations in our cell lines.
The mutation tab displays a collection of mutations in the selected cell line. Exome sequencing usually identifies hundreds or thousands of mutations, making it difficult to see the gene of interest. Again, users may use the built-in search function of the table to locate specific genes
(Figure 5c). In an effort to help users determine the
func-tional significance of each mutation, we implemented a simple JavaScript visualization tool indicating where the mutation and functional domains exist in the gene coordinate.
It is often the case that users have a gene of particular interest. Gene searches rather than cell line searches show CNV, expression and mutation information for the user-specified gene across many cell lines, in a similar fashion to the cell line search. The role of cell lines and genes is just interchanged in the output pages.
We also support a browsing function that combines tis-sue, histology and cancer types in a sequential order.
Figure 5dshows the browsing result for 18 cell lines from
non-small cell lung carcinoma. Each square in the over-view/summary plot simultaneously indicates the presence of mutations, copy number alterations and expression lev-els for user-selected cell lines and genes. In this example, we added a filter for the b-catenin pathway genes in the
MSigDB defined in the same way as in Figure 5b. Users
may choose to see specific data types or resources using the checkbox options. The cell line tab provides a table that includes the number of copy number-altered genes, expressed genes and mutated genes for selected cell lines. Clicking each number opens a new window to show the gene list with more detailed information.
Lastly, we support a smart search scheme based on the combination of Boolean logic rules. Users may enter query terms in any combination of histological characteristics and gene names. We also support diverse types of query tags including CNV type, mutation, expression and DB
Figure 4. CNV data for NCI-H460 cell line from three resources. (a) CNV plots over chromosomes. COSMIC reports integer values, whereas our own processing of CCLE and NCI60 data sets gives real numbers. (b) Venn diagram of genes called as copy number amplifications and deletions. (c) Plots of CNV values for all genes in ascending order. Two inflection points were used to define copy number amplified (in red) and deleted (in blue) genes as described in Materials and methods section. We also show where the copy number altered genes by COSMIC appear in CCLE and NCI60 plots.
Page 6 of 8 Database, Vol. 2018, Article ID bay041
sources. A search of cell lines from lung adenocarcinoma with BRAF mutation can be easily accomplished using this Boolean logic search. A query builder was implemented to help users compose complex queries in accordance with our query tags.
Conclusion
Clinical and molecular characteristics are two most impor-tant factors in selecting cancer cell lines for functional or screening experiments. GEMiCCL is the most comprehen-sive database of cancer cell lines to date, covering gene expression, mutation and copy number information,
integrated carefully from three representative resources of CCLE, COSMIC and NCI60. It also supports users to com-pare such properties from different resources objectively without batch effect. Furthermore, experimental scientists should be able to look up molecular characteristics easily with our user-friendly web interface and interactive features.
Acknowledgements
The authors thank the source databases of CCLE, COSMIC and NCI60 for making their data available in public. And also appreci-ate anonymous reviewers for valuable suggestions including the Boolean logic search and Ms. Y.E.L. for helping manuscript preparation.
Figure 5. (a) CNV output from cell line search (A-549 cell line). Upper plots show the chromosomal CNV plots from three resources. Lower table shows the detailed copy number values where calls for amplification, deletion, and neutral were indicated in the background color. Note that the built-in sorting function of table utility was used to locate genes with copy number amplifications or deletions. (b) Gene expression output from cell line search (A-549 cell line). Users may specify a list of genes to be included for visualization in the upper panel. Alternatively, MSigDB can be used to define gene sets as shown in this example of CTNNB1 (b-catenin) pathway. Expression values normalized in the 0–100 percentile scale are shown in the table with background color indicating expression levels. Sorting or searching function of table utility can be used to locate genes of interest. (c) Mutation output from cell line search (A-549 cell line). The lower table was obtained by searching KRAS from the table search utility. A mouse click on any row shows the mutation plot on gene coordinate (bottom picture). Note that KRAS gene is shown in 30 50direction. All genome coordinates are for hg19 human genome assembly. (d) Browsing of cancer cell lines. Selection on tissue-histology-cancer type works in successive way reflecting user’s choice dynamically. The lower panel is the summary of molecular characteristics over selected cell lines and genes. Again, gene list can be chosen via MSigDB as shown in (b). Presence of mutation is indicated in dots. Border color shows copy number amplifications and deletions. Intensity of background color indicates the gene expression level.
Funding
This work was supported by the grants from the National Research Foundation of Korea (2014M3C9A3065221 and NRF-2015K1A4A3047851), the KRIBB Research Initiative Program, and the Technology Innovation Program of the Ministry of Trade, Industry and Energy, Republic of Korea (10050154 to S.L.).
Conflict of interest. None declared.
References
1. Romano,P., Manniello,A., Aresu,O. et al. (2009) Cell Line Data Base: structure and recent improvements towards molecu-lar authentication of human cell lines. Nucleic Acids Res., 37, D925–D932.
2. Sarntivijai,S., Ade,A.S., Athey,B.D. et al. (2008) A bioinformat-ics analysis of the cell line nomenclature. Bioinformatbioinformat-ics, 24, 2760–2766.
3. Bairoch,A. The Cellosaurus: a cell line knowledge resource. https:// web.expasy.org/cellosaurus/ (30 July 2016, date last accessed). 4. Krupp,M., Itzel,T., Maass,T. et al. (2013) CellLineNavigator: a
workbench for cancer cell line analysis. Nucleic Acids Res., 41, D942–D948.
5. Barretina,J., Caponigro,G., Stransky,N. et al. (2012) The Cancer Cell Line Encyclopedia enables predictive modelling of antican-cer drug sensitivity. Nature, 483, 603–607.
6. Forbes,S.A., Beare,D., Boutselakis,H. et al. (2017) COSMIC: so-matic cancer genetics at high-resolution. Nucleic Acids Res., 45, D777–D783.
7. Tym,J.E., Mitsopoulos,C., Coker,E.A. et al. (2016) canSAR: an updated cancer research and drug discovery knowledgebase. Nucleic Acids Res., 44, D938–D943.
8. Yu,M., Selvaraj,S.K., Liang-Chu,M.M.Y. et al. (2015) A re-source for cell line authentication, annotation and quality con-trol. Nature, 520, 307–311.
9. Gautier,L., Cope,L., Bolstad,B.M. et al. (2004) affy–analysis of Affymetrix GeneChip data at the probe level. Bioinformatics, 20, 307–315.
10. Johnson,W.E., Li,C. and Rabinovic,A. (2007) Adjusting batch effects in microarray expression data using empirical Bayes methods. Biostatistics, 8, 118–127.
11. Wang,K., Li,M., Hadley,D. et al. (2007) PennCNV: an inte-grated hidden Markov model designed for high-resolution copy number variation detection in whole-genome SNP genotyping data. Genome Res., 17, 1665–1674.
12. Venkatraman,E.S. and Olshen,A.B. (2007) A faster circular bi-nary segmentation algorithm for the analysis of array CGH data. Bioinformatics, 23, 657–663.
13. Vogelstein,B., Papadopoulos,N., Velculescu,V.E. et al. (2013) Cancer genome landscapes. Science, 339, 1546–1558.
14. Liberzon,A., Birger,C., Thorvaldsdottir,H. et al. (2015) The Molecular Signatures Database (MSigDB) hallmark gene set col-lection. Cell Syst., 1, 417–425.
Page 8 of 8 Database, Vol. 2018, Article ID bay041