저작자표시-비영리-변경금지 2.0 대한민국 이용자는 아래의 조건을 따르는 경우에 한하여 자유롭게 l 이 저작물을 복제, 배포, 전송, 전시, 공연 및 방송할 수 있습니다. 다음과 같은 조건을 따라야 합니다: l 귀하는, 이 저작물의 재이용이나 배포의 경우, 이 저작물에 적용된 이용허락조건 을 명확하게 나타내어야 합니다. l 저작권자로부터 별도의 허가를 받으면 이러한 조건들은 적용되지 않습니다. 저작권법에 따른 이용자의 권리는 위의 내용에 의하여 영향을 받지 않습니다. 이것은 이용허락규약(Legal Code)을 이해하기 쉽게 요약한 것입니다. Disclaimer 저작자표시. 귀하는 원저작자를 표시하여야 합니다. 비영리. 귀하는 이 저작물을 영리 목적으로 이용할 수 없습니다. 변경금지. 귀하는 이 저작물을 개작, 변형 또는 가공할 수 없습니다.
A Thesis
For the Degree of Master of Science
Different Energy and Protein Levels in
Diet on Growth Performance, Blood
Profiles, Pork Quality and Feed Cost in
Growing-finishing Pig
사료 내 에너지, 단백질 수준이 육성-비육돈의
성장성적, 혈액성상, 도체특성 및 경제성에 미치는
영향
August, 2020
By
Park, Chun Woong
College of Agriculture and Life Sciences
Seoul National University
Different Energy and Protein Levels in Diet on
Growth Performance, Blood Profiles, Pork Quality
and Feed Cost in Growing-finishing Pig
사료 내 에너지, 단백질 수준이 육성-비육돈의 성장성적,
혈액성상, 도체특성 및 경제성에 미치는 영향
지도교수
김 유 용
이 논문을 농학석사 학위논문으로 제출함
2020 년 8 월
서울대학교 대학원 농생명공학부
박 천 웅
박천웅의 농학석사 학위논문을 인준함
2020 년 7 월
위 원 장 (인)
부위원장 (인)
위 원 (인)
Summary
This study was conducted to evaluate the optimal energy and protein level in feed of growing-finishing pigs for growth, blood profiles, pork quality and feed cost. This experiment was done by a factorial design and factor 1 was two level of energy (3,150 or 3,300 kcal of ME/kg), and factor 2 was also two level of dietary protein in feed (90% of NRC CP requirements in 2012 or NRC CP requirements in 2012). Growth performance of growing-finishing pigs was improved when pigs were fed high dietary energy and high protein treatment diet (HH) both in late growing phase and the late finishing phase, respectively (P=0.03; P=0.05). Average daily gain (ADG) was increased when higher protein diets (LH and HH) were provided to growing-finishing pigs (P=0.03) and dietary protein was much more potent nutrient than dietary energy for growth of pigs during the whole experimental period. Average daily feed intake (ADFI) was also increased when pigs were fed higher protein diet particularly during growing phase (P=0.01) and this trend was maintained during finishing phase (P=0.03). Gain to feed ratio (G:F), however, was mainly affected by dietary energy (P=0.06) rather than dietary protein level (P=0.67). Blood urea nitrogen (BUN), total protein, creatinine and blood glucose were lowered when low energy and low protein diet (LL) was provided (P=0.01), resulted in an interaction (P=0.01). Although pH of pork was lowered when pigs were fed low protein treatment diet (P=0.03), but other measurements of pork quality, such as color, chemical analysis and TBARS, were not affected by dietary levels of energy and protein. Feed cost per weight gain was lowered when pigs were fed high energy and low protein treatment diet however, feed cost per pig was increased when dietary protein level was increased (P=0.01). Although total feed cost to 110kg of body weight was the lowest in low energy and low protein treatment (LL), days to market weight from 27.22 to 110kg was the shortest in high energy and high protein treatment (HH) among dietary treatments. Even
though feed cost could be saved in LL treatment, days to market weight was delayed about 19 d compared to HH treatment subsequently LL treatment would not be efficient feed formulation for growing-finishing pigs. Consequently, this experiment demonstrated that high protein diet resulted in improved growth performance in growing pigs but high energy (3,300 kcal of ME/kg) and low protein (90% of NRC(2012)) diet would be desirable feed formulation based upon feed cost, days to market weight and pork quality.
Key words: Dietary energy and protein, Growing-finishing pig, Growth
Contents
page Summary ··· i Contents ···ⅲ List of Tables ···ⅵ List of Figures ···ⅷ List of Abbreviations ···ⅸ Ⅰ. Introduction ··· 1 Ⅱ. Literature Review 1. Introduction ··· 31.1 Genetic Improvement and Nutrient Requirement for Pigs ··· 3
1.1.1 Nutrient Requirement ··· 6
1.1.2 Nutrient Requirement of Pigs ··· 7
1.2. Nutrient Requirement for Growing-finishing Pigs ··· 8
1.3 Protein Deposition ··· 14
1.3.1 Protein and Amino Acids ··· 14
1.4 Lipid Deposition ··· 17
2. Dietary Energy of Growing-Finishing pig ··· 19
2.1 Effect of Dietary Energy Levels in Growing-Finishing Pigs ··· 19
2.2 Dietary Energy Level and Fat Deposition ··· 20
2.3 Effect of Dietary Energy Level on Growth Performance ··· 23
2.4 Effect of Dietary Energy Level on Carcass Characteristics ··· 25
3. Dietary Protein and AA in Growing-Finishing Pig ··· 29
3.1 Protein and Amino Acid Requirements for swine diets ··· 29
3.1.1 Transition of Protein and Amino Acid Requirements in NRC ··· 29
3.1.2 Transition of Ideal Amino Acid Profile ··· 30
3.1.3 Effects of Dietary CP Levels in Growing-finishing Pigs ··· 31
3.2 Dietary Protein and AA Metabolism ··· 32
3.2.1 Lysine Metabolism ··· 32
3.2.2 Methionine Metabolism ··· 35
3.2.3 Tryptophan Metabolism ··· 36
3.2.4 Threonine Metabolism ··· 37
3.3 Dietary Protein Level and Protein Deposition ··· 38
3.4. Effect of Dietary Protein Level on Carcass Characteristics ··· 39
4.1 Dietary Energy Level and Voluntary Feed Intake ··· 41
4.2 Dietary Protein Level and Protein Intake ··· 43
4.3 Dietary Energy Level and Protein Intake ··· 45
Ⅲ. Different Energy and Protein Levels in Diet on Growth Performance, Blood Profiles, Carcass Characteristics and Feed Cost in Growing-finishing Pig Abstract ··· 47
Introduction ··· 49
Materials and Methods ··· 51
Results and Discussion ··· 57
Conclusion ··· 66
Ⅳ. Literature Cited ··· 81
Ⅴ. Summary in Korean ··· 109
List of Tables
Ⅱ. Review of literature
Table 1. Phenotypic trends in central test results in the Netherlands from 1930
until 1990 ··· 4
Table 2. Optimum lysine/digestible energy ratios in growing pigs by different genotype ··· 5
Table 3. Energy requirements for growing-finishing pigs ··· 10
Table 4. Protein requirements for growing-finishing pigs ··· 11
Table 5. Lysine requirements for growing-finishing pigs ··· 13
Table 6. Crude protein requirements for growing-finishing pigs in NRC 1998 and 2012 ··· 14
Table 7. Nutrient requirements of growing-finishing pig (NRC) ··· 29
Ⅲ. Experiment Table 8. Experimental treatments ··· 68
Table 9. Formulae and chemical compositions of the experimental diet of early growing pigs (1-4 weeks). ··· 69
Table 10. Formulae and chemical compositions of the experimental diet of late growing pigs (5-7 weeks). ··· 70
Table 11. Formulae and chemical compositions of the experimental diet of early finishing pigs (8-10 weeks) ··· 71
Table 12. Formulae and chemical compositions of the experimental diet of late finishing pigs (11-13 weeks) ··· 72
Table 13. Effects of energy and protein levels on growth performance in growing-finishing pigs ··· 73 Table 14. Effects of energy and protein levels on blood profiles in
growing-finishing pigs ··· 74 Table 15. Effects of energy and protein levels on pH of pork in
growing-finishing pigs ··· 75 Table 16. Effects of energy and protein levels on color of longissimus muscles
in growing-finishing pigs ··· 76 Table 17. Effects of energy and protein levels on proximate analysis and
physiochemical property of longissimus muscles in growing-finishing pigs ··· 77 Table 18. Effects of energy and protein levels on TBARS assay in the
longissimus muscles of growing-finishing pigs ··· 78 Table 19. Effects of energy and protein levels on fatty acid composition of
longissimus muscles from growing-finishing pigs ··· 79
Table 20. Effects of energy and protein levels on feed cost in
List of Figures
Ⅰ. Review of Literature
Figure 1. Schematic description of one century of genetic progress in pigs ···· 4
Figure 2. Lysine requirements (%, true ileal digestible basis) of pigs with a mean lean growth rate ··· 12
Figure 3. Relationship between energy intake and body protein deposition (PD) in growing pigs ··· 16
Figure 4. The ratio of lean to fat in gain ··· 18
Figure 5. Lysine catabolism in monogastric animals ··· 33
Figure 6. Metabolic pathways of sulfur amino acids ··· 36
Figure 7. Schematic representation of the relationship between feed and energy intakes and the energy density of the diet ··· 42
AA Amino acid
AAFCO Association of American Feed Control
Officials
ADFI Average daily feed intake
ADG Average daily gain
AOAC Association of official analytical chemists
ARG Arginine
BF Backfat
BUN Blood urea nitrogen
BW Body weight
CP Crude protein
DE Digestible energy
EE Ether extract
FCR Feed conversion ratio
FFA Free fatty acid
G:F Gain to feed
IMF Intramuscular fat
KFSS Korean feeding standard for swine
LYS Lysine
ME Metabolizable energy
MET Methionine
MUFA Mono unsaturated fatty acid
NRC National research council
PUFA Polyunsaturated fatty acid
RCBD Randomized complete block design
SAS Statistical analysis system
SBM Soybean meal
SD Standard deviation
SFA Saturated fatty acid
TBARS 2-thiobarbituric acid reactive substances
THR Threonine
TRP Tryptophane
USFA Unsaturated fatty acid
I. Introduction
Recently, global grain price tends to increase with various reasons. Extreme climate change, decrease of cultivation acreage and increase of meat consumption are also having a significant impact on global grain prices subsequently prices of feed ingredients will be increased continually in the future. In South Korea, it is known that feed cost comprised approximately 60 percent of the total cost of pig production and about 60 to 70 percent of ingredients in swine feed is consisted of corn and soybean. Over the last two decades, pig industry in Korea has been developed greatly and pork price has been maintained about 2~3 times higher than that of USA and EU. Therefore, swine producers in Korea are concerned about fast growing of pigs regardless of cost of feed or pork quality and are less interested in saving of production cost and improving productivity of farm. Moreover, many feed companies have been selling high-nutritive feed at high prices, and swine producers do not aware of the serious situation by feeding over-nutritive feed to pigs. Swine feed contained excessive nutrients not only increased Growing-finishing period is an important time to maximize the growth of pigs, in addition, pigs are generally consuming much more feed compared to other phase of pigs subsequently feed cost during this period is being comprised approximately 70% of total cost of feed of pigs. To save feed cost, swine producers need to avoid wasting of feed and formulate efficient feed which contains adequate nutrients for normal growth of pigs.
When swine feed is formulated efficiently, nutrients in feed will be well utilized in growing-finishing pigs subsequently growth rate of pigs has improved and days to market weight can be reduced. Not only price of swine feed, but also pollutants in environment will be great concerned when feed contained excessive nutrients. Among of nutrients, crude protein and energy contents in swine feed determine the price of feed, resulting in affecting net profit of swine farm. Consequently, this study was conducted to evaluate the optimal levels of energy and protein in swine diet on growth performance, blood profiles, carcass characteristics and feed cost in growing-finishing pigs.
II. Literature Review
1. Introduction
1.1 Genetic Improvement and Nutrient Requirement for Pigs
Genetic improvement of pigs, supported by constant breeding programs and genetic discoveries, has steadily been enhanced since its start in the early 20th century (especially in Northern Europe). In its initial phase, the focus was mainly on lean mass and feed efficiency of pigs. Studies have seen gradual advances in genotype or phenotype, so that enhancement of breed characteristics (such as type, color, and back fat thickness) was achieved, and daily gain and feed efficiency were constantly improved.
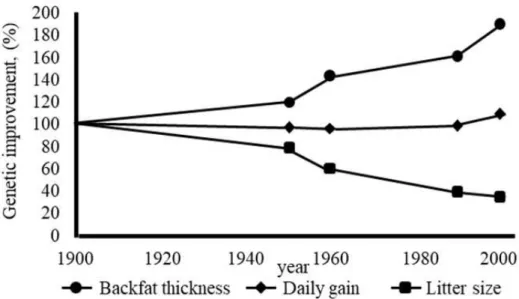
Since the beginning of animal domestication, humans have been aiming to breed animals best satisfying our interests. In its start, our goals concerned general features like size and color, and the matter of docility. Dickerson (1952, 1974) studies concerning crossbreeding of plants and poultry garnered attention from pig farms. The phenotypic trends of Dutch Landrace pigs and Dutch Yorkshire pigs from 1930 through 1990 is shown in Table 1. Merks (2000) reports 50-plus percent increase in daily gain, outstanding enhancement in feed efficiency, and approximately 50% of decrease in backfat thickness. Figure 1 shows main genetic trends through the century (including daily gain, backfat thickness, and litter size).
Race Daily gain (g/d) Feed efficiency (kg/kg) Backfat thickness (mm) Dutch landrace 1930 500 3.5 45 1947 650 3.4 33 1972 788 2.6 26 1990 840 2.8 24 Great Yorkshire 1930 550 3.4 48 1947 680 3.2 35 1972 815 2.5 27 1990 840 2.7 22 Sources:Merks,2000
Figure 1. Schematic description of one century of genetic progress in pigs (Merks, 2000)
Table 1. Phenotypic trends in central test results in the Netherlands from 1930 until 1990
Advancement in the field of genetics (such as that of molecular genetics) continued into the last decade of 20th century, allowing improvement of sire and dam lines for swine reproduction systems.
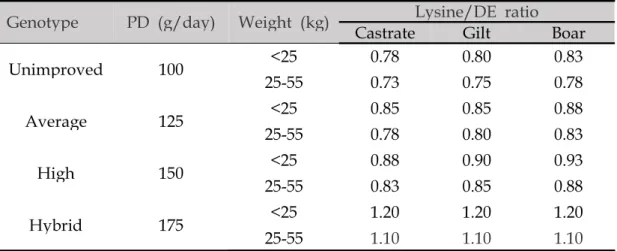
Genotype PD (g/day) Weight (kg) CastrateLysine/DE ratioGilt Boar Unimproved 100 <25 0.78 0.80 0.83 25-55 0.73 0.75 0.78 Average 125 <25 0.85 0.85 0.88 25-55 0.78 0.80 0.83 High 150 <25 0.88 0.90 0.93 25-55 0.83 0.85 0.88 Hybrid 175 <25 1.20 1.20 1.20 25-55 1.10 1.10 1.10
Sources: Van Lunen and Cole 1996
Enhancement in growth performance and feed efficiency keeps proceeding, according to Knap (2009) and Torres et al. (2005). Intramuscular fat (IMF) content shows decrease in Brewer et al. (2001), as an outcome of breeding for leaner genotype.
The purpose of breeding programs was centered on daily gain, feed efficiency and litter size, and has evolved to also include characteristics like meat quality and vitality of piglets (Knol, 1998). There are also some studies involving gene-environment interaction (Andersen et al., 1998; Merks and Hanenberg, 1998) and inbreeding (Meuwissen, 1998).
Some scientists concentrated on the nutrient requirements of pigs. Ideal lysine/digestible energy (DE) ratio in growing pigs can be seen in Table 2, according to their genotype. Van Lunen and Cole (1996) observed that through genetic improvement, protein deposition and lysine requirements have increased. Naturally, it would be safe to assume that there will be steady increase of the nutrient requirements in pigs.
Table 2. Optimum lysine/digestible energy ratios in growing pigs by different genotype
1.1.1 Nutrient requirement
Dietary energy is used in maintenance, accretion of protein and lipid, and heat loss of production (Van Milgen and Noblet, 2003). From pigs’ birth to the point where they reach market weight, daily energy intake keeps increasing. The energy is firstly spent on maintenance, then on protein and lipid accretion (Lizardo et al., 2002). Spare energy will be accumulated as fat. The amount of energy for maintenance takes up about a third of their total energy intake, and the rest is spent on protein and lipid accretion (Black and Lange, 1995; NRC, 1998).
The interaction between energy intake and protein deposition decides the accretion of protein and lipid (through dietary energy) above the animal’s maintenance needs. Bikker et al. (1995) states that the genotype and energy intake has influence on the effect of a dietary energy intake on body composition. Davies (1983) states that compared to pigs with low feeding level, pigs with high feeding level accumulated more fat and less muscle. Kanis (1988) and Bikker et al. (1995) suggested that increase in energy intake dropped the efficiency of lean tissue gain. Older pigs, according to Bikker et al. (1996) were shown to preserve more lipid per unit of extra energy than protein. Rao and McCracken (1991) reported an even increase of protein deposition up to 230 g/d, affected by the nitrogen balance of approximately 38 MJ of DE/d. Ellis et al. (1983) and Jorgensen et al. (1985) demonstrated that lowering the energy intake also increases the lean portion and decreases the fat portion in a pig’s body. Raising the energy intake has been found to boost the ratio of lipid and protein deposition (LD : PD) (Campbell et al., 1983; De Greef et al., 1994; Bikker
et al., 1995). Campbell and Taverner (1988) agreed to these influences of energy intake on body composition. Bikker et al. (1995) claimed that higher energy intake in growing female pigs lessened the protein deposition of lean tissue. De Greef et al. (1994), illustrated the increase of LD : PD as pigs’ body weight increased, claimed that LD : PD increased in boars weighing 25 ~ 105 kg, regardless of high or low feeding level.
1.1.2 Nutrient Requirement of Pigs
In pig farming industry, two important factors for maximum result are growth rate and feed cost. Swine production aims to get more products from various feeds that provide proper nutrients. There are several nutrients crucial for synthesis of muscle, adipose tissue, bone, hair, skin and other body parts. They include energy, protein, amino acid, minerals, vitamins, water, etc. Nutrients also play great part in body maintenance, growth, reproduction and lactation.
Meanwhile, Wilson and Bayer (2000) claimed that feed ultimately affects 60% of the cost for producing market-weight pigs. Overfeeding nutrients is reported to have negative influence on the environment (Swine Nutrition 2nd Edition, 2001). Underfeeding is reported to affect pigs’ reproductive, lactating and growth performance (Baker et al., 1970; Svajgr et al., 1972; Head and Williams, 1991; Jongbloed and Lenis, 1992; Paik et al., 1996; Messias de Bragança et al., 1998; Revell et al., 1998; Kusina et al., 1999b; Jeong et al., 2010). As these claims imply, nutrient concentration influences swine performance, and thus connected to cost of production. Accordingly, we need studies appraising changes in requirements of nutrients
and resulting swine performance. The studies would enable us to enhance swine productivity and save feed cost.
1.2. Nutrient Requirement for Growing-Finishing Pigs
As nutrients intake is vital for growth, breeding and production of livestock animals, there has been continuous study on animal nutrition, in order to provide enough nutrients for animals without either excess or deficiency. As of pigs, there are enough information acquired through numbers of experiments (concerning pig’s weight gain, feed efficiency, protein accretion rate, etc.). However, some differences exist depending on changing body weight and circumstances of animals. As a result, the standard of nutrient requirement for pigs was set by institutions worldwide (e.g. NRC of the USA (1998), ARC of the UK (1981), SCA of Australia (1987) and JRC of Japan (1993)). Rural Development Administration of South Korea also joined in by publishing the Korean Feeding Standard for Swine (2007).
Feed intake of growing-finishing swine depends on energy content in feed. Feed of high energy content leads to decrease in feed intake, increase in weight gain, and decrease in lean percentage following increased lipid accumulation. Daily energy requirement is obtained through the sum of the
requirements for maintenance, protein and fat deposition, and
thermo-regulation. Pigs of growing-finishing period need energy to grow and maintain bodily functions. Maintenance energy is fundamental in supporting life and body temperature and is gauged from heat production in fasting
of metabolizable energy (ME) daily for pigs of all weights.
Because stage of growth, dietary energy and other nutrients influence fat and protein deposition, energy requirements for growth may vary. They are needed in synthesis of bone, tissue, organ, muscle and fat by protein and lipid deposition. Verstegen et al. (1987) stated that 10.6 Mcal of ME is needed for synthesis of a gram worth of protein, 12.5 Mcal of ME for synthesis of equal amount of fat. According to Wenk et al. (1980), protein took up 23% in a kilogram of muscle tissue; fat took up 80~95% in a kilogram of fat tissue. This shows that muscle synthesis requires more energy than fat deposition.
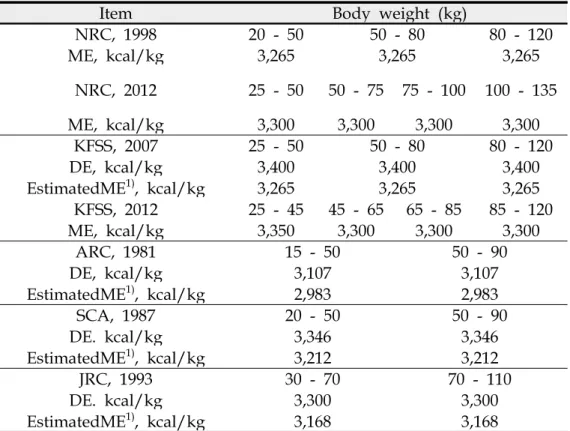
Table 3 shows standardized energy requirements for growing-finishing pigs set up by different institutions worldwide. NRC suggested 3,265 kcal/kg of ME (1998) as energy requirement of growing-finishing pigs (3,300 kcal/kg in its 2012 report). KFFS suggested 3,265 kcal/kg of ME (2007) as well (2012 report details the amount as follows: 3,350 kcal on 25 ~ 45 kg pigs, 3,300 kcal on 45 ~ 120 kg pigs). SCA (1987) and JRC (1993) shares similar information regarding pigs of growing-finishing phase. ARC (1981) shows lower energy requirement according to their own data of genotype, growth rate, lipid deposition and environmental factors.
Item Body weight (kg) NRC, 1998 20 - 50 50 - 80 80 - 120 ME, kcal/kg 3,265 3,265 3,265 NRC, 2012 25 - 50 50 - 75 75 - 100 100 - 135 ME, kcal/kg 3,300 3,300 3,300 3,300 KFSS, 2007 25 - 50 50 - 80 80 - 120 DE, kcal/kg 3,400 3,400 3,400 EstimatedME1), kcal/kg 3,265 3,265 3,265 KFSS, 2012 25 - 45 45 - 65 65 - 85 85 - 120 ME, kcal/kg 3,350 3,300 3,300 3,300 ARC, 1981 15 - 50 50 - 90 DE, kcal/kg 3,107 3,107 EstimatedME1), kcal/kg 2,983 2,983 SCA, 1987 20 - 50 50 - 90 DE. kcal/kg 3,346 3,346 EstimatedME1), kcal/kg 3,212 3,212 JRC, 1993 30 - 70 70 - 110 DE. kcal/kg 3,300 3,300 EstimatedME1), kcal/kg 3,168 3,168
1)The value of ME is approximately 94~97% of DE in swine feed and average 96%(ARC, 1981)
Table 3. Energy requirements for growing-finishing pigs
Protein level in pigs in general represents 15~18% of their body mass, and 45~60% of it is shared to dissectible muscle or lean meat. Others spread to pigs’ visceral organs, hair, bone, skin, blood and other tissues. Dietary protein replaces proteins lost in protein turnover, and is disposed as cells, amino acids, other nitrogenous compounds and unabsorbed enzyme secretions from the intestine (“metabolic fecal losses” or “endogenous fecal losses”), or urea from the kidney (“urinary losses”). In addition, amino acids found in protein are needed for the synthesis of non-protein compounds (hormones, neurotransmitters, immunoglobulins and other bioactive peptides). As seen in Table 4, which shows protein requirement for growing-finishing pigs, they require less protein as they mature. Quite a few researchers
Item Body weight (kg) NRC, 1998 20 - 50 50 - 80 80 - 120 Protein, % 18.0 15.5 13.2 NRC, 2012 25 - 50 50 - 75 75 - 100 100 - 135 Protein1),% 15.8 13.8 12.2 10.5 KFSS, 2007 25 - 50 50 - 80 80 - 120 Protein, % 18.0 16.0 13.0 KFSS, 2012 25 - 45 45 - 65 65 - 85 85 - 120 Protein, % - - - -ARC, 1981 15 - 50 50 - 90 Protein, % 15.6 11.2 SCA, 1987 20 - 50 50 -90 Protein, % 15.6 11.5 JRC, 1993 30 - 70 70 - 110 Protein, % 15.0 13.0
1)Calculated from total nitrogen X 6.25
proposed that adequate amino acids balance is more effective for pigs’ growth than protein level.
Table 4. Protein requirements for growing-finishing pigs
Main ingredients for swine feed like corn, barley and wheat can cover 30~60% of total amino acid requirements. Soybean meal is also an ample provision of pigs’ requirements of protein and amino acid. The following 9 amino acids are indispensable amino acids that should be obtained through pigs’ diet: lysine, methionine, threonine, tryptophan, histidine, isoleucine, leucine, phenylalanine and valine. Cysteine and tyrosine can only be synthesized from essential amino acids (from methionine and tyrosine, respectively), and these can be viewed as semi-essential. Lysine generally is
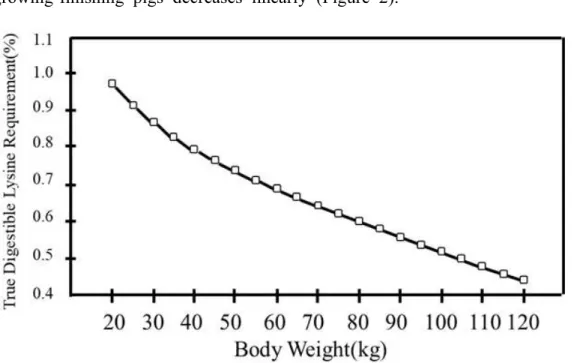
Figure 2. Lysine requirements (%, true ileal digestible basis) of pigs with a mean lean growth rate (NRC, 1998)
considered the first-limiting amino acid in cereal-grain-based pig diets. Dietary amino acids requirement for swine is closely associated with protein accretion, energy intake and dietary energy density in their growing-finishing phase (NRC, 1998). The whole-body protein accretion rate differs according to genetic strain, gender, health and stock density, or to combination of these or other factors. However, the amount of lysine needed for growing-finishing pigs decreases linearly (Figure 2).
Institutes differ as to the requirement of lysine for growing-finishing pigs (Table 5). They all show linear decline of lysine requirement through pigs’ growth. Nonetheless, these feeding standards show distinction, taking into account genetic strain, gender, health, growth rate, etc.
Item Body weight (kg) NRC, 1998 20 - 50 50 - 80 80 - 120 Lysine1), % 0.95 0.75 0.60 NRC, 2012 25 - 50 50 - 75 75 - 100 100 - 135 Lysine1), % 1.12 0.97 0.84 0.71 KFSS, 2007 25 - 50 50 - 80 80 - 120 Lysine1), % 0.98 0.82 0.64 KFSS, 2012 25 - 45 45 - 65 65 - 85 85 - 120 Lysine1), % 1.22 1.01 0.91 0.76 ARC, 1981 15 - 50 50 - 90 Lysine1), % 1.10 0.78 SCA, 1987 20 - 50 50 -90 Lysine1), % 0.83 0.60 JRC, 1993 30 - 70 70 - 110 Lysine1), % 0.75 0.56
1)Lysine requirement for total basis(%)
Table 5. Lysine requirements for growing-finishing pigs
Dietary protein is vital source for the synthesis of body tissue, organ, hair, bone, skin, blood and other tissues. Moreover, some amino acids in protein are necessary for the synthesis of non-protein compounds; hormones, neurotransmitters, immunoglobulins to name a few, and other bioactive peptides.
Nutrient requirements decrease as pigs grow, and one way to provide appropriate nutrients for growing-finishing pigs is phase feeding. Phase feeding prevents the waste of nutrition, saves the cost for feedstuff, as well as curtails the emission of nitrogen.
Table 6 shows crude protein (CP) requirements for growing-finishing pigs set by the NRC. It shows that NRC (2012) has divided the phases of
Item Body weight (kg)
NRC, 1998 20 - 50 50 - 80 80 - 120
Protein, % 18.0 15.5 13.2
NRC, 2012 25 - 50 50 - 75 75 - 100 100 - 135 Protein1),% 15.8 13.8 12.2 10.5
1)Calculated from total nitrogen X 6.25
growing-finishing pigs into four, whereas in NRC (1998) the phases had been divided into three. CP requirements according to pigs’ weight has lessened in NRC (2012) than in NRC (1998). This, along with many other reports, suggests that providing precise balance of amino acids is more effective for pigs’ growth than protein level is.
Table 6. Crude protein requirements for growing-finishing pigs in NRC 1998 and 2012
1.3 Protein Deposition
1.3.1 Protein and Amino Acids
Proteins are primary nutrients for biological processes. They are macromolecules that make possible, virtually all molecular transformations and biochemical reactions.
Amino acids can combine into various chemical substances apart from
proteins, including peptides, hormones, neurotransmitters, purine and
pyrimidine nucleotides, creatine, carnitine, porphyrins, polyamines, and nitric oxide in an animal body (Wu and Morris, 1998). All natural proteins consist of 20 α-amino acids. These have a carbon that includes a primary amino group and a carboxyl group. Amino acids vary according to different
structures of side chains contained in them. Since animal cells cannot utilize inorganic N (like urea or ammonia) to form amino acids when carbon skeletons are unavailable, essential amino acids must be included in the animal diets. Chung and Baker (1991) observed that piglets are fattened when provided a diet with crystalline amino acids as the only source of nitrogen. Easter and Baker (1976) observed that gilts go through normal pregnancy during the last 84-day phase of gestation when fed the same diet. Amino acids not only act as precursors of protein, but also of nitrogenous substances (such as nitric oxide, polyamines, creatine, dopamine, and catecholamines) that are crucial for whole-body homeostasis (Wu and Meiniger, 2002; Odenlund et al., 2009; Suryawan et al., 2009).
1.3.2 Protein Deposition
PDmax refers to the upper limit of protein deposition achieved or achievable by a pig. To get maximum results in growth rate and body weight gain (especially lean tissue growth), pigs’ genotype and their PDmax were considered on the preferential basis. Energy usage for maintenance is followed by energy usage for protein accretion, which is followed by PDmax curve. PDmax curve is set up by numerous studies (Carr et al., 1977; Moughan and Verstegen, 1988; Thompson et al., 1996; De Greef et al., 1994; Van Lunen and Cole, 1998; Weatherup et al., 1998).
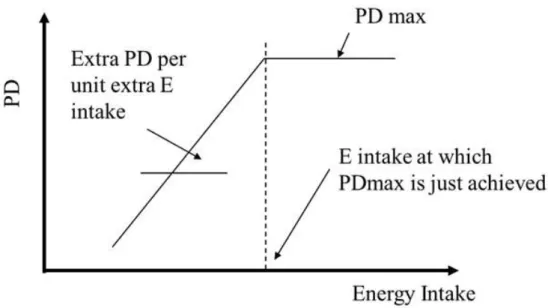
In Figure 3 is displayed the interrelationship between energy intake and body protein deposition. When body weight reaches certain amount, protein deposition slowly increases while energy intake approaches PDmax point (This is on the assumption that there are no factors hindering the
Figure 3. Relationship between energy intake and body protein deposition(PD) in growing pigs (Swine nutrition, 2nd edition)
protein deposition.) (Campbell and Taverner, 1988; Bikker et al., 1995, 1996; Quiniou et al., 1995, 1996). More energy intake from this point on results only in more lipid deposition. This will lead to fatter carcass and poorer feed efficiency. Pig farming is most efficient when energy intake is at PDmax level.
PDmax point in growing-finishing pig is between 90~160 g/day (Carr et al., 1977; Moughan and Verstegen, 1988; Thompson et al., 1996). Recently, boars occasionally show PDmax of above 200 g/day (De Greef et al., 1994; Van Lunen and Cole, 1998; Weatherup et al., 1998). This shows that PDmax can be enhanced to a great extent, which is linked to great possibilities of lean growth through genetic selection. PDmax curve can be maintained or increased as energy intake in a 40 ~ 90 kg weighing pig, depending on pig’s genotype (Campbell and Taverner, 1988; De Greef et al., 1994; Quiniou et al., 1995; Bikker et al., 1996).
PDmax is highest in boars, then in gilts, and is lowest in castrates. When fully grown, there is approximately 5% difference in PDmax between gilts and castrates (Moughan and Verstegen, 1988; Stranks et al., 1988; Thompson et al., 1996), approximately 20 ~ 30% difference between boars and castrates (Moughan and Verstegen, 1988; Van Lunen and Cole, 1998).
1.4 Lipid Deposition
Protein deposition and lipid deposition occur simultaneously, but extra dietary energy is utilized first in protein deposition and then on lipid deposition.
Whittemore (1993) defined ‘target fat’ as the minimum amount of fat when animals would feel physiologically comfortable, so that available nutrients can be properly shared, and metabolism for reaching potential rate of lean tissue growth can be maximized. When remaining energy level for lipid deposition is lower than certain target fat level, achievement of protein deposition rates will be altered to achievement of target fat levels. This condition would set the physiological priority to restore fat levels to target fat level. Whittemore et al. (1988) explains the minimum amount of lipid (connected to the amount of protein deposition a growing pig can achieve) through the target fat level. This is because protein gains will be held back until target fat level is reached. Before lean-tissue growth rate reaches the full extent, the ratio of fat to lean will indicate the percentage of fat in the gain, which is the target level (Figure 4, Whittemore, 1993).
Kyriazakis and Emmans (1992) explained that the rate of lipid deposition is determined by the protein deposition rate that an animal may
Figure 4. The ratio of lean to fat in gain (Whittemore, 1993)
achieve in its attempt to reach the normal level in a non-limiting environment. If the animal lacks in both protein and lipid level, each will aid the other in their balance. Increasing feed intake in the state of protein deficiency improves lipid retention rates (Kyriazakis and Emmans, 1992; Ferguson and Gous, 1997; Ferguson et al., 2000).
Whittemore (1998) explains, when animals become or are made overweight (through high quality diet, for example), they use remaining body fat to maintain their normal protein level, or they accumulate less lipid to restore by the lipid : protein ratio. Ferguson and Theeruth (2002) states that empty bodies of the pigs that are provided high-protein diet showed notably lower response from the lipid : protein ratio compared to those provided with low-protein diet, also agreed with Kyriazakis and Emmans (1991) and Ferguson and Gous (1997) reports. Pigs given feed of deficient
protein are reported to acquire lipid rapidly compared to those given feed with appropriate amount of protein, and try meeting their potential protein growth rate (Kyriazakis et al., 1991; Ferguson and Gous, 1997).
2. Dietary Energy of Growing-Finishing pig
2.1 Effect of Dietary Energy Levels in Growing-Finishing Pigs
Dietary energy level is an important factor for having variety in feed intake. Controlling feed intake is dependent on energy density. Pettigrew and Moser (1991) explained that growing-finishing pigs generally showed less average daily feed intake (ADFI), more average daily gain (ADG) and gain to feed ratio (G : F) when provided with high dietary energy level. Few
studies suggested that increasing energy in growing-finishing pigs’ diet —
although it did not have noteworthy effect on body weight and ADG —
enhanced G : F (Baird et al., 1958; Clawson et al., 1962; Wagner et al., 1963). Chadd and Cole (1999), Smith et al. (1999) and De la Llata et al. (2001) however, represented that energy level too low for pigs lessened the energy intake and growth performance. Energy level too high on the other hand (according to Stahly et al. (1981), Southern et al. (1989), Williams et al. (1994) and Dunshea et al. (1998)), decreased ADG, ADFI and G : F. Cromwell et al. (1978) and Matthews et al. (2003) claimed different results altogether, stating different levels of energy on growing-finishing pigs do not affect growth rate and ADFI.
Stahly (1984) pointed to fat as a crucial component in
growing-finishing pigs’ diet, having high energy level. According to Young et al. (2003), adding 2.5% and 5% fat in the feed for growing-finishing
pigs resulted in similar ADG and G : F. Haydon et al. (1989) claimed likewise, that 5% fat added for growing pigs did not produce any effect on their growth performance. However, adding 4.5% or 10% fat produced higher G : F and lower ADFI (Southern et al., 1989; Azain et al., 1991; Williams et al., 1994; Matthews et al., 2003). Some experiments achieved enhanced ADG and G : F in summer season by adding 5% fat in growing-finishing pigs’ diet (Stahly and Cromwell, 1979; Stahly et al., 1981). De la Llata et al. (2001) reported enhanced ADG and G : F, reduced ADFI by adding 0%-6% of fat with 3.31~3.61 Mcal.
2.2 Dietary Energy Level and Fat Deposition
Pigs nowadays are leaner and require less feed intake. This means that growth rate can be enhanced by increasing energy intake, and pigs are less likely to become fatter (Young et al., 2003). Additionally, humans have achieved the desirable level of energy density in growing-finishing pigs’ diet. Many countries have found diets using the available energy sources with least cost to satisfy the energy levels of pigs. Quite a few studies report that increasing energy density by including fat in growing-finishing pigs’ diets generally enhances ADG and feed efficiency, while cutting down the ADFI. Pigs up to 59 kg go through an energy-dependent phase in growing phase (De la Llata et al., 2001). Bikker et al. (1996) noticed an energy-dependent phase in gilts from 45 ~ 85 kg and reasoned that protein deposition increased with more energy intake. Pigs from 93 ~ 120 kg were not in an energy-dependent phase, and therefore energy density of diet did not boost ADG. Smith et al. (1999) similarly observed added dietary fat had
no effect on ADG from pigs weighing 73 ~ 104 kg. Put together, it can be said that dietary energy density is a crucial factor in protein or fat deposition. If pigs get more dietary energy than needed in growing phase, they will use leftover energy in lipid deposition or other body functions. If they get less than required, however, they will spend the energy not only in protein deposition but also in fat deposition. In finishing phase, dietary energy will be used in maintenance and protein deposition, and the excess will usually be spent in lipid deposition.
There are many studies demonstrating the relationship between dietary protein level and fat deposition in animals. Several reports that decrease in dietary protein level causes increase in fat deposition (Cromwell et al., 1978; Karlsson et al., 1993; Chiba et al., 2002). Teye et al. (2006) states that researchers have been applying CP diets containing unbalanced amino acids with net energy in order to bolster pigs’ fat deposition (especially IMF). There are still some claims, however, of inclination for higher fat deposition with low-protein diets, even if the pigs are supplied balanced amino acids (Figueroa et al., 2002; Gomez et al., 2002b). Wood et al. (2013) study states that feeding low-protein diet, especially those with unbalanced amino acids content, boosted the IMF accumulation. This study, however, does not display much difference between low-protein diet group and control group in subcutaneous or intermuscular fat deposition.
Several studies explain the reason behind fat deposition when low-protein diets are provided. The gap between lipogenesis and lipolysis rates decides fat deposition. The reactions are controlled by metabolic enzymes and functional genes in the growth, and the following development process of muscle tissue (Wang et al., 2012). Jurie et al. (2007) suggested
that fatty acid transport in muscle tissue also regulates IMF deposition.
Chen et al. (2008) discovered a beneficial link between IMF deposition and expression level of SREBP-1 messenger RNA (mRNA) in muscle tissue of pigs. Some other studies also discovered a connection between stearoyl-CoA desaturase (SCD) protein expression and the amount of total fatty acids in muscle of pigs that are provided a low-protein diet (Doran, 2006). Wang et al. study (2012) claimed that low-CP diet increases the mRNA and protein expression of SREBP-1c, ACC, FAS and SCD. mRNA and protein expression level of lipolytic genes including HSL and CPT-1 were seen to decrease in the low-protein diet group. Furthermore, a positive connection between an elevated IMF content in pigs that are fed low-protein diet and activation of PPAR-γ and H-FABP mRNA expression is also suggested (Guo et al., 2011). According to Zhao et al. (2010), pigs fed low-protein diet showed increase in subcutaneous fat deposition. This result was induced primarily by up-regulation of lipogenic genes for pigs weighing 60 ~ 100 kg, down-regulation of lipolytic genes for pigs weighing 60 kg, and up-regulation of lipolytic genes for those weighing 100 kg.
Dietary protein level affects muscular fatty acid composition. Wang et al. (2012) claimed that pigs with low-protein diet showed higher concentration of C18:2, C18:3 and poly-unsaturated fatty acid (PUFA) than pigs with high-protein diet. The difference of fatty acid composition between low-protein/high-protein diet may come from the variance of SCD. According to Cohen and Jeffrey (2004), SCD is accountable for the generation of mono-unsaturated fatty acids, which catalyzes its substrates palmitic (16:0) and stearic acid (18:0) to produce palmitoleic (16:1) and oleic acid (18:1). Wang et al. (2012) demonstrated that pigs fed low-protein
diet showed higher mRNA and protein expressions of SCD than those of high-protein diet. Additionally, Wood et al. (2013) pointed out that oleic acid is the central outcome from de novo fat synthesis in pigs and deduced that its concentration is heightened as the pig gets fatter.
Meanwhile, there are studies displaying considerably lower PUFA and higher IMF content in pigs with low-protein diet (Teye et al., 2006; Alonso et al., 2010). Lambe et al. (2013) claimed that the CT scans of growing pigs showed no meaningful differences in total fat deposition.
2.3 Effect of Dietary Energy Level on Growth Performance
High dietary energy diet for growing-finishing pigs generally enhances ADG, G : F and carcass fatness, and diminishes ADFI (Pettigrew and Moser, 1991).
Young et al. (2003) demonstrates that through quadratic effect of added fat, adding 2.5% fat in the diet caused 2% enhancement in ADG; adding 5% fat resulted in 2.1% increase in ADG. Feed efficiency also was almost coinciding among 2.5% and 5% added fat levels. Following these results, adding 5% or 10% fat in growing-finishing pig’s diet increased G : F and decreased ADFI (Southern et al., 1989; Azain et al., 1991; Williams et al., 1994). Furthermore, growing-finishing pigs bred in high temperature conditions showed enhanced ADG and G : F when fed diet of high energy level with 5% added fat, without difference in carcass leanness (Stahly and Cromwell, 1979; Stahly et al., 1981). Increasing fat percentage with 3.31 ~ 3.61 mcal (De La Llata et al., 2001) or energy density (Smith et al., 1999) also proved effective in boosting ADG and G : F while decreasing ADFI.
Feeding increasing choice white grease have been observed to garner similar effects in growing-finishing pigs (Stahly and Cromwell, 1979; Stahly et al., 1981). Campbell and Taverner (1986) and Southern et al. (1989) also reported enhancement of ADG in pigs provided with added fat.
Few researches report important advancement in feed efficiency by adding energy, albeit seeing no noteworthy effect on growth rate (Baird et al., 1958; Clawson et al., 1962; Wagner et al., 1963).
Smith et al. (1999) introduces an experiment of adding 0%, 1.5%, 3%, 4.5% and 6% CWG in the diet of growing-finishing pigs (energy density ranging 3.31 ~ 3.56 mcal/kg of ME in growing diets, 3.32 ~ 3.56 mcal/kg of ME in finishing diets). As energy density increased, ADG and ADFI were lessened, and feed efficiency saw improvement during the course of experimental phase (44.5 ~ 104.3 kg). Tribble et al. (1979), Stahly et al. (1981) and Southern et al. (1989) coincided with the outcome.
Apple et al. (2004) conducted an experiment centered on energy density in finishing phase (3.30 mcal/kg and 3.48 mcal/kg). During the final week of finishing phase, pigs fed 3.48 mcal/kg showed higher ADG then those fed 3.30 mcal/kg, although no such important variation was seen in other phases. Le Dividich et al. (1987) and Matthews et al. (2003) describes no noteworthy result on ADG despite having increased the energy density of late-finishing diets. Williams et al. (1994) and Dunshea et al. (1998) failed to find any interactions between energy density and growth rate in pigs. Again, Seerley et al. (1978), Campbell and Taverner (1986) and Southern et al. (1989) reported to have seen the effect of increased dietary energy on feed efficiency.
between dietary energy level and growth performance of growing-finishing pigs. Cromwell et al. (1978) and Matthews et al. (2003) stated no influence of higher dietary energy level on growth performance and feed intake, respectively. Matthews et al. (2003) elaborated that high-ME diet (added 200 kcal by 4.5% fat to control diet) did not affect ADG in pigs’ early growing phase (although ADFI was increased and G : F was decreased). The ME level in diet did not have noteworthy influence on the growth performance during other phases (late-grower, early-finisher, late-finisher and overall phases). Haydon et al. (1989) also concurred with aforementioned reports that 5% added fat did not affect growth performance.
2.4 Effect of Dietary Energy Level on Carcass Characteristics
Energy level is closely related to carcass fat level in pigs that are provided ad libitum access to feed.
Stein and Easter (1996) experimented with finishing pigs (weighing 55 ~ 112 kg), feeding them diet with 2,700 ~ 3,500 kcal/kg of ME. When dietary energy increased from 3,300 kcal/kg to 3,500 kcal/kg of ME, feed intake lessened. At lower energy density in diet, no change was observed in feed intake. Dietary energy below 3,300 kcal/kg of ME increased carcass lean content. It can be concluded from this experiment that low dietary energy density helps increasing the carcass lean content. Factors pointed out to increase carcass fatness in growing-finishing pigs include added fat (Pettigrew and Moser, 1991), dietary ME (Seerley et al., 1978; Coffey et al., 1982; Myer et al., 1992) and energy intake (Nossamen et al., 1991; Ellis et al., 1996; Wood et al., 1996). Cromwell et al. (1978) and Ellis et
al. (1996) observed increased LM area following increased dietary energy intake. Myer et al. (1992) and Matthews et al. (2003) reported few instances when energy density didn’t affect LM area. Other studies claimed that marbling and IMF content was increased by higher dietary energy density (Cromwell et al., 1978; Le Dividich et al., 1987) or energy intake (Ellis et al., 1996; Wood et al., 1996; Lebret et al., 2001). Drew et al. (1971) experimented with the diet of 10% added fat and discovered that IMF content was higher in longissimus (22.4% vs 14.6%) and gluteus medius (14.7% vs 11.1%). According to Wagner et al. (1963), when IMF was augmented in high-energy diet, no difference could be observed in nitrogen content of the meat. It induced thicker carcass backfat, lower lean cut yield, and notably higher dressing yield. Additionally, increase in energy level
produced higher dressing yield — matching the claims of Bowland and
Berg (1959) — and decrease in energy level produced lower lean cut yield
— also proposed by Mulholland et al. (1960). Sewell and Cartoon (1959) study, on the other hand, claimed no relationship between energy level in diets and total yield of lean cuts.
Cromwell et al. (1978) states that dietary fat has no influence on carcass characteristics except for lower yield of lean cuts. Similarly, Matthews et al. (2003) explained that no difference in carcass traits were made by ME level in diet. According to them, carcass temperature (45 min.) and CIE L value showed some increase in pigs given high-ME diets, but shear force was decreased. According to Apple et al. (2004), energy density in finishing pigs’ diets did not affect hot carcass weights and dressing percent. In fact, dietary energy density (3.30 or 3.48 Mcal) did not affect any quality traits (e.g., muscle pH, drip loss, meat color, marbling,
firmness, moisture, protein, lipid, ash, cooking loss and shear force). Other researches also concur that dietary energy level is insignificant regarding ultimate LM pH, drip loss percentage (Matthew et al., 2003), meat color and firmness (Coffey et al., 1982; Matthews et al., 2003), marbling scores and intramuscular lipid content (Seerley et al., 1978; Coffey et al., 1982; Myer et al., 1992), and cooking loss (Matthews et al., 2003; Lebret et al. 2001).
Backfat thickness is strongly related to carcass fatness in regard to pork quality and can be an indirect indication of pork quality. Cromwell et al. (1978) claimed that pigs produced more carcass backfat when provided with diet that was higher in energy level. This outcome many other researchers agree to, such as Heitman (1956), Kennington et al. (1958) and Boenker et al. (1960). Smith et al. (1999) measured 10th rib fat depth or longissimus muscle area with real-time ultrasound before slaughter and saw no effect of energy density. After slaughter, however, backfat thickness showed a variance according to different dietary energy density. These discrepancies between the real-time ultrasound and commercial plant fat depths might be coming from the skinning procedure during the slaughter process. Apple et al. (2004), comparing with pigs fed low-energy diets (3.30
mcal/kg), stated that pigs’ fat thickness — measured with ultrasound — was
greater on d14 and 28 in pigs fed high-energy diets (3.48 mcal/kg). However, dietary energy level did not affect scanned LM area or live weight.
There have been many studies claiming low-protein diet elevates the IMF deposition (Teye et al., 2006; Alonso et al., 2010; Wood et al., 2013). According to Fernandez et al. (1999), increase of IMF content in muscle
may be of good influence on meat quality (such as tenderness, flavor, juiciness, and the nutritional value of meat). Various studies agree with this relationship between the meat quality and IMF content in meat that was fed a low-protein diet (Cisneros, Ellis, Baker, Easter and McKeith, 1996; Teye et al., 2006). Font-i-Furnols et al. (1987) went on to report that pork with high IMF content won favor from consumers. Dikeman (1987) stated that IMF activates saliva secretion and improves the juiciness by coating the inside of the mouth. Accordingly, pig farms strived to gain pork with enough IMF content that, not only guarantees taste but also assuages health-related issues concerning high-fat pork (Fortin et al., 2005). (According to Zhang et al. (2007), high consumption of saturated fatty acids heightens the plasma cholesterol level, which may bring cardiovascular disease.)
As of meat color, increase of Hunter L* value in pork fed low-protein diet contributes to visual aspects, giving it more lightness (Suárez-Belloch et al., 2016; Teye et al., 2006). Also, Hunter b* value has been reported to have connection with marbling (Suárez-Belloch et al., 2016). Goerl et al. (1995) observed that low-protein diet increases the Hunter b* value of pork.
Glycolytic potential refers to the potential amount of all muscular substrates that will be utilized in generating lactate after butchery (Monin and Sellier, 1985). It is another crucial factor, considering the effect muscle glycogen content at slaughter has on the rate and the extent of post-mortem pH drop (Henckel et al., 2000). According to Huff-Lonergan and Lonergan (2005), glycogen contained in muscle produces lactic acid during glycolysis, resulting in lower pH level. Ruusunen et al. (2007) observed higher
NRC, 1998 BW, kg 5-10 10-20 20-50 50-80 80-120 ME, kcal 3,265 3,265 3,265 3,265 3,265 CP, % 23.7 20.9 18 15.5 13.2 Lys, % 1.35 1.15 0.95 0.75 0.6 Met, % 0.35 0.3 0.25 0.2 0.16 NRC, 2012 BW, kg 7-11 11-25 25-50 50-75 75-100 100-135 ME, kcal 3,400 3,350 3,300 3,300 3,300 3,300 CP, %1) 20.6 18.9 15.7 13.8 12.1 10.4 Lys, % 1.53 1.4 1.12 0.97 0.84 0.71 Met, % 0.44 0.4 0.32 0.28 0.25 0.21 1)Calculated from total nitrogen X 6.25
glycolytic potential in pigs fed low-protein diet than in pigs fed high-protein diet. Katsumata et al. (2003) study shares similar point, claiming higher glycogen content in the low-lysine group than the high-lysine group.
3. Dietary Protein and AA in Growing-Finishing Pig
3.1 Protein and amino acid requirements for swine diets
3.1.1 Transition of Protein and Amino Acid Requirements in NRC
Table 7 is the change of protein and amino acid requirements set by NRC. Growth phase is more detailed in 2012 model than in 1998 model. This elaboration can aid in pig farmers’ saving the feed cost and decreasing excess nutrient composition of the feed. 2012 model displays higher ME as well, from 3,265 kcal to 3,300 kcal. Moreover, it shows lower CP requirement and higher amino acids requirement compared to its previous report; this comes from preventing lack of limiting amino acids (or imbalance of them). Any deficiency of essential amino acids caused by low-CP diet is suggested that they be filled out by crystalline amino acids.
3.1.2 Transition of Ideal Amino Acid Profile
Lack of limiting amino acids may hinder protein synthesis in the body. However, they are essential amino acids that can easily be insufficient in the feed. Mainly, the first limiting amino acid is lysine.
Mitchell (1964) report was first of many researches that specified the ‘ideal amino acids profiles.’ It indicates amino acids profiles that are adequate for animals’ performance, so that all amino acids are equally limiting. ARC (1981), based on the pig carcass, displayed the ideal amino acid ratio of essential amino acids. Wu (2010) however, claimed that their report centers only on the essential amino acid composition of the animal body. Similarly, Wu (2014) claimed that ARC’s ideal protein concept fails to consider the relative contribution of maintenance to the total amino acid pigs need. It goes on to assert that ARC did not include arginine, glycine and all synthesizable amino acids.
Wang and Fuller (1989) provided another ideal amino acid profile. They took account of the requirements for both maintenance and tissue protein accretion. Their study featured high content of glutamate in the diet, a reinforcement for non-specific nitrogen source. Non-specific nitrogen source was thought to make up for lack of non-essential amino acids.
Baker made an attempt to assess the amino acid requirements of pigs between 1990 and 2000. Chung and Baker (1992) produced the ideal amino acid profile that includes arginine, glycine, histidine and proline. Their report does not take into account other synthesizable amino acids. They don’t elaborate on the reason for using arginine, glycine, histidine and proline proportions to lysine. Whether glutamate is an effective precursor or not,
and the influence of high glutamate content on metabolism is also not explained thoroughly. NRC and Baker (2000) does not include proline or glycine in ideal amino acids profiles.
Meanwhile, NRC (2012) increased the requirement of amino acid for pigs, while keeping the ratio among amino acids unchanging. This made the need of limiting amino acids increased. Plus, lower CP level brought about new limiting amino acids such as valine.
3.1.3 Effects of Dietary CP Levels in Growing-finishing Pigs
Growing-finishing pigs, when fed enough CP level in diet, showed higher ADG, G : F and carcass leanness (Gilster and Wahlstrom, 1973; Kornegay et al., 1973; Easter and Baker, 1980). According to Cromwell et al. (1978), diets with dietary CP level from 12 ~ 16% caused greater weight gain and G : F. Cromwell et al. (1993) and Chen et al. (1995) saw similar response in ADG and G : F when fed higher CP content diet. Cromwell et al. (1978) also noticed no influence on growth performance when dietary CP level ranges from 16 ~ 20%. Wagner et al. (1963) observed that boosting the CP level from 13% to 25% caused enhancement in ADG.
Kerr et al. (1995) study states that when fed low-CP diets (15-12-11%), pigs should be supplemented with lysine, tryptophan and threonine. Pigs with high-CP diets (19-16-14%) showed no such need. Growing-finishing pigs mostly showed low ADG and G : F when fed low-CP diets without amino acids supplementation. Also, compared to those fed high-CP diets, their carcasses displayed smaller longissimus muscle,
thicker average backfat, and lower percentage of muscle overall (Gilster and Wahlstrom, 1973; Kornegay et al., 1973; Easter and Baker, 1980). Cromwell et al. (1996) and Tuitoek et al. (1997) claimed that decreased CP level (2-3%) with amino acids supplementation did not have negative influences on ADG and G : F of growing-finishing pigs. Plus, CP level lower than 3% did not decrease ADG and G : F in growing-finishing pigs (Hahn et al., 1995; Kerr et al., 1995). Hansen and Lewis (1993) and Gomez et al. (2002b) show different results.
3.2 Dietary Protein and AA Metabolism 3.2.1 Lysine Metabolism
Numerous studies established for decades that dietary supply of protein, or its components, amino acids are crucial to the pigs’ growth and development of muscles. About 20 natural amino acids exist that are utilized in protein biosynthesis (called standard proteinogenic amino acids). Not all amino acids are essential dietary components, since through de novo synthesis pigs can acquire approximately 10 of them. ‘Essential amino acids’ refer to those that pigs cannot acquire on their own (or at least not enough for their metabolic needs) and need to be provided from outside sources (Fuller et al., 1987). Lysine is the first and main limiting one among these essential amino acids, it being the most lacking amino acids in almost every swine diets based on cereal grains (Lewis, 2001; NRC, 2012). This reason puts lysine in a predominant position in nutritional management of the pigs (Figure 5).
Figure 5. Lysine catabolism in monogastric animals. (Chung, 2018)
Papes et al. (1999) and Gatrell et al. (2013) stated that the main pathway of lysine catabolism is the saccharopine pathway in liver. By the catalysis of lysine-ketoglutarate reductase, lysine is initially combined with α -ketoglutarate to produce saccharopine. Then, saccharopine is transformed to α-aminoadipic-6-semialdehyde and glutamate by saccharopine reductase. Saccharopine reductase (also called saccharopine dehydrogenase), like lysine-ketoglutarate reductase, is a part of a polypeptide, bifunctional aminoadipate δ-semialdehyde synthase (Gatrell et al., 2013). Through several more phases, the α-aminoadipate-6-semialdehyde will then be transformed to acetyl-coenzyme A (Wu, 2013). This pathway is a rare reaction, because ε -amino group is carried to α-ketoglutarate and then to the general nitrogen pool. Oxidizing acetyl-coenzyme A generates CO2 and energy through the citric acid cycle.
1) Physiological Functions of Lysine
Lysine, apart from metabolic functions, plays a part in physiological functions of monogastric animals as well. Lysine influences metabolism of nutrients, hormone production, and immunity of animals (Wu, 2010a; Wu, 2013). Peptide-bound lysine is also where post-translational modification and epigenetic regulation of gene expression happens. In order to utilize lysine properly for animals, scientists and farmers need to be well-acquainted with these functions that lysine can provide.
2) Lysine Mechanism and Perspectives
Wittmann and Becker (2007) mentions that late 1980s saw an introduction of commercial feed-grade crystalline lysine in animal feed industry. Animal nutritionists should take into deep consideration the replenishment of dietary lysine, since the lack of lysine impedes animals’ health maintenance and growth performance. (Oversupply of lysine, on the other hand, is harmless.)
Dietary supplementation of crystalline lysine is proved to aid in muscle protein accretion and whole-body growth of pigs. Researchers found out that lysine supplementation helps in nitrogen retention and protein accretion, as well as the growth performance of the animals (Sharda et al., 1976; Fuller et al., 1987; Salter et al., 1990; Shelton et al., 2011). Additionally, Salter et al. (1990) attributed the increase of muscle protein accretion to the increase in the rate of protein synthesis, as opposed to the decrease in the rate of protein degradation.
The metabolic/molecular mechanisms in which dietary lysine controls muscle mass accumulation in pigs was not clarified (Wu, 2010b; Rezaei et
al., 2013). Then, Liao et al. (2015) discovered the metabolic and physiological roles of lysine, concerning swine muscle growth and development. Relevant studies have been scarce concerning pigs, and so much of the knowledge amassed up to now have been dependent on studies of other monogastric animals, including humans.
3.2.2 Methionine Metabolism
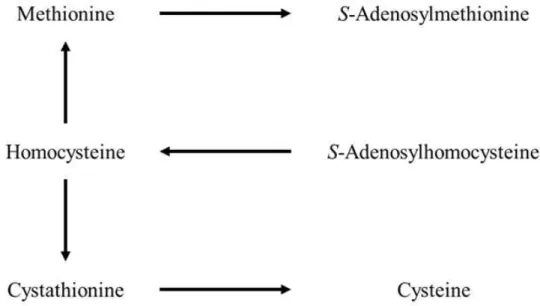
There are metabolic relationships between methionine and cysteine that are now academically accepted (Figure 6). Methionine, by adenosine
triphosphate, can be turned into S-adenosyl methionine. This
methionine-derivative gives its methyl group to various acceptors
(Finkelstein, 1990). S-adenosyl-L-homocysteine is formed, and then is hydrolyzed to homocysteine and adenosine. Homocysteine holds a pivotal place, since it can be recycled into methionine, or be condensed with serine, forming cystathionine and then cysteine. The fact that the conversion of homocysteine into cysteine is irreversible is noteworthy (Bauchart-Thevret et al., 2009). Overall, these metabolic pathways show that methionine can be transformed into cysteine, but not so vice versa. De-/re-methylation process between methionine and homocysteine in the activated methyl cycle needs B-vitamin coenzymes (Finkelstein, 1998).
Figure 6. Metabolic pathways of sulfur amino acids. (Chung, 2018)
3.2.3 Tryptophan Metabolism
Another essential amino acid is tryptophan. It is a crucial component for its biological roles, main one being its connection to metabolic pathways involved in tryptophan catabolism. Tryptophan is a precursor for the synthesis of serotonin, a neurotransmitter related to mood, stress response, sleep and appetite regulation. From the perspective of quantity, the rate of tryptophan usage in creating serotonins is very low. This is because the tryptophan transport and availability in the brain might be limiting for the synthesis of brain serotonin. Diets with low tryptophan lower feed intake. The mechanism concerning this effect of low tryptophan diets is generally linked with the relationship between tryptophan and serotonin. Adding the fact that tryptophan is one of the essential amino acids that can only be gained from outer source, it can be suggested that deficiency of tryptophan limits protein synthesis, accretion and growth rate.