58-2 / H. Yaguchi
• IMID 2009 DIGEST
Abstract
This template provides you with an example of the The CIE Color Appearance Model (CIECAM02) is now widely used for various digital imaging systems including digital displays. The CIECAM02 were intended to be an empirical model, however, some aspects of the model are closely related to the human color vision mechanism. This paper will discuss the relationship between human color vision and color imaging.
1. Introduction
The human visual system consists of several stages. At first, light waves reflected from the object are refracted by the cornea and the lens to focus its image on the retina. Photons of light from the object activate photoreceptors, called rods and cones. The rods mediate vision at low luminance levels, called scotopic vision, while cones serve vision at higher luminance levels, called photopic vision. Photoreceptors are followed by the horizontal cells where the photoreceptor signals are segregated into the luminance information and the chromatic information. Then, the information proceed to the ganglion cells via bipolar cells. Outputs from the retina proceed to the lateral geniculate nucleus (LGN). The LGN consists of six layers of cells. The two lower layers called the magnocellular cells transmit data of the object’s motion and overall features. The four upper layers of cells called the parvocellular cells transmit information related to color and fine detail. Thus the brain segregates visual information into parallel steams for further processing. The analyzing of information continues in the primary visual cortex and dozens of other visual areas in the brain. This is the whole stream of the visual information processing.
The CIE Color Appearance Model (CIECAM02)1 might be one of the application of the human color
vision to the color imaging field. The CIECAM02 was intended to be an empirical model, however, some aspects of the model are closely related to the human color vision mechanism. In this lecture, I will introduce a couple of our researches in the steam of human color vision.
2. Photoreceptor stage
2.1. Rods and cones –Mesopic color appearance
model–
Human visual system covers a wide range illuminance range from 105 lx to 10-3 lx. This wide dynamic range is achieved with two kinds of photoreceptors in the retina, rods and cones. There are illuminance levels where both rods and cones are active. The vision at these levels is called mesopic vision. Color appearance in mesopic vision differs from that in photopic or scotopic vision. Imaging systems on the market such as digital cameras and photographic films, however, are based on the human color vision in photopic vision. So, it is hard to reproduce image that would be seen in mesopic vision by the current imaging system. In order to predict a color appearance in mesopic vision, we have to consider the interaction between cone and rod. We carried out haploscopic color matches to investigate the color appearance under various illuminance levels, ranging from photopic to scotopic via mesopic levels2. Using these experimental data, we developed a color appearance model applicable in mesopic vision3.
Our model puts a rod intrusion in each of the opponent channels and rod signals and their amount varied depending on the illuminance levels and on the channels. The amount of the cone signals also varied depending on the illuminance levels and on the channels. The weight of cone signals decreases with decrease in illuminance while the weight of rod
Color imaging and human color vision
Hirohisa Yaguchi
Graduate School of Advance Integration Science, Chiba University,Chiba 263-8522, Japan
Tel.:81-43-290-3472, E-mail: [email protected]
Keywords: color vision, color appearance model, mesopic vision, color matching
58-2 / H. Yaguchi
IMID 2009 DIGEST • signals increase. The output of each channel is
formulated in Equations. (1), (2) and (3),
A E( )=α( )E KW Lp+ Mp
(
)
Lp+ Mp(
)
W+β( )EK ′ W ′ Y ′ Y W ⎛ ⎝ ⎜ ⎞ ⎠ ⎟ γ (1) r / g E( )= l E( )(
Lp− Mp)
+ a E( )Y ′ (2) y / b E( )= m E( )(
Lp+ Mp− Sp)
+ b E( )Y ′ (3)where Lp, Mp and Sp represent cone stimulus values at
photopic condition, and A(E), r/g(E) and y/b(E) represent outputs of the luminance, red/green and yellow/blue channels at illuminance level of E. Y’ represents the scotopic luminance factor, which can be regarded as rod output. Y’ is calculated for each test chip by the CIE spectral luminous efficiency V’(λ). The weighting coefficients, α(E) and β(E) indicate contribution amounts of photopic and scotopic luminance as a function of illuminance E. Kw and K’w
indicate the maximum response (the response to white) of the luminance channel at photopic and scotopic levels, and γ is the parameter to express the nonlinear relationship between photopic and scotopic luminance channels. The weighting coefficients, l(E) and a(E) indicate contribution amounts of the photopic red/green process (red/green signal made of L- and M-cone outputs) and rod to the red/green channel. The weighting coefficients, m(E) and b(E) indicate contribution amounts of the photopic yellow/blue process (yellow/blue signal made of L-, M- and S-cone outputs) and rod to the yellow/blue channel. These weighting coefficients vary with illuminance level of E to express the change of contribution amounts of the factors among different illuminance levels.
2.2. Color matching functions –Individual difference
of cone4–
Many studies have shown that the color matching functions differ from one observer to another. When a given observer makes a color match between two color stimuli having different spectral power distribution, such as the color on the self-luminous display and an illuminated color chip, these two stimuli are metameric pair for him or her. However, changing the observer to one characterized by a different set of color matching functions will, in general, result in a color mismatch between two stimuli. The magnitude to the color mismatch may be taken into account to estimate the tolerance of color difference between a self-luminous display and reflection prints in the field of the color reproduction
in the imaging industries. We evaluated the magnitude of color mismatch caused by changing observer from the CIE 1931 Standard Observer to each of 10 Stiles-Burch 2° observes5
.
We supposed that the CIE 1931 Standard Observer and 10 observers determined with 2° field by Stiles and Burch would make color matches between illuminated color samples and stimuli presented on a CRT display. We used the Macbeth Color Checker as color samples and either the CIE D65 illuminant and a fluorescent lamp simulating D65 as an illuminator. Each color samples was supposed to be color-matched by an appropriate additive mixture of three primary colors of a color monitor. A color match between an illuminated color sample and stimulus on the CRT monitor is expressed by Equation (4). ρj( )λS( )λr i( )λdλ
∫
ρj( )λS( )λg i( )λdλ∫
ρj( )λS( )λb i( )λdλ∫
⎡ ⎣ ⎢ ⎢ ⎢ ⎤ ⎦ ⎥ ⎥ ⎥ = o( )λr i( )λ dλ∫
∫
p( )λr i( )λdλ∫
q( )λr i( )λdλ o( )λg i( )λdλ∫
∫
p( )λg i( )λdλ∫
q( )λg i( )λdλ o( )λb i( )λdλ∫
∫
p( )λb i( )λdλ∫
q( )λb i( )λdλ ⎡ ⎣ ⎢ ⎢ ⎢ ⎤ ⎦ ⎥ ⎥ ⎥ Ri, j Gi, j Bi, j ⎡ ⎣ ⎢ ⎢ ⎢ ⎤ ⎦ ⎥ ⎥ ⎥ (4)where , ρj(λ) is the spectral reflectance of the j-th color patch, S(λ) is the spectral irradiance of the illuminant, r i( )λ , g i( )λ, b i( )λ are the color matching functions for the i-th observer, o(λ), p(λ), q(λ) is the spectral radiance of the red, green and blue primary of the CRT monitor, respectively, and Ri,j, Gi,j, Bi,j, are the tristimulus values for the CRT monitor for the j-th color patch color-matched by the i-th observer. Then tristimulus values for each observer were transformed to XYZ tristimulus values by the following equation,
Xi, j Yi, j Zi, j ⎡ ⎣ ⎢ ⎢ ⎢ ⎤ ⎦ ⎥ ⎥ ⎥ = o( )λx ( )λdλ
∫
∫
p( )λx ( )λdλ∫
q( )λx ( )λdλ o( )λy ( )λdλ∫
∫
p( )λy ( )λdλ∫
q( )λy ( )λdλ o( )λz ( )λdλ∫
∫
p( )λz ( )λdλ∫
q( )λz ( )λdλ ⎡ ⎣ ⎢ ⎢ ⎢ ⎤ ⎦ ⎥ ⎥ ⎥ Ri, j Gi, j Bi, j ⎡ ⎣ ⎢ ⎢ ⎢ ⎤ ⎦ ⎥ ⎥ ⎥ (5)We measured the mean color deviations from the CIE Standard Observer to 10 Stiles-Burch observers for each color patch of the Macbeth Color Checker. The results show that the color differences for color patches illuminated by the fluorescent lamp are relatively larger than those by the CIE D65 Individual variation among 10 observers was about 10 in ∆E*ab for the largest case.
58-2 / H. Yaguchi
• IMID 2009 DIGEST
3. Post-photoreceptor stage
-Linearity between Cone Stage and Opponent Color Stage6-When we make a color vision model we investigate the relation between the visual function at different stage of the human visual system. The visual functions are, however, different from observer to observer because of the individual differences of the ocular medium absorption, macular pigment, and so on. Such a individual difference sometimes becomes a problem to make a quantitative model. Therefore, a set of visual functions from a single observer is useful to make a color vision model. I measured many kinds of visual functions using my own eye. In this section, the linearity between the cone stage and the opponent color stage has been discussed my own color matching functions, the luminous efficiency function and the chromatic valence function.
At first, the spectral sensitivity of each type of cones must be determined. Cone sensitivities were determined by the following four assumption; (i) the cone sensitivity functions should be linear combination of the color matching function, (ii) the cone sensitivities should be positive values over the whole range of the wavelength, (iii) the cone sensitivity curves should have a single peak, and (iv) a shape of the cone sensitivity curve is similar to that of the π mechanism. The resultant cone sensitivity functions are presented in the following equations.
L( )λ = 0.303r ( )λ + 0.579g ( )λ + 0.0091b ( )λ (6)
M( )λ = 0.0223r ( )λ + 0.807g ( )λ + 0.0249b ( )λ (7)
S( )λ = 0.0005r ( )λ + 0.0203g ( )λ + 1.000b ( )λ (8)
These color matching functions are normalized at the peak wavelengths. The color matching functions r ( )λ ,
g ( )λ and b ( )λ are obtained by the maximum saturation method. Since the blue color matching function by the Maxwell method is deviated that by the MSM, another short-wavelength sensitive cone
S’(l) was determined by the following equation with
the color matching functions by the MWM.
′
S ( )λ = 0.0016r ( )λ + 0.0663g ( )λ + 0.995b ( )λ (9)
The luminous efficiency function was measured by means of flicker photometry. The experimental data was curve-fitted by the least squares method on the assumption that the luminous efficiency function by flicker photometry is a linear combination of cone sensitivity functions. A function predicted by this linear model is
a( )λ = 0.515L( )λ + 0.512M( )λ . (10)
There is no contribution of the S-cone.
Opponent-color response functions were measured by hue cancellation method developed by Jameson and Hurvich7. The r/g opponent-color response curve is fitted on the assumption of the linear transformation by the cone signal. In this case, S’(l) instead of S (l) was used for the S-cone sensitivity function because of its good fitness. The predicted r/g opponent-color response function is presented as
r / g( )λ = 2.745L( )λ − 3.402M( )λ + 0.797 ′ S ( )λ . (11) The y/b opponent-color response curve is, however,
not well fitted by the linear transformation hypothesis. Therefore, we must introduce a non linear transformation hypothesis for the y/b opponent color process. We applied the non linear transformation. The predicted y/b opponent-color function is
y / b( )= 0.991Lλ
[
( )− 0.021Mλ ( )λ]
5.4− 2.217 ′ S ( )λ . (12)
4. Brain stage
-Relation between Elementary Color Scaling and the Perceptive Attributes Specified withCIECAM028
-Color appearance may be specified with the perceptive attributes, such as lightness, chroma and hue. However, it is not easy to obtain these perceptive attributes directly from the psychophysical experiment. A type of experiment that permits a relatively direct gauging of the color appearance of the objects utilizes direct color scaling, or color naming. The elementary color scaling method is frequently used for evaluating color appearance because of its easiness. In the present study, color appearance of the objects illuminated with various light sources including white LEDs were measured by the elementary color scaling method, then we investigated a quantitative relationship between elementary color scales and the perceived attributes given by the color appearance model, CIECAM02. The elementary color scaling employed in the experiment is similar to the Natural Color System (NCS). The NCS system is based on the Hering’s opponent color theory. All colors are described in terms of unique hues: red, green, yellow, and blue plus white and black. In the experiment, subjects firstly were asked to rate the whiteness (w), blackness (s), and chromaticness (c) of a color to make total point 10. Then he or she rated the hue
58-2 / H. Yaguchi
IMID 2009 DIGEST • using one or two unique hues. The perceived hue was
rated with the red or green hue component (R or G) and the yellow or blue hue component (Y or B) to make total point 10. Consequently the color appearance of a color were rated with the whiteness (w), blackness (s), redness (r = cR/10), greenness (g =
cG/10), yellowness (y = cY/10), and blueness (b = cB/10). The total rating of the color description was
summed to 10. The set of JIS (Japanese Industrial Standard) color chips specified with the Munsell Color System was used for the experiment. We used 292 color chips consist of samples found at even value
V, even chroma C, and hue H labeled 5 and 10. Three
types of light source used for the present study were a fluorescent lamp as a simulator of CIE standard illuminant D65, and two white LED light sources of a blue LED and yellow phosphor type with the correlated color temperature 7500K and 2800K. The illuminance was 500 lux for all illuminants.
Based on the present experimental data, we tried to predict the elementary color scales, w, s, r, g, y, b using the lightness J, the chroma C, and the hue angle h given by the CIECAM02. According to the experiment results, it is found that the whiteness and the blackness of the equal lightness color decreased with increasing its chroma, so the whiteness w and the blackness s could be described as a function of the lightness J and the chroma C. The chromaticness c = (r or g) + (y or b), was nonlinearly related to the chroma C. The nonlinearity between chromaticness c and chroma C did not depend on hue. Each hue component, R, G, Y, B could be described as a function of the chroma C, the lightness J, and the hue angle h. We applied a binomial expression to the blackness and a linear equation to the chromaticness. Finally, we derived the following equations.
w = 10 –s – c (13) s = 0.0014J2
+ 0.0003C2 + 0.003JC -0.311J –
0.2C + 15 (14)
c = 0.125C – 0.0025J + 1.5 (15) The Gaussian function was applied to express the hue components as follows,
if h≤ 20 or 160≤ h, Y= (α+βJ+γC )exp −(h− 80)2 2σ2 ⎧ ⎨ ⎪ ⎩ ⎪ ⎫ ⎬ ⎪ ⎭ ⎪ ,(16) if 20< h ≤ 160, B= (α+βJ+γC ) exp− h− (273 − 0.8J) 2
{
}
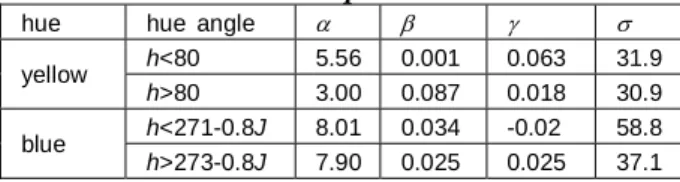
2σ2 ⎡ ⎣ ⎢ ⎢ ⎢ ⎤ ⎦ ⎥ ⎥ ⎥ , (17) if h≤ 70 or 250≤ h, R = 10 – (Y or B), (18) and if 70< h ≤ 250, G = 10 – (Y or B). (19) Coefficients α, β, γ, and σ in the yellow- and theblue-hue component also depend on blue-hue angle as Table 1.
Table 1. Coefficients for the yellow- and the blue-hue component.
hue hue angle α β γ σ
h<80 5.56 0.001 0.063 31.9 yellow h>80 3.00 0.087 0.018 30.9 h<271-0.8J 8.01 0.034 -0.02 58.8 blue h>273-0.8J 7.90 0.025 0.025 37.1
5. References
1. A colour appearance model for color management systems: CIECAM02, CIE Publication, 159:2004 2. J.C. Shin, H. Yaguchi and S. Shioiri, Change of
Color Appearance in Photopic, Mesopic and Scotopic Vision, OPTICAL REVIEW, 11, No.4, 265-271 (2004).
3. J.C. Shin, N. Matsuki, H. Yaguchi and S. Shioiri, A Color Appearance Model Applicable in Mesopic Vision, OPTICAL REVIEW, 11, No.4, 272-278 (2004).
4. H. Yaguchi, R. Miyoshi and S. Shioiri, Individual variations in color matches between color on a self-luminous display and illuminated color chips, Proceedings of the 23rd Session of the CIE, New Delhi, Vol. 1, 49-50 (1995).
5. P.W. Trezona, Individual observer data for the 1955 Stiles-Burch 2° pilot investigation, J. Opt. Soc. Am. A, 4, 769-782 (1987).
6. H. Yaguchi, Signal transformations from the cone stage to the neural coding stage, die Farbe, 34, 67-74 (1987).
7. D. Jameson and L.M. Hurvich, Some quantitative aspects of an opponent-colors theory. I.
Chromatic responses and spectral saturation, J. Opt. Soc. Am., 45, 546-552 (1955).
8. H. Yaguchi, D. Morino, S. Ohyama, T. Nagase, Y. Mizokami, T. Moriyama, Relation between elementary color scaling and the perceptive attributes specified with CIECAM02, Proceedings of CIE 26th Session Beijing, Vol.1, D1-6-D1-9 (2007).