P1-52 / J. H. Lee
IMID 2009 DIGEST •
Abstract
The ray-tracing technique was used to optimize the light guide plate for the purpose of improving the on-axis luminance on the edge-lit backlights. One-dimensional prisms and engraved V-shaped patterns were applied to the upper and the lower surfaces of the light guide plate, respectively. By optimizing the apex angles of these micro-structures, as well as the shape of the reverse-prism film put over the light guide plate, highly-collimated light-output distribution could be obtained on the backlight, which may contribute to the development of mobile LCD’s with low power consumption.
1. Introduction
Recently, technologies for slim display have attracted great attention. The thickness of LCD TV has been reduced to that of a human finger making the ultra-slim display being realized. Edge-lit backlights adopting white light emitting diodes (LEDs) as light sources are mainly used for slim LCD TV. Slim backlights are also important for reducing the thickness of small-size LCD’s for mobile applications. Various designs of light guide plate (LGP) have been proposed to reduce the number of optical films and to increase the on-axis optical gain [1-6]. Micro-structures with different shapes were formed on both upper and lower surfaces of LGP for incorporating diffusing and collimating functions of additional optical films which were put over the LGP. In the present study, V-shaped and prism structures were adopted on the lower and the upper surfaces of LGP, respectively, which was combined by the reverse-prism film. A detailed correlation between the micro-structures and the light-output characteristics was revealed from ray-tracing study on the suggested hybrid LGP.
2. Experimental
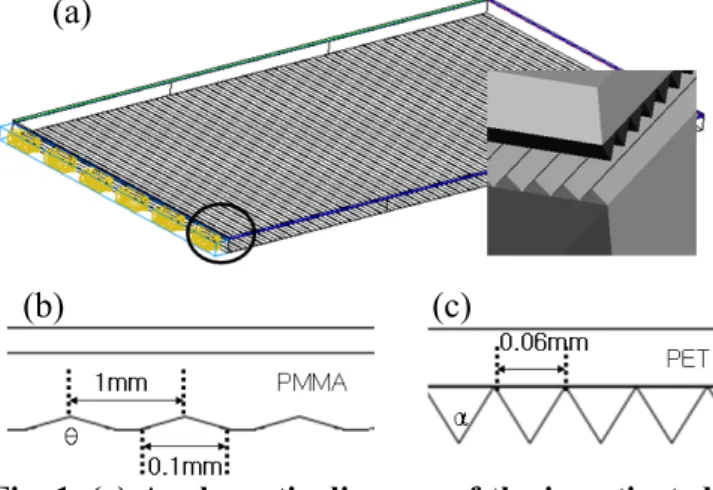
Figure 1 (a) shows the schematic diagram of the investigated edge-lit backlight in this study. It consists of 6 white LEDs, a reflection film, a LGP, and a reverse-prism film. A lamp cover having a rectangular shape surrounded the white LEDs for reducing the light loss. Six LEDs were attached on one side of the LGP. The other three sides of LGP were mirror-coated. The LED used in this study was the side-emitting type (NSCW215T, Nichia Co), but the emitting wavelength was fixed to 550 nm.
Fig. 1. (a) A schematic diagram of the investigated edge-lit backlight in this study; (b) the cross-sectional view of the LGP; (c) the cross-cross-sectional view of the reverse-prism film.
The LGP has dimensions of 48×27×1.1 mm3. Its
refractive index was set to1.49, the same to that of PMMA(Poly(methyl methacrylate)), the most typical material used to fabricate LGP. Typical one-dimensional prisms with an apex angle of 90O and a
pitch of 60 µm were applied to the upper surface of LGP, which were parallel to the shorter side of LGP. This direction will called “S-direction.” On the other hand, engraved V-shaped patterns were formed on the
Simulation Study on the Optimization of Hybrid Light
Guide Plates for Edge-lit Backlight Applications
Jeong Ho Lee
1, Kie-Bong Nahm
1, Jae-Hyeon Ko
1*, Joong Hyun Kim
21Dept. of Physics, Hallym University, Chuncheon City, Gangwondo, Korea
TEL:82-33-248-2056, e-mail: [email protected]
2AMLCD Division, Samsung Electronics Co. Ltd., Asan, Chungnam, Korea
Keywords : Backlight, Light Guide Plate, Simulation, Edge-lit, Hybrid LGP
(a)
P1-52 / J. H. Lee
• IMID 2009 DIGEST
lower surface of the LGP. Figure 1 (b) displays the cross-sectional view of the V-shaped pattern formed on the bottom surface of LGP. The width and the pitch of these V-grooves were 100 µm and 1000 µm, respectively, while the height was dependent on the apex angle Θ. These V-grooves were parallel to the longer side of LGP. This direction will be called “L-direction.” The cross-section of the reverse-prism film is shown in Fig.1 (c). It consists of a flat substrate with a refractive index of 1.575 onto which one-dimensional prisms with a pitch of 60 µm, a refractive index of 1.5, and various apex angles (α) were formed downwards. The direction of these reverse-prism grooves was the same to that of V-patterned grooves.
3. Results and discussion
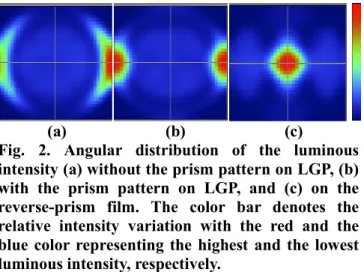
The collimating power of the reverse-prism is directly correlated with the light-output distribution on LGP. Figure 2 (a) shows one example of the angular distribution of the luminous intensity on the LGP without prism patterns on it. In this example, the apex angle Θ of the engraved V-shaped patterns was 174o.
The output rays are mainly inclined to very high angles with respect to the normal direction of LGP and are widened along the S-direction. Figure 2 (b) displays the same plot of the V-patterned LGP with one-dimensional prisms on the upper surface of LGP with an apex angle of 90o. The light-output
distribution became narrower along the direction perpendicular to the prism grooves due to the collimating function of the upper prisms. The apex angle α of the reverse-prism should be determined to match with the inclination angle of the output light from LGP for achieving high on-axis luminance.
(a) (b) (c)
Fig. 2. Angular distribution of the luminous intensity (a) without the prism pattern on LGP, (b) with the prism pattern on LGP, and (c) on the reverse-prism film. The color bar denotes the relative intensity variation with the red and the blue color representing the highest and the lowest luminous intensity, respectively.
Figure 2 (c) shows the angular distribution of the
luminous intensity on the reverse-prism film. As a result of the total internal reflection (TIR) at the prism surfaces of the reverse-prism film, the output rays are highly collimated toward the normal direction. The angular half-width is about ±16o along both
directions.
The apex angle α of the reverse-prism film should be optimized according to the distribution obtained on the LGP. As a first step, the light-output distribution on the LGP was examined as a function of Θ, which was changed from 150O to 175O. Figures 3 (a) and (b) exhibit the normalized angular distribution of the relative luminous intensity along the L-direction and S-direction, respectively. The normalized intensity is the recalculated one based on the assumption that there is no optical loss in the system and all rays emitted from LEDs are detected at the detector. The intensity distribution peaks at two symmetric angles measured along the L-direction (Fig.3 (a)), which is attributed to the breakdown of the condition of TIR due to the V-patterned grooves. The peak angle depends on Θ and shifts to higher angle with Θ. On the other hand, the angular distribution along the S-direction is not sensitive to Θ except for Θ =175O as
can be seen from Fig.3 (b). The intensity distribution peaks at 0O due to the collimation function of the
prism structure formed on the upper surface of LGP. TABLE 1. The fraction of the luminous flux detected on the LGP and the backlight.
The detected fraction(%)
Θ on LGP on backlight 150° 56.8 51.0 155° 50.2 44.6 160° 41.6 36.4 165° 31.5 26.4 170° 20.4 15.2 175° 11.1 4.6
Table 1 shows the fraction of the luminous flux (or the fraction of rays) detected on the LGP and the backlight with respect to the total rays emitted from 6 LEDs. It is noticed that the fraction of trapped rays in the LGP increases with Θ. This result is natural since the LGP with higher Θ is approaching the LGP without any pattern from which the rays cannot escape due to TIR.
The uniformity characteristic is a very important property from the view point of backlight performances. In order to evaluate the illuminance uniformity, a detector was put over the LGP, 9-point
P1-52 / J. H. Lee
IMID 2009 DIGEST • average illuminance was examined, and the
illuminance uniformity was calculated according to
Lmin/Lmax where Lmin and Lmax are the minimum and
maximum illuminances among the 9 values. The estimated illuminance uniformity was found to be more than 80 % for all 6 cases shown in Fig.3.
-100 -80 -60 -40 -20 0 20 40 60 80 100 0 10 20 30 40 50 60 70 80 90 Intensity (arb. u nit) Viewing Angle(O) 150o 155o 160o 165o 170o 175o (a) -100 -80 -60 -40 -20 0 20 40 60 80 100 0 10 20 30 40 50 60 70 80 90 In te nsi ty(a rb. uni t) Viewing Angle(O) 150o 155o 160o 165o 170o 175o (b)
Fig. 3. The angular distribution of the relative luminous intensity along the (a) L-direction and (b) S-direction at various values of Θ.
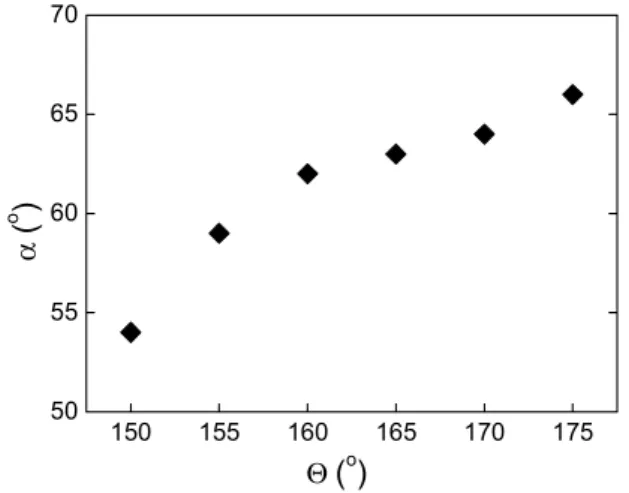
The main function of the reverse-prism film is to turn the direction of incident rays from LGP toward the normal direction. The major part of the incident rays into the reverse prisms experience TIR at the inclined prism surfaces and are redirect to the normal direction. The optimum apex angle α of the reverse-prism film was found based on the light-output distribution on LGP. The number of rays confined within ±5O with respect to the normal on the
reverse-prism film was maximized by tuning α. Figure 4 shows the optimized α as a function of Θ. The optimum α ranges from 53 ~ 66O depending on Θ, and
α increases and then seems to saturate as Θ increases.
150 155 160 165 170 175 50 55 60 65 70 α ( o ) Θ (o)
Fig. 4. The optimized apex angle α of the reverse-prism film as a function of Θ of the V-patterned grooves formed on the bottom surface of LGP.
As a next step, the distribution of the luminous intensity on the reverse-prism film was obtained at several optimized combinations of Θ and α. Figure 5 displays the distribution of the luminous intensity at three conditions before the normalization procedure. It is easily seen that the rays are more collimated as Θ increases along both S- and L-directions. From this figure, the angular distribution of the luminance can be obtained.
(a) (b) (c)
Fig. 5. The angular distribution of the luminous intensity on the backlight for three cases; (a) Θ=150°(b) Θ=160° (c) Θ=170°
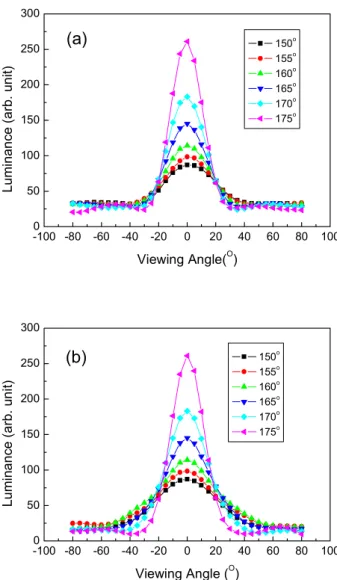
Figures 6 (a) and (b) show the luminance as a function of the viewing angle along the L-direction and S-direction, respectively. If we assume that there is no light loss including the trapped light in LGP, the on-axis is expected to increase with Θ. The relative on-axis luminance and the FWHM are shown in Table 2. As the on-axis luminance increases, the FWHM decreases according to the conservation of rays, i.e.,
45 32 49
P1-52 / J. H. Lee
• IMID 2009 DIGEST the conservation of the energy.
-100 -80 -60 -40 -20 0 20 40 60 80 100 0 50 100 150 200 250 300 Lu m in anc e ( a rb . un it) Viewing Angle(O) 150o 155o 160o 165o 170o 175o (a) -100 -80 -60 -40 -20 0 20 40 60 80 100 0 50 100 150 200 250 300 Lu m in anc e ( a rb . un it) Viewing Angle (O) 150o 155o 160o 165o 170o 175o (b)
Fig. 6. The angular distribution of the relative luminance along the (a) L-direction and (b) S-direction at various values of Θ.
TABLE 2. The relative on-axis luminance and the full-width at half-maximum (FWHM) on the reverse-prism film along both directions at various Θ.
FWHM (O)
Θ (O) On-axis
Luminance L-direction S-direction 150 87 54 56 155 98 50 55 160 114 43 54 165 145 37 42 170 182 33 35 175 261 28 27
However, the above results do not justify that the LGP with high Θ is more preferable for obtaining high-performance backlights because the amount of trapped rays in the LGP will increase as Θ approaches 180O.
Therefore, the apex angle Θ should be determined based on the compromise between the collimating power that will be enhanced at high Θ and the system efficiency (i.e., low light loss in LGP) that will increase at low Θ.
4. Summary
The ray-tracing technique was used to optimize the light guide plate for the purpose of improving on-axis luminance on the edge-lit backlights. One-dimensional prisms and engraved V-shaped patterns were applied to the upper and the lower surfaces of the light guide plate, respectively. The apex angles of these micro-structures, as well as the shape of the reverse-prism film put over the light guide plate, were optimized based on the correlation between the light-output distribution on the LGP and the direction-turning function of the reverse-prism film. According to this optimization procedure, highly-collimated luminance distribution on the backlight could be obtained, which may contribute to the development of mobile LCD’s with high directionality.
5. Acknowledgements
This work was supported by the New University for Regional Innovation (NURI) project of Korea Ministry of Education and Human Resources Development (fifth-year project in 2008~2009).
6. References
1. K. Käläntär, S. Matsumoto, and T. Onishi, IEICE.
Trans. Electron., E84-C[11], 1637 (2001).
2. D. Feng, G. Jin, Y. Yan, and S. Fan, Appl. Phys.
Lett., 85, 6016 (2004).
3. T. Ishikawa and X. –D. Mi, SID’06 Technical
Digest, p.514 (2006).
4. S. R. Park, O .J. Kwon, S. –H. Song, H. S. Lee and H. Y. Choi, IDW’06 Technical Digest, p.1025 (2006).
5. G. Kurata, K. Sakurai, M. Ohira, Y. Kawabata, A. Funamoto and S. Aoyama, IDW’06 Technical
Digest, p.1727 (2006).
6. K. Fusisawa, I. Onishi and Y. Fujiwara, Jpn. J. Appl.