Effect of Individual and District-level Socioeconomic Disparities
on Cognitive Decline in Community-dwelling Elderly in Seoul
This study was to investigate the effects of individual and district-level socioeconomic status (SES) on the development of cognitive impairment among the elderly. A 3-year retrospective observational analysis (2010–2013) was conducted which included 136,217 community-dwelling healthy elderly who participated in the Seoul Dementia Management Project. Cognitive impairment was defined as 1.5 standard deviations below the norms on the Mini-mental status examination. In the individual lower SES group, the cumulative incidence rate (CIR) of cognitive impairment was 8.7% (95% confidence interval [CI], 8.64–8.70), whereas the CIR in the individual higher SES group was 4.1% (95% CI, 4.08– 4.10). The CIR for lower district-level SES was 4.7% (95% CI, 4.52–4.86), while that in the higher district-level SES was 4.3% (95% CI, 4.06–4.44). There were no additive or synergistic effects between individual and district-level SES. From this study, the individual SES contributed 1.9 times greater to the development of cognitive impairment than the district-level SES, which suggests that individual SES disparities could be considered as one of the important factors in public health related to cognitive impairment in the elderly. Keywords: Individual SES; District-level SES; Cognitive Impairment
Geon Ha Kim,1,2,3 Hye Ah Lee,4 Hyesook Park,4 Dong Young Lee,5,6 Inho Jo,7 Seong Hye Choi,8 Kyoung-Gyu Choi,1,9,10 and Jee Hyang Jeong1,2
1Department of Neurology, Ewha Womans
University Mokdong Hospital, Ewha Womans University College of Medicine, Seoul, Korea;
2Gangseo Dementia Center, Seoul, Korea; 3Ewha
Brain Institute, Ewha Womans University, Seoul, Korea; 4Department of Preventive Medicine, Ewha
Womans University College of Medicine, Seoul, Korea; 5Department of Psychiatry, Seoul National
University Hospital, Seoul, Korea; 6Seoul
Metropolitan Center for Dementia, Seoul, Korea;
7Department of Molecular Medicine, Ewha Womans
University School of Medicine, Seoul, Korea;
8Department of Neurology, Inha University School
of Medicine, Incheon, Korea; 9Yangcheon Dementia
Center, Seoul, Korea; 10Healthcare Review and
Assessment Committee, Health Insurance Review and Assessment Service, Wonju, Korea
Received: 13 April 2017 Accepted: 17 June 2017 Address for Correspondence: Jee Hyang Jeong, MD, PhD
Department of Neurology, Ewha Womans University Mokdong Hospital, Ewha Womans University School of Medicine, 1071 Anyangcheon-ro, Yangcheon-gu, Seoul 07985, Korea E-mail: [email protected]
Funding: This study was supported by intramural research promotion grants from Ewha Womans University School of Medicine, by the Research Program To Solve Social Issues of the National Research Foundation of Korea (NRF) funded by the Ministry of Science, ICT & Future Planning (No. 2015M3C8A8076481), by the Original Technology Research Program for Brain Science through the NRF funded by the Korean Minister of Science, ICT and Future Planning (MSIP) (No. 2014M3C7A1064752), and by the NRF funded by the MSIP for convergent research in Development program for convergence R & D over Science and Technology Liberal Arts (No. 2016M3C1B6929465).
https://doi.org/10.3346/jkms.2017.32.9.1508 • J Korean Med Sci 2017; 32: 1508-1515
INTRODUCTION
Socioeconomic status (SES) is one of the most frequently studied determinants in the context of public health care for the elderly. Many previous studies show that lower SES is an independent risk factor for the development of dementia or cognitive impairment in the elderly (1-5), although several previous studies have suggested that higher prev-alence of cardiovascular risk factors and poor behavioral habits among people with low-er SES may contribute to increased risks of developing cognitive impairment (4-7). Apart from individual SES and related factors, however, it is not well established whe-ther district-level SES disparities may interplay with individual SES on the incidence of cognitive impairment in the elderly. Most previous studies have concentrated the ef-fects of either individual or district-level SES itself (1,4,5,8-10). The district-level SES could represent basic environmental infrastructures including readily accessible local health services or green space and sports facilities for active and healthy aging, while the individual SES could represent as effect modifiers or mediating factors for individ-ual cognitive frailty (11). Considering this different aspect between individindivid-ual and dis-trict-level SES, it is important to consider both individual and disdis-trict-level SES espe-cially for the public health related to mental health for the elderly. Although some of the previous studies have considered both individual and district-level SES (3,11,12), most of those studies were cross-sectional, which might have limited interpretation re-garding a causal relationship between SES and cognitive impairment. The purposes of this study, therefore, are to investigate the longitudinal effects of socioeconomic dis-parities between individual and district-level SES on the development of cognitive im-pairment among the elderly in Seoul. We hypothesized that there could be synergistic or addictive effects of individual and district-level SES on the development of cognitive impairment in the elderly.
Neuroscience
2017-03-16 https://crossmark-cdn.crossref.org/widget/v2.0/logos/CROSSMARK_Color_square.svg
MATERIALS AND METHODS
Study design
This is a retrospective longitudinal analysis using the database from the Seoul Dementia Management Project (SDMP).
Study population
The data were gathered from the data source of SDMP, which includes standardized clinical data with comprehensive screen-ing services for dementia among the elderly population in Seoul. This project has been conducted by the Seoul Metropolitan Cen-ter for Dementia (SMCD). Details about the SDMP can be found online at https://www.seouldementia.or.kr.
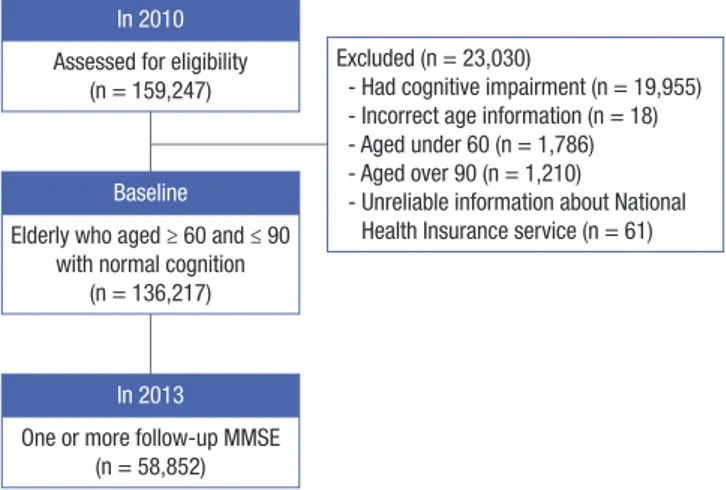
For this research, we retrospectively analyzed data from Jan-uary of 2010 to December of 2013. Among a total of 159,247 reg-istrants for the SDMP in 2010, we excluded 19,955 participants (12.5%) who demonstrated cognitive impairment in 2010. Among 139,292 participants, we further excluded 18 participants who provided incorrect information about their ages, as well as 2,996 participants who were under 60 years (n = 1,786) or over 90 years (n = 1,210) of age. We further excluded 61 participants without information or with unreliable information about their National Health Insurance (NHI) services, including people who receiv-ed benefits as persons of national merit. Accordingly, the final number of participants was 136,217. Among these, a total of 58,852 participants underwent one or more follow-up tests dur-ing the period of study (Fig. 1).
Individual SES
All participants were subdivided into 2 groups: lower vs. higher SES, based on the services provided to participants by the NHI system in Korea (13,14). In other words, individuals were placed in a lower SES if they received medical aid (MA) services, while a higher SES was defined by those who received NHI services. Eligibility for MA services is annually evaluated by the Korean
government to determine a status of poverty, which is defined as a lower household income than the minimum cost of living estimated by the government (15). As of 2010, the average mini-mum cost of living for a family of 4 was around $1,350 per month (15). Among 136,217 participants, 13,768 (10.1%) received as-sistance from the MA program in 2010, which placed them in the lower individual SES group.
District-level SES
All participants were also classified into 2 groups based on their district-level SES, lower vs. higher district-level SES. District-lev-el SES was based on the tax income of each district per year in Seoul. Therefore, individuals were placed in a lower district-lev-el SES if they lived in a district where the average tax income of a district was equal to or below the 50th percentile among 25 districts in Seoul, whereas higher district-level SES was defined if they lived in a district where the average tax income of a dis-trict was above the 50th percentile. The mean tax income of 25 districts in 2010 was $36,371,525 according to the data published by the Statistics Korea (http://kostat.go.kr/portal/korea), a cen-tral organization for statistics under Ministry of Strategy and Fi-nance in Korea.
Cognitive function
Cognitive impairment was diagnosed if participants scored be-low a 1.5 standard deviation (SD) on the mini-mental status ex-amination (MMSE) compared to age-matched and education-matched norms (16,17).
Assessment of risk factors for cognitive impairment
All baseline information related to participants was collected using a structured self-reported questionnaire. We assessed de-mographic characteristics, as well as family history of dementia, cardiovascular risk factors, health-related characteristics, and social relationships. Among the demographics, the years of ed-ucation were further divided into 3 categories, including uned-ucated, lower (≤ 9 years of education), and higher (≥ 10 years of education). Cardiovascular risk factors consisted of the pres-ence of hypertension, diabetes, hyperlipidemia, cardiac disease, and stroke, which were defined as existing or none. Health-re-lated characteristics included physical exercise, smoking, and alcohol consumption. In terms of exercise, participants were asked whether they currently exercise regularly or not. With re-gards to smoking and alcohol consumption, participants were classified into 3 subgroups, including never, past, and current. Participants were also asked whether they held a previous or cur-rent occupation. The measures of social relationships comprised the marital status and living situations of participants. Marital status was defined by the following indicators: married, widowed or divorced, or never married. The living situations of participants were defined as living with family caregivers or living alone.
Fig. 1. Flow of selecting participants. MMSE = mini-mental status examination.
In 2010 Assessed for eligibility
(n = 159,247)
Baseline
Elderly who aged ≥ 60 and ≤ 90 with normal cognition
(n = 136,217)
In 2013
One or more follow-up MMSE (n = 58,852)
Excluded (n = 23,030)
- Had cognitive impairment (n = 19,955) - Incorrect age information (n = 18) - Aged under 60 (n = 1,786) - Aged over 90 (n = 1,210)
- Unreliable information about National Health Insurance service (n = 61)
Statistical analysis
Statistical analyses were performed using the Statistical Pack-age for the Social Sciences ver. 18.0 (SPSS Inc., Chicago, IL, USA). Statistical significance was defined as P < 0.05.
Baseline characteristics were compared using Student’s t-tests for continuous variables and χ2 tests for dichotomous variables.
Logistic regression was used to analyze the prevalence of risk factors according to SES after adjusting age and gender.
The Kaplan-Meier method was used to estimate the cumula-tive incidence rate (CIR). Differences in incidence of cognicumula-tive impairment according to individual or district-level SES were analyzed with the log-rank test. The Cox proportional hazard model was used to explore the significant risk factors for inci-dence of cognitive impairment, and to calculate the hazard ra-tio (HR) for the development of cognitive impairment accord-ing to individual or district-level SES. The significant risk factors for the development of cognitive impairment were examined
using univariate and multivariate Cox-proportional analyses. We also constructed 5 models, in which explanatory variables were added in covariate blocks, to evaluate the associations be-tween the individual or district-level SES and incidence of cog-nitive impairment.
The interactive association between individual and district-level SES was evaluated using the following stratifications. The study population was divided into 4 strata characterized by 1) having individual lower SES and district-level lower SES (ILDL); 2) having individual lower SES and district-level higher SES (ILDH); 3) having individual higher SES and district-level lower SES (IHDL); and 4) having individual higher SES and district-level higher SES (IHDH).
Ethics statement
All participation was voluntary for the SDMP, and written in-formed consent was obtained from all of the participants in the
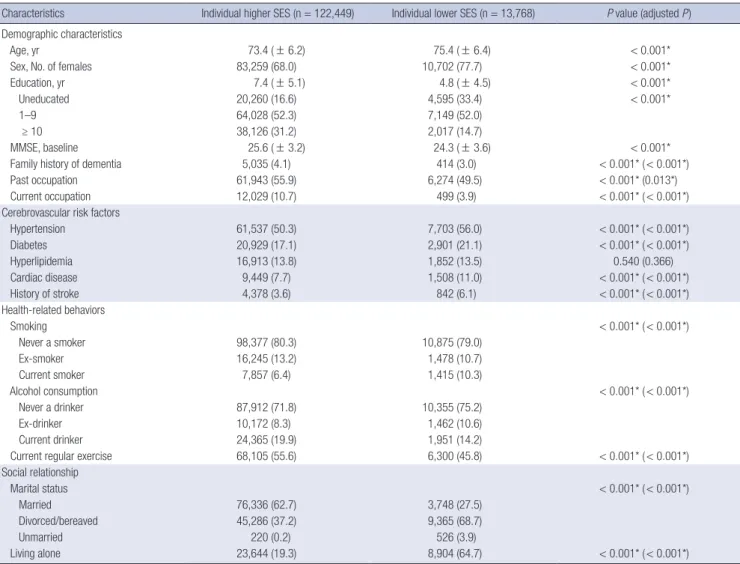
Table 1. Baseline characteristics according to the individual SES
Characteristics Individual higher SES (n = 122,449) Individual lower SES (n = 13,768) P value (adjusted P)
Demographic characteristics
Age, yr 73.4 ( ± 6.2) 75.4 ( ± 6.4) < 0.001*
Sex, No. of females 83,259 (68.0) 10,702 (77.7) < 0.001*
Education, yr 7.4 ( ± 5.1) 4.8 ( ± 4.5) < 0.001*
Uneducated 20,260 (16.6) 4,595 (33.4) < 0.001*
1–9 64,028 (52.3) 7,149 (52.0)
≥ 10 38,126 (31.2) 2,017 (14.7)
MMSE, baseline 25.6 ( ± 3.2) 24.3 ( ± 3.6) < 0.001*
Family history of dementia 5,035 (4.1) 414 (3.0) < 0.001* ( < 0.001*)
Past occupation 61,943 (55.9) 6,274 (49.5) < 0.001* (0.013*)
Current occupation 12,029 (10.7) 499 (3.9) < 0.001* ( < 0.001*)
Cerebrovascular risk factors
Hypertension 61,537 (50.3) 7,703 (56.0) < 0.001* ( < 0.001*) Diabetes 20,929 (17.1) 2,901 (21.1) < 0.001* ( < 0.001*) Hyperlipidemia 16,913 (13.8) 1,852 (13.5) 0.540 (0.366) Cardiac disease 9,449 (7.7) 1,508 (11.0) < 0.001* ( < 0.001*) History of stroke 4,378 (3.6) 842 (6.1) < 0.001* ( < 0.001*) Health-related behaviors Smoking < 0.001* ( < 0.001*) Never a smoker 98,377 (80.3) 10,875 (79.0) Ex-smoker 16,245 (13.2) 1,478 (10.7) Current smoker 7,857 (6.4) 1,415 (10.3) Alcohol consumption < 0.001* ( < 0.001*) Never a drinker 87,912 (71.8) 10,355 (75.2) Ex-drinker 10,172 (8.3) 1,462 (10.6) Current drinker 24,365 (19.9) 1,951 (14.2)
Current regular exercise 68,105 (55.6) 6,300 (45.8) < 0.001* ( < 0.001*) Social relationship Marital status < 0.001* ( < 0.001*) Married 76,336 (62.7) 3,748 (27.5) Divorced/bereaved 45,286 (37.2) 9,365 (68.7) Unmarried 220 (0.2) 526 (3.9) Living alone 23,644 (19.3) 8,904 (64.7) < 0.001* ( < 0.001*)
Values are presented as number (%).
SES = socioeconomic status, MMSE = mini-mental status examination. *P < 0.05; adjusted P value was analyzed after adjusting age and gender.
current study. The study protocol was approved by the Institu-tional Review Board of Ewha Womans University Mokdong Hos-pital (EUMC 2014-10-031-004).
RESULTS
Baseline characteristics of participants
Table 1 demonstrates the baseline characteristics of participants based on the individual SES. People in the lower individual SES group were older and less educated. The baseline MMSE per-formance was worse among participants in the lower individu-al SES group (24.3 ± 3.6) than in the higher SES group (25.6 ± 3.2). The lower individual SES group had a higher percentage of hy-pertension, diabetes, cardiac disease, and history of stroke, as well as a higher percentage of current smokers. Also, peoples in the lower individual SES group were less likely to exercise or to
drink alcohol. In terms of social relationships, the lower indi-vidual SES group demonstrated much higher proportions of persons living alone (64.7% vs. 19.3%, P < 0.001), and those in divorced or bereaved states (68.7% vs. 37.2%, P < 0.001) relative to the higher individual SES group.
Table 2 shows the baseline characteristics according to the district-level SES. There were different percentages of MA group between higher and lower district-level SES, which shows that the higher district-level SES group had a higher percentage of the MA group (10.4% vs. 9.9%, P for group, 0.008). Regarding living state, the higher district-level SES group shows a greater percentage of persons who live alone than the lower district-level SES group, which are opposite results from the individual SES.
Table 2. Baseline characteristics according to the district-level SES
Characteristics District-level higher SES (n = 59,042) District-level lower SES (n = 77,175) P value
Age, yr 73.7 ( ± 6.3) 73.6 ( ± 6.2) 0.174 Sex, No. of female 40,676 (68.9) 53,285 (69.0) 0.551
MA 6,115 (10.4) 7,653 (9.9) 0.008* Education, yr 7.1 ( ± 5.2) 7.1 ( ± 5.0) 0.008* Uneducated 10,563 (17.9) 14,292 (18.5) 0.009* 1–9 30,937 (52.4) 40,240 (52.2) ≥ 10 17,529 (29.7) 22,614 (29.3) MMSE, baseline 25.5 ( ± 3.3) 25.5 ( ± 3.2) 0.025* Family history of dementia 2,479 (4.1) 3,020 (3.9) 0.061 Past occupation 32,454 (58.9) 35,763 (52.3) < 0.001* Current occupation 6,015 (10.8) 6,513 (9.3) < 0.001* Comorbidity Hypertension 29,707 (50.3) 39,533 (51.2) 0.001* Diabetes 10,276 (17.4) 13,554 (17.6) 0.450 Hyperlipidemia 8,472 (14.3) 10,293 (13.3) < 0.001* Cardiac disease 4,943 (8.4) 6,014 (7.8) < 0.001* History of stroke 2,384 (4.0) 2,836 (3.7) 0.001* Health-related behaviors Smoking < 0.001* Never a smoker 46,691 (79.1) 62,561 (81.1) Ex-smoker 8,113 (13.7) 9,580 (12.4) Current smoker 4,238 (7.2) 5,034 (6.5) Alcohol < 0.001* Never a drinker 42,348 (71.7) 55,919 (72.5) Ex-drinker 5,476 (9.3) 6,158 (8.0) Current drinker 11,218 (19.0) 15,098 (19.6)
Current regular exercise 32,427 (54.9) 41,987 (54.4) 0.053 Familial supporting Marriage status < 0.001* Married 32,453 (55.0) 47,631 (62.3) Divorced/bereaved 26,129 (44.3) 28,522 (37.3) Unmarried 388 (0.7) 358 (0.5) Living alone 14,831 (25.1) 17,717 (23.0) < 0.001* Values are presented as number (%).
SES = socioeconomic status, MA = medical aid, MMSE = mini-mental status exami-nation.
*P < 0.05.
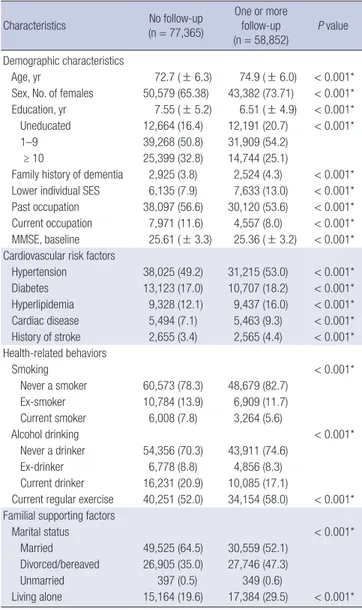
Table 3. Baseline characteristics between participants who underwent follow-up and those who did not
Characteristics (n = 77,365)No follow-up One or more follow-up (n = 58,852) P value Demographic characteristics Age, yr 72.7 ( ± 6.3) 74.9 ( ± 6.0) < 0.001* Sex, No. of females 50,579 (65.38) 43,382 (73.71) < 0.001* Education, yr 7.55 ( ± 5.2) 6.51 ( ± 4.9) < 0.001* Uneducated 12,664 (16.4) 12,191 (20.7) < 0.001* 1–9 39,268 (50.8) 31,909 (54.2)
≥ 10 25,399 (32.8) 14,744 (25.1)
Family history of dementia 2,925 (3.8) 2,524 (4.3) < 0.001* Lower individual SES 6,135 (7.9) 7,633 (13.0) < 0.001* Past occupation 38,097 (56.6) 30,120 (53.6) < 0.001* Current occupation 7,971 (11.6) 4,557 (8.0) < 0.001* MMSE, baseline 25.61 ( ± 3.3) 25.36 ( ± 3.2) < 0.001* Cardiovascular risk factors
Hypertension 38,025 (49.2) 31,215 (53.0) < 0.001* Diabetes 13,123 (17.0) 10,707 (18.2) < 0.001* Hyperlipidemia 9,328 (12.1) 9,437 (16.0) < 0.001* Cardiac disease 5,494 (7.1) 5,463 (9.3) < 0.001* History of stroke 2,655 (3.4) 2,565 (4.4) < 0.001* Health-related behaviors Smoking < 0.001* Never a smoker 60,573 (78.3) 48,679 (82.7) Ex-smoker 10,784 (13.9) 6,909 (11.7) Current smoker 6,008 (7.8) 3,264 (5.6) Alcohol drinking < 0.001* Never a drinker 54,356 (70.3) 43,911 (74.6) Ex-drinker 6,778 (8.8) 4,856 (8.3) Current drinker 16,231 (20.9) 10,085 (17.1)
Current regular exercise 40,251 (52.0) 34,154 (58.0) < 0.001* Familial supporting factors
Marital status < 0.001*
Married 49,525 (64.5) 30,559 (52.1) Divorced/bereaved 26,905 (35.0) 27,746 (47.3) Unmarried 397 (0.5) 349 (0.6)
Living alone 15,164 (19.6) 17,384 (29.5) < 0.001* Values are presented as number (%).
SES = socioeconomic status, MMSE = mini-mental status examination. *P < 0.05.
Table 3 shows a comparison of baseline demographic char-acteristics between the 58,852 participants who underwent fol-low-up testing and those who did not (n = 77,365). The partici-pants who underwent follow-up were older and less educated compared to those who did not. In addition, those who under-went follow-up had a greater percentage of lower individual SES.
Cumulative incidence of cognitive impairment
During 3 years of follow-up, 4,653 participants developed cog-nitive impairment. In the lower individual SES group, the CIR of cognitive impairment was 8.7% (95% confidence interval [CI], 8.64–8.70), whereas the CIR of cognitive impairment in the
high-er individual SES group was 4.1% (95% CI, 4.08–4.10) (with a relative risk [RR] of individual SES: 2.1, P for group < 0.001) (Fig. 2A). In terms of district-level SES, the CIR of cognitive impair-ment in the lower district-level SES was 4.7% (95% CI, 4.52–4.86), while that in the higher district-level SES was 4.3% (95% CI, 4.06– 4.44) (with a RR of district-level SES: 1.1, P for group, 0.026) (Fig. 2B).
Interactive effects of individual and district-level SES
Table 4 shows the CIR of cognitive impairment according to the 4 stratified groups. The CIR of ILDL was 9.1% (95% CI, 8.33–9.88), significantly higher than the 3.9% (95% CI, 3.67–4.05) observed
Fig. 2. CIR for cognitive impairment according to SES. (A) Individual SES. The individual lower SES group shows a higher CIR for cognitive impairment over 3 years (8.7%, 95% CI, 8.64–8.70) compared to the CIR for cognitive impairment of the higher SES group (4.1%, 95% CI, 4.08–4.10) (P for group < 0.001). The RR for cognitive impairment of the individual lower SES group is 2.1. (B) District-level SES. The CIR of cognitive impairment in the level lower SES was 4.7% (95% CI, 4.52–4.86), while that in the district-level higher SES was 4.3% (95% CI, 4.06–4.44). The RR for cognitive impairment of the district-district-level lower SES group is 1.1.
CIR = cumulative incidence rate, SES = socioeconomic status, CI = confidence interval, RR = relative risk.
Cumula tive incidence ra te Time (month) 0 12 24 36 48 0.10 0.08 0.06 0.04 0.02 0 Individual SES Individual higher SES Individual lower SES Individual higher SES-censored Individual lower SES-censored
Cumula tive incidence ra te Time (month) 0 12 24 36 48 0.10 0.08 0.06 0.04 0.02 0 District-level SES District-level higher SES District-level lower SES District-level higher SES-censored District-level lower SES-censored
A B
Table 4. CIR according to 4 groups stratified by individual and district-level SES
Groups SES CIR, % 95% CI RR P value for group or pairwise P value
Individual District-level
Individual SES Lower 8.7 8.64–8.70 1.9 < 0.001*
Higher (reference) 4.1 4.08–4.10
District-level SES Lower 4.7 4.52–4.86 1.1 0.026*
Higher (reference) 4.3 4.06–4.44
Stratified
1 (ILDL) Lower Lower 9.1 8.33–9.88 2.4 1 vs. 2 1 vs. 3 1 vs. 4
0.131 < 0.001* < 0.001*
2 (ILDH) Lower Higher 8.1 7.24–8.90 2.1 2 vs. 3 2 vs. 4
< 0.001* < 0.001*
3 (IHDL) Higher Lower 4.2 4.07–4.42 1.1 3 vs. 4
0.065 4 (IHDH, reference) Higher Higher 3.9 3.67–4.05
CIR = cumulative incidence rate, SES = socioeconomic status, CI = confidence interval, RR = relative risk, ILDL = having individual lower SES and district-level lower SES, ILDH = having individual lower SES and district-level higher SES, IHDL = having individual higher SES and district-level lower SES, IHDH = having individual higher SES and district-level higher SES.
in those participants with IHDH (RR, 2.4, P for group < 0.001). However, there was no additive or synergistic interaction be-tween individual and district-level SES on the CIR of cognitive impairment.
Adjustment of various risk factors
The individual lower SES (HR, 1.6; 95% CI, 1.49–1.77), lower ed-ucation (HR, 1.6; 95% CI, 1.40–1.72), and history of stroke (HR, 1.7; 95% CI, 1.49–1.89) are the top 3-ranked independent risk factors for the cognitive impairment.
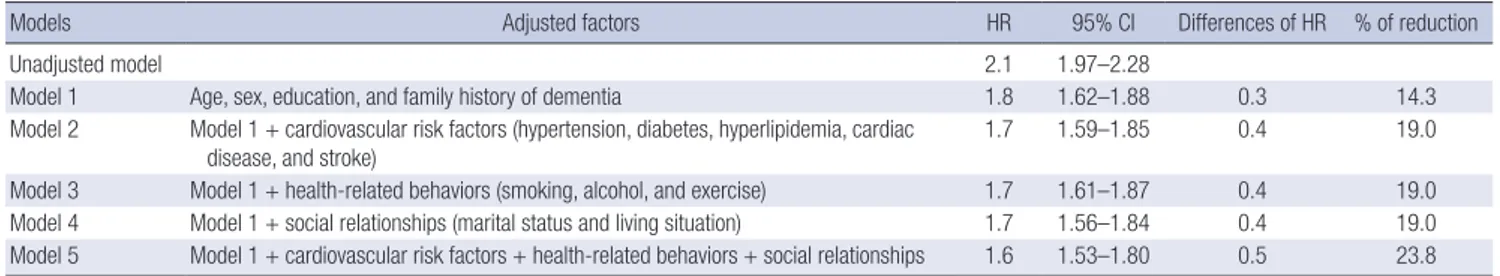
For the individual SES, Table 5 showed different HR accord-ing to the 5 models that we constructed for adjustaccord-ing explana-tory variables. The unadjusted model showed that individual lower SES had a higher HR for cognitive impairment than indi-vidual higher SES (2.1, 95% CI, 1.97–2.28) (Table 5). After ad-justing for the baseline demographics (model 1), the HR was reduced slightly, but the individual lower SES group still had a higher risk for cognitive impairment (HR, 1.8; 95% CI, 1.62–1.88). Further adjustment for cardiovascular risk factors also decreased the HR to 1.7 (model 2), which was similar to our findings after adjusting for health-related behaviors (model 3) and social re-lationships (model 4). Finally, after all the risk factors were ad-justed (model 5), the individual lower SES group demonstrated a higher risk for cognitive impairment (HR, 1.6; 95% CI, 1.53– 1.80). We also compared the HR of district-level SES on the de-velopment of cognitive impairment according to the 5 models same as the individual SES. The unadjusted HR of district-level SES was 1.1 (95% CI, 1.01–1.13), which has seldom been changed after adjusting all the explanatory variables (HR, 1.1; 95% CI, 1.03–1.16).
DISCUSSION
This 3-year retrospective observational study clearly indicates that individual and district-level socioeconomic inequalities are independently attributable to the development of cognitive impairment among community-dwelling healthy elderly in Seoul, although the effects of district-level SES on the development of cognitive impairment were minimal (RR of district-level SES: 1.1, P for group, 0.026). Our study shows that the individual SES contributes 1.9 times greater to the development of cognitive
Table 5. Adjusted association between risk factors for cognitive impairment and individual SES
Models Adjusted factors HR 95% CI Differences of HR % of reduction
Unadjusted model 2.1 1.97–2.28
Model 1 Age, sex, education, and family history of dementia 1.8 1.62–1.88 0.3 14.3 Model 2 Model 1 + cardiovascular risk factors (hypertension, diabetes, hyperlipidemia, cardiac
disease, and stroke)
1.7 1.59–1.85 0.4 19.0
Model 3 Model 1 + health-related behaviors (smoking, alcohol, and exercise) 1.7 1.61–1.87 0.4 19.0 Model 4 Model 1 + social relationships (marital status and living situation) 1.7 1.56–1.84 0.4 19.0 Model 5 Model 1 + cardiovascular risk factors + health-related behaviors + social relationships 1.6 1.53–1.80 0.5 23.8 SES = socioeconomic status, HR = hazard ratio, CI = confidence interval.
impairment than the district-level SES (RR of individual SES: 2.1 vs. RR of district-level SES: 1.1). Interestingly, however, there were no synergistic or addictive effects of individual and district-level SES on the development of cognitive impairment in the healthy elderly.
From our study, we find that baseline characteristics between lower and higher SES groups are considerably different in terms of demographics, cardiovascular risk factors, health-related be-haviors, and social relationships. The lower SES group, both in-dividual and district-level, herein had more cardiovascular risk factors than the higher SES group, which is in line with findings from previous studies (5,18).
One of our major findings is that the CIR of cognitive impair-ment over 3 years is 2.1 times higher in the individual lower SES group than in the individual higher SES group. In addition, even after adjusting all the different risk factors between the 2 groups, the individual lower SES group still has 1.6 times greater risk for the development of cognitive impairment than the individual higher SES group. Accordingly, our findings suggest that indi-vidual lower SES itself may be an independent risk factor for the development of cognitive impairment, which is consistent with previous studies (4,5).
It is noteworthy that there were only minimal impacts of the district-level lower SES on the development of cognitive impair-ment in the elderly, which is contrary to the previous findings (3,12,19-22). The big difference between the previous studies and the current study is the measurement of district-level SES. Most previous studies have used the combinational measure-ment for the district-level SES, which are generated from sever-al individusever-al variables including percentage of household in pov-erty, percentage of low education, families with a single parent and so on (19-21). In this study, however, we considered the lo-cal tax from each district as a measure for the district-level SES, which could represent infrastructure of each district including industry and business activity (11). Therefore, it is plausible that the significant relationship between district-level SES and cog-nitive function from the previous studies could be influenced by the combinational measurement for the district-level SES, which might cause undifferentiated outcomes between district-level and individual SES since the combinational variables are produced from the several individual variables. In addition, one
possible reason is that unknown confounding/modifying fac-tors associated with district-level SES are also related to cogni-tive outcomes since the mechanisms from lower district-level SES to individual cognitive impairment is difficult to examine. Our findings showing that individual lower SES revealed a greater incidence of cognitive impairment can be justified and explained in several ways. First, poorer health status, such as increased comorbidities, could exacerbate the decline of cogni-tive function among people with lower SES (23,24). However, our results show that the HR of cognitive impairment in the in-dividual lower SES group remains approximately 1.6 times great-er than the risk of cognitive impairment in the individual highgreat-er SES after adjusting for all the risk factors at the baseline, includ-ing demographics, cardiovascular risk factors, health-related behaviors, and social relationships (Table 5). It is remarkable that these risk factors explain only 23.8% of disparities in the risks for the development of cognitive impairment, thus sug-gesting that the greater risk for cognitive impairment among in-dividual lower SES groups is not simply attributable to a higher prevalence of comorbidities or poorer health status, including limited social relationships. Second, people with individual low-er SES may be less likely to engage in cognitive-stimulating ac-tivities, such as reading books or participating in social activi-ties. According to the cognitive reserve theory, it is understood that high levels of cognitive activity are protective against the development of dementia (25,26). Therefore, it is plausible that lesser participation in various cognitive activities may exacer-bate cognitive impairment in lower SES groups. Finally, one hy-pothesis is that psychological stress in people with individual lower SES may lead to an increased allostatic load on stress reg-ulatory systems, including limbic areas and the hippocampus, which might impair the regulatory neuroplasticity of the brain (27). This impairment of limbic neuroplasticity could promote the development of cognitive impairment among people with individual lower SES.
This study has several limitations. First, we did not examine all the possible risk factors that are related to poor cognitive func-tion, such as genetic factors (e.g., APOE), depression, the amount of cognitive leisure activity, or sleep and nutritional status. Sec-ond, we did not have any information about the compliance of participants with treatment for cardiovascular diseases or other comorbidities. Third, the types of insurance and risk factors for cognitive decline were measured only at the baseline. Fourth, the proportion of participants receiving MA services (10.1%) in our study is higher than that of the elderly aged 60 years or old-er (7.2%) in Korea (15). On one hand, this may be a selection bias that impacts our results, but on the other hand, the partici-pants in our study may better represent the characteristics of the individual lower SES. Finally, local tax of each district may not represent the quality of environment such as accessibility to a community center, which also might influence cognitive
func-tion in the elderly.
Nonetheless, the strengths of this study include the follow-ing. First of all, this study is based on longitudinal observation of a very large number of community-dwelling elderly in urban areas. Second, our measurement of SES according to the type of insurance of recipients arguably reflects the general SES of individuals at a more integrated and precise level than tradition-al measures of SES such as education. For example, because the link between education and income is weaker in older women than in other demographics, using educational achievement as a proxy for SES may be limited among older women (18,28). To conclude, we find that individual lower SES is associated with higher incidence of cognitive impairment and a greater risk for the development of cognitive impairment. In addition, individual SES contributes 1.9 times greater to the development of cognitive impairment than the district-level SES. Our results may suggest that individual SES disparities could be considered as an important factor in public health related to cognitive im-pairment in the elderly.
ACKNOWLEDGMENT
We especially appreciate Jin-Ha Kim, Song-Ja Lee, Min-A Choi, and Bo-Young Kim for managing the data from the Seoul Met-ropolitan Center for Dementia.
DISCLOSURE
The authors have no potential conflicts of interest to disclose.
AUTHOR CONTRIBUTION
Conceptualization: Kim GH, Jeong JH. Data curation: Kim GH, Lee HA, Lee DY, Choi KG, Jeong JH. Writing - original draft: Kim GH. Writing - review & editing: Park H, Jo I, Choi SH, Jeong JH.
ORCID
Geon Ha Kim https://orcid.org/0000-0001-5395-1924 Hye Ah Lee https://orcid.org/0000-0002-4051-0350 Hyesook Park https://orcid.org/0000-0002-9359-6522 Dong Young Lee https://orcid.org/0000-0001-8976-8320 Inho Jo https://orcid.org/0000-0001-6060-6416
Seong Hye Choi https://orcid.org/0000-0002-4180-8626 Kyoung-Gyu Choi https://orcid.org/0000-0002-3285-3441 Jee Hyang Jeong https://orcid.org/0000-0001-7945-6956
REFERENCES
1. Lee Y, Back JH, Kim J, Byeon H. Multiple socioeconomic risks and cogni-tive impairment in older adults. Dement Geriatr Cogn Disord 2010; 29:
523-9.
2. Koster A, Penninx BW, Bosma H, Kempen GI, Newman AB, Rubin SM, Satterfield S, Atkinson HH, Ayonayon HN, Rosano C. Socioeconomic dif-ferences in cognitive decline and the role of biomedical factors. Ann Epi demiol 2005; 15: 564-71.
3. Wee LE, Yeo WX, Yang GR, Hannan N, Lim K, Chua C, Tan MY, Fong N, Yeap A, Chen L, et al. Individual and area level socioeconomic status and its association with cognitive function and cognitive impairment (low MMSE) among community-dwelling elderly in Singapore. Dement Geri atr Cogn Dis Extra 2012; 2: 529-42.
4. Marengoni A, Fratiglioni L, Bandinelli S, Ferrucci L. Socioeconomic sta-tus during lifetime and cognitive impairment no-dementia in late life: the population-based aging in the Chianti Area (InCHIANTI) Study. J Alzhei mers Dis 2011; 24: 559-68.
5. Yaffe K, Falvey C, Harris TB, Newman A, Satterfield S, Koster A, Ayonayon H, Simonsick E; Health ABC Study. Effect of socioeconomic disparities on incidence of dementia among biracial older adults: prospective study.
BMJ 2013; 347: f7051.
6. Atti AR, Forlani C, De Ronchi D, Palmer K, Casadio P, Dalmonte E, Frati-glioni L. Cognitive impairment after age 60: clinical and social correlates in the Faenza Project. J Alzheimers Dis 2010; 21: 1325-34.
7. Moretti F, De Ronchi D, Palmer K, Forlani C, Morini V, Ferrari B, Dalmon-te E, Atti AR. Prevalence and characDalmon-teristics of mild cognitive impairment in the general population. Data from an Italian population-based study: the Faenza Project. Aging Ment Health 2013; 17: 267-75.
8. Karp A, Kåreholt I, Qiu C, Bellander T, Winblad B, Fratiglioni L. Relation of education and occupation-based socioeconomic status to incident Al-zheimer’s disease. Am J Epidemiol 2004; 159: 175-83.
9. Noble KG, McCandliss BD, Farah MJ. Socioeconomic gradients predict individual differences in neurocognitive abilities. Dev Sci 2007; 10:
464-80.
10. Zhang M, Gale SD, Erickson LD, Brown BL, Woody P, Hedges DW. Cogni-tive function in older adults according to current socioeconomic status.
Neuropsychol Dev Cogn B Aging Neuropsychol Cogn 2015; 22: 534-43.
11. Wu YT, Prina AM, Brayne C. The association between community envi-ronment and cognitive function: a systematic review. Soc Psychiatry Psy chiatr Epidemiol 2015; 50: 351-62.
12. Lang IA, Llewellyn DJ, Langa KM, Wallace RB, Huppert FA, Melzer D. Nei-ghborhood deprivation, individual socioeconomic status, and cognitive function in older people: analyses from the English Longitudinal Study of Ageing. J Am Geriatr Soc 2008; 56: 191-8.
13. Kim DS. Introduction: health of the health care system in Korea. Soc Work Public Health 2010; 25: 127-41.
14. Kim DS. Special issue on the national health care system of South Korea.
Soc Work Public Health 2010; 25: 125-6.
15. Peter J, Scheef L, Abdulkadir A, Boecker H, Heneka M, Wagner M,
Kop-para A, Klöppel S, Jessen F; Alzheimer’s Disease Neuroimaging Initiative. Gray matter atrophy pattern in elderly with subjective memory impair-ment. Alzheimers Dement 2014; 10: 99-108.
16. Han C, Jo SA, Jo I, Kim E, Park MH, Kang Y. An adaptation of the Korean mini-mental state examination (K-MMSE) in elderly Koreans: demogra-phic influence and population-based norms (the AGE study). Arch Geron tol Geriatr 2008; 47: 302-10.
17. Lee JH, Lee KU, Lee DY, Kim KW, Jhoo JH, Kim JH, Lee KH, Kim SY, Han SH, Woo JI. Development of the Korean version of the Consortium to Es-tablish a Registry for Alzheimer’s Disease Assessment Packet (CERAD-K): clinical and neuropsychological assessment batteries. J Gerontol B Psychol Sci Soc Sci 2002; 57: P47-53.
18. Cox AM, McKevitt C, Rudd AG, Wolfe CD. Socioeconomic status and stroke.
Lancet Neurol 2006; 5: 181-8.
19. Diez Roux AV, Borrell LN, Haan M, Jackson SA, Schultz R. Neighbourhood environments and mortality in an elderly cohort: results from the cardio-vascular health study. J Epidemiol Community Health 2004; 58: 917-23.
20. Wight RG, Aneshensel CS, Miller-Martinez D, Botticello AL, Cummings JR, Karlamangla AS, Seeman TE. Urban neighborhood context, educa-tional attainment, and cognitive function among older adults. Am J Epi demiol 2006; 163: 1071-8.
21. Zeki Al Hazzouri A, Haan MN, Osypuk T, Abdou C, Hinton L, Aiello AE. Neighborhood socioeconomic context and cognitive decline among old-er Mexican Amold-ericans: results from the Sacramento Area Latino Study on Aging. Am J Epidemiol 2011; 174: 423-31.
22. Clarke PJ, Weuve J, Barnes L, Evans DA, Mendes de Leon CF. Cognitive decline and the neighborhood environment. Ann Epidemiol 2015; 25:
849-54.
23. Barnes DE, Yaffe K. The projected effect of risk factor reduction on Alzhei-mer’s disease prevalence. Lancet Neurol 2011; 10: 819-28.
24. Thorpe RJ Jr, Koster A, Kritchevsky SB, Newman AB, Harris T, Ayonayon HN, Perry S, Rooks RN, Simonsick EM; Health, Aging, and Body Compo-sition Study. Race, socioeconomic resources, and late-life mobility and decline: findings from the Health, Aging, and Body Composition study. J Gerontol A Biol Sci Med Sci 2011; 66: 1114-23.
25. Wang HX, Jin Y, Hendrie HC, Liang C, Yang L, Cheng Y, Unverzagt FW, Ma F, Hall KS, Murrell JR, et al. Late life leisure activities and risk of cogni-tive decline. J Gerontol A Biol Sci Med Sci 2013; 68: 205-13.
26. James BD, Wilson RS, Barnes LL, Bennett DA. Late-life social activity and cognitive decline in old age. J Int Neuropsychol Soc 2011; 17: 998-1005.
27. McEwen BS, Gianaros PJ. Central role of the brain in stress and adapta-tion: links to socioeconomic status, health, and disease. Ann N Y Acad Sci 2010; 1186: 190-222.
28. Grundy E, Holt G. The socioeconomic status of older adults: how should we measure it in studies of health inequalities? J Epidemiol Community Health 2001; 55: 895-904.