D I A B E T E S & M E T A B O L I S M J O U R N A L
This is an Open Access article distributed under the terms of the Creative Commons Attribution Non-Commercial License (http://creativecommons.org/licenses/by-nc/4.0/) which permits unrestricted non-commercial use, distribution, and reproduction in any medium, provided the original work is properly cited.
Association between Changes in Anthropometric
Indices and in Fasting Insulin Levels among Healthy
Korean Adolescents: The JS High School Study
Ji Hye Park1,2, Seyeon Mun1, Dong Phil Choi3, Joo Young Lee4, Hyeon Chang Kim2,5
1Department of Public Health, Yonsei University Graduate School, Seoul,
2Cardiovascular and Metabolic Diseases Etiology Research Center, Yonsei University College of Medicine, Seoul, 3National Academy of Agricultural Science, Rural Development Administration, Wanju,
4Department of Medical and Pharmaceutical Affairs, Mapo-gu Health Center, Seoul, 5Department of Preventive Medicine, Yonsei University College of Medicine, Seoul, Korea
Background: This study investigated the association between changes in anthropometric indices and fasting insulin levels among healthy adolescents and whether the association differed by baseline obesity status.
Methods: This analysis was based on data collected for the JS High School study; 884 healthy adolescents aged 15 to 16 years fol-lowed up for 24 to 30 months were included. Changes in anthropometric indices and fasting insulin levels were computed as the difference between baseline and follow-up values. Multivariate linear regression models were used to determine the association between changes in anthropometric indices and fasting insulin levels. Based on body mass index (BMI)-for-age and waist cir-cumference (WC)-for-age percentiles, participants were classified as normal weight (<85th percentile), overweight (85th percen-tile to <95th percenpercen-tile), or obese (≥95th percenpercen-tile).
Results: Changes in BMI, WC, waist-hip ratio, and waist-height ratio were significantly associated with changes in fasting insulin levels in both sexes (P<0.05). In analyses stratified by baseline obesity status, the association between change in BMI and change in fasting insulin was significantly stronger in overweight (males: standardized β=1.136; females: standardized β=1.262) and obese (males: standardized β=1.817; females: standardized β=2.290) participants than in those with normal weight (males: stan-dardized β=0.957; females: stanstan-dardized β=0.976) at baseline. Results were similar for changes in WC.
Conclusion: Changes in anthropometric indices were positively associated with fasting insulin level increases. Moreover, those who were overweight or obese at baseline had a higher absolute increase in fasting insulin levels per one standard deviation unit increase in anthropometric indices than adolescents with normal weight.
Keywords: Adolescent; Insulin; Obesity
Corresponding author: Hyeon Chang Kim https://orcid.org/0000-0001-7867-1240 Department of Preventive Medicine, Yonsei University College of Medicine, 50-1 Yonsei-ro, Seodaemun-gu, Seoul 03722, Korea
E-mail: [email protected]
INTRODUCTION
According to the World Health Organization, childhood over-weight and obesity are among the most serious health issues that cause secondary health problems and lead to obesity in adulthood [1]. In the United States, the prevalence of obesity for children and adolescents was 16.9% in 2009 to 2010 [2]. In
Korea, the prevalence of childhood and adolescent obesity has increased from 5.8% in 1997 to 9.7% in 2005, with the increase more pronounced in boys, particularly those aged 13 to 18 years [3]. In particular, Korean adolescents have less physical activities and increased sedentary behavior because of their daily schoolwork, making them obese [4,5].
The association between obesity and insulin resistance has https://doi.org/10.4093/dmj.2018.0034
been reported in observational studies [6-10]. Adolescent obe-sity is associated with an increased risk of developing insulin resistance in adulthood [9,10]. Recent studies have demon-strated that high levels of glucose homeostasis variables, such as glucose, insulin, and homeostasis model assessment of insu-lin resistance (HOMA-IR), in childhood not only persist into adulthood but also predict pre-diabetes and type 2 diabetes mellitus and are related to cardiometabolic risk factors in adults [7,8]. There is also evidence that insulin resistance are not only the result of obesity, but also the possibility of contrib-uting to the onset of obesity [11]. Despite extensive studies on insulin resistance and obesity, the association between changes in anthropometric indices during adolescents and changes in levels of glucose homeostasis variables remains unclear.
Therefore, we investigated the association between changes in anthropometric indices and change in fasting insulin levels over 2.4 years and further investigated whether the association differs according to obesity status at baseline.
METHODS
Study population
Our study was based on data collected for the JS High School study, which is a prospective cohort study of a Korean adoles-cent population. The target population of the JS High School study was first graders at a high school located in a rural area of South Korea. Baseline examinations were conducted on 1,071 participants in 2007, 2010, 2011, and 2012. Participants enrolled from 2007 through 2011 were re-examined after 30 months of follow-up, and those enrolled in 2012 were re-ex-amined after 24 months of follow-up. We based our study on the 884 participants who participated in both the baseline in-vestigations at first grade and the re-examination at third grade. The details of the study design and procedures have been previously described [12]. All participants had no previ-ous diagnosis of diabetes mellitus or hypertension. Informed consent was obtained from each student as well as from his/ her parent or guardian after full explanation of the purpose and process of the study. The study protocol and consent pro-cedure were approved by the Institutional Review Board of Severance Hospital at Yonsei University College of Medicine (approval No. 4-20100169).
Measurements
Health-related lifestyle factors and disease history were
evalu-ated using self-administered questionnaires. Smokers were de-fined as participants who smoked at least 100 cigarettes in their lifetime. Drinkers were defined as participants who consumed alcoholic beverages at least once a month over the last year. Regular exercise was defined as engaging in physical activity for at least 30 minutes once a week at moderate intensity, either indoor or outdoor. Height was measured to the nearest 0.1 cm using a stadiometer, while body weight was measured to the nearest 0.1 kg on a digital scale (Seca 763; SECA, Hamburg, Germany), with the subject wearing his/her school uniform. Body mass index (BMI) was calculated as weight in kilograms divided by the square of height in meters (kg/m2). Waist
cir-cumference (WC) was measured between the lower borders of the rib cage and the iliac crest with a measuring tape. Hip cir-cumference was measured at the level of widest circir-cumference over the greater trochanters. Waist-hip ratio (WHR) was cal-culated as WC divided by hip circumference. Waist-height ra-tio (WHtR) was calculated as WC divided by height.
Resting blood pressure was measured twice at 5-minute in-tervals using an automatic sphygmomanometer (Dinamap 1846 SX/P; GE, Chicago, IL, USA) with the participant in the sitting position. If the two readings differed by more than 10 mm Hg, additional measurements were obtained and the last two readings were averaged. Fasting blood samples were drawn after at least an 8-hour fasting. Serum concentrations of total cholesterol, high density lipoprotein cholesterol (HDL-C), and triglycerides were measured via enzymatic methods using an autoanalyzer (ADVIA 1800; Siemens Healthcare Diagnostics Inc., Deerfield, IL, USA). Fasting glucose level was measured via a glucose hexokinase method. The insulin level was mea-sured via a radioimmunometric method. The HOMA-IR was calculated as the product of the fasting plasma insulin level (µIU/L) and the fasting plasma glucose level (mg/dL) divided by 405.
Statistical analysis
Data are presented either as mean±standard deviation or number with percent. Differences between baseline and fol-low-up were analyzed using a paired t-test. Correlations be-tween variables were evaluated using Spearman’s correlation coefficient. Multivariate linear regression models were used to examine the association between anthropometric indices and fasting insulin levels, adjusting for potential confounding vari-ables, including age, smoking status, alcohol intake, and physi-cal activity. To examine whether the association was dependent
on baseline obesity status, we stratified the analyses according to the following baseline categories of BMI and WC. Sex-spe-cific BMI-for-age and WC-for-age percentiles were calculated
following the 2007 Korean National Growth Charts [13]. Based on BMI-for-age percentiles, participants were classified as normal weight (<85th percentile), overweight (85th
percen-Table 1. Clinical characteristics at baseline and follow-up examinations
Variable Baseline Follow-up Change P value
Male (n=458) Age, yr 15.9±0.4 18.3±0.3 2.4±0.2 <0.001 Height, cm 171.4±5.2 172.9±5.1 1.5±1.6 <0.001 Weight, kg 64.8±10.1 68.1±10.3 3.2±4.6 <0.001 BMI, kg/m2 22.0±3.1 22.7±3.0 0.7±1.5 <0.001 WC, cm 73.4±7.9 75.7±8.1 2.3±5.0 <0.001 Hip circumference, cm 94.2±6.3 96.0±6.7 1.8±5.2 <0.001 WHR, % 77.8±5.1 78.8±5.9 1.0±6.1 0.001 WHtR, % 42.8±4.6 43.8±4.6 0.9±3.0 <0.001
Systolic blood pressure, mm Hg 115.1±12.7 123.7±11.7 8.6±12.9 <0.001
Diastolic blood pressure, mm Hg 61.5±7.9 68.7±7.8 7.2±9.2 <0.001
Total cholesterol, mg/dL 149.0±25.4 158.8±28.8 10.1±18.2 <0.001 Triglycerides, mg/dL 76 (59–97) 68 (52–89) −6.5±34.6 <0.001 HDL-C, mg/dL 44.6±10.3 52.1±10.4 7.6±8.8 <0.001 Fasting glucose, mg/dL 88.3±7.1 83.2±7.5 −5.1±7.3 <0.001 Insulin, µIU/L 8.5±2.8 9.8±5.0 1.2±4.7 <0.001 HOMA-IR 1.9±0.7 2.0±1.3 0.2±1.2 0.007 Female (n=426) Age, yr 15.9±0.4 18.3±0.3 2.4±0.2 <0.001 Height, cm 159.9±5.0 160.5±5.1 0.6±0.8 <0.001 Weight, kg 54.2±7.4 56.0±8.2 1.8±3.8 <0.001 BMI, kg/m2 21.2±2.6 21.7±2.9 0.6±1.5 <0.001 WC, cm 68.6±6.7 69.7±8.3 1.1±7.4 0.002 Hip circumference, cm 93.2±5.2 94.0±5.8 0.8±3.7 <0.001 WHR, % 73.5±5.0 74.0±6.6 0.6±7.5 0.111 WHtR, % 42.9±4.1 43.5±5.1 0.5±4.6 0.017
Systolic blood pressure, mm Hg 104.1±10.1 111.2±9.6 7.1±10.6 <0.001
Diastolic blood pressure, mm Hg 60.4±7.2 65.5±8.0 5.1±8.3 <0.001
Total cholesterol, mg/dL 162.1±26.6 164.9±25.6 3.7±20.6 <0.001 Triglycerides, mg/dL 75 (56–65) 66 (52–84) −4.8±36.4 0.009 HDL-C, mg/dL 50.2±11.0 56.9±11.4 7.3±9.6 <0.001 Fasting glucose, mg/dL 86.4±6.8 81.8±7.4 −4.7±7.2 <0.001 Insulin, µIU/L 8.6±2.8 9.9±4.6 1.3±4.6 <0.001 HOMA-IR 1.8±0.7 2.0±1.2 0.2±1.1 0.002
Values are presented as mean±standard deviation or median (interquartile range).
BMI, body mass index; WC, waist circumference; WHR, waist-hip ratio; WHtR, waist-height ratio; HDL-C, high density lipoprotein cholester-ol; HOMA-IR, homeostasis model assessment of insulin resistance.
tile to <95th percentile), or obese (≥95th percentile). Based on WC-for-age percentiles, participants were classified as normal (<90th percentile) or obese (≥90th percentile). The changes in anthropometric indices and fasting insulin levels were com-puted as the difference between baseline and follow-up values. All statistical analyses were performed using SAS version 9.2 (SAS Institute, Cary, NC, USA). Statistical significance was de-fined as a two-sided P value less than 0.05.
RESULTS
The clinical and biochemical characteristics at baseline and their changes over 2.4 years are presented in Table 1. As would be expected, anthropometric indices, blood pressure, total cholesterol, HDL-C, and fasting insulin levels were increased in both sexes. Meanwhile, triglycerides and fasting glucose sig-nificantly decreased in both sexes. Although BMI sigsig-nificantly increased in both sexes, BMI z-score decreased by 0.06 in males and by 0.19 in females on average. Fasting glucose de-creased by 5.1 mg/dL in males and by 4.7 mg/dL in females on average. At follow-up, the proportion of hypertension, hyper-glycemia, hypertriglyceridemia, and low HDL-C concentra-tions was observed in 2.8%, 1.5%, 3.9%, and 17.2% of males, respectively. In females, the proportion of hypertension, hy-perglycemia, hypertriglyceridemia, and low HDL-C concen-trations was observed in 0.7%, 0.7%, 3.5%, and 33.6%, respec-tively.
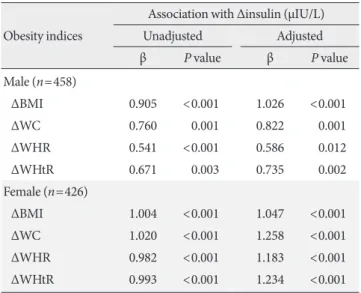
Results of multivariate linear regression analyses are pre-sented in Table 2. In both sexes, increases in anthropometric indices were associated with increase in fasting insulin on fol-low-up in the unadjusted model. These associations remained significant even after adjusting for baseline age, BMI (or WC), smoking, physical activity, and alcohol intake. In males, the change in BMI was more strongly associated with change in fasting insulin (BMI: β=1.026, P<0.001) than indices of ab-dominal obesity (WC: β=0.822, P=0.001; WHR: β=0.586, P= 0.012; WHtR: β=0.735, P=0.002). Meanwhile, in females, the change in indices of abdominal obesity was more strongly as-sociated with change in fasting insulin (WC: β=1.258, P< 0.001; WHR: β=1.183, P<0.001; WHtR: β=1.234, P<0.001) than BMI (β=1.047, P<0.001).
Results of subgroup analysis of obesity status at baseline are presented in Table 3. In analyses stratified by baseline BMI cat-egories, the association between change in BMI and change in fasting insulin was stronger in the overweight group (males:
β=1.136, P=0.028; females: β=1.262, P=0.389) and in the obese group (males: β=1.817, P=0.036; females: β=2.290, P= 0.040), than in the normal group (males: β=0.957, P=0.008; females: β=0.976, P<0.001) at baseline after adjusting for baseline age, WC, smoking, physical activity, and alcohol in-take. Similarly, in analyses stratified by baseline WC categories, the association between change in WC and change in fasting insulin was stronger in the obese group (males: β=1.806, P= 0.060; females: β=2.080, P=0.017) than in the normal group (males: β=0.648, P=0.010; females: β=1.085, P<0.001) at baseline. There was a similar association between changes in obesity indices and change in HOMA-IR.
DISCUSSION
In this study, we demonstrated that the level of insulin increase was associated with changes in BMI, WC, WHR, and WHtR. Among the obesity indices, BMI and WC were more strongly associated with increase of fasting insulin levels than WHR and WHtR, and these associations were more pronounced among those who were overweight or obese at baseline com-pared to normal weight participants.
Table 2. Association between changes in obesity indices and
change in fasting insulin Obesity indices
Association with Δinsulin (µIU/L)
Unadjusted Adjusted β P value β P value Male (n=458) ΔBMI 0.905 <0.001 1.026 <0.001 ΔWC 0.760 0.001 0.822 0.001 ΔWHR 0.541 <0.001 0.586 0.012 ΔWHtR 0.671 0.003 0.735 0.002 Female (n=426) ΔBMI 1.004 <0.001 1.047 <0.001 ΔWC 1.020 <0.001 1.258 <0.001 ΔWHR 0.982 <0.001 1.183 <0.001 ΔWHtR 0.993 <0.001 1.234 <0.001
Adjusted for age, waist circumference (only BMI analysis), BMI (WC, WHR, and WHtR analysis), smoking status, alcohol intake, and phys-ical activity at baseline.
Δ, change between baseline and follow-up; β, regression coefficients are calculated per one standard deviation for each anthropometric variable; BMI, body mass index; WC, waist circumference; WHR, waist-hip ratio; WHtR, waist-height ratio.
Our findings are consistent with other studies showing that obesity is associated with fasting insulin levels, and both BMI and WC were strongly associated with serum insulin levels compared to other anthropometric indices [14-16]. In this study, fasting insulin levels are strongly associated with BMI in males, while they are associated with indicators of central obe-sity (WC, WHR, and WHtR) in females, presumably because of the difference in growth rate between males and females. Before women start menstruating, they have already reached close to their maximum height [17]. On the other hand, the growth rate of men peaks when they are approximately 14 years old, and the growth continues until about 18 to 20 years old [18]. Similarly, the average age of the participants in our study was 16 years old, which was when the growth spurts of the females was over, but the males continue to grow.
A cohort study of 3,313 children and adolescents aged 5 to 17 years reported that elevated fasting insulin levels have been shown to persist over time in children [19]. In addition, anoth-er previous study showed that participants aged 12 to 23 years
with persistently high levels of insulin over the 8-year period had adverse effects on the levels of BMI, blood pressure, total cholesterol, triglycerides, and lipoprotein cholesterols, and they were more likely to develop hypertension, dyslipidemia, and obesity in young adulthood [20]. In our study, increasing levels of obesity indicators in obese adolescents at baseline was more closely associated with increasing fasting insulin levels than in those with normal weight. Our results indicated that obesity may play an important role in the association of the in-creases of insulin levels. Chronic elevated blood insulin levels promote further insulin resistance through desensitization of target cells by reducing the number of receptors expressed at the cell surface [21,22]. Based on these mechanisms, the in-crease in insulin levels during adolescence might be associated with the risk of early adulthood onset type 2 diabetes mellitus [23]. In addition, we also demonstrated that correlation be-tween obesity and fasting blood glucose was weaker than insu-lin levels in adolescents (Supplementary Table 1). According to previous studies [24,25], in adolescents, insulin resistance may
Table 3. Association between changes in obesity indices and change in fasting insulin and HOMA-IR, stratified by obesity status
at baseline
Obesity status at baseline No. of people ΔInsulin ΔHOMA-IR
β P value β P value
Male (n=458) ΔBMI
Baseline BMI <85th percentile 381 0.957 0.008 0.136 0.078
Baseline BMI 85th to <95th percentile 51 1.136 0.028 0.241 0.028
Baseline BMI ≥95th percentile 26 1.817 0.036 0.408 0.037
ΔWC
Baseline WC <90th percentile 435 0.648 0.010 0.150 0.027
Baseline WC ≥90th percentile 23 1.806 0.060 0.355 0.071
Female (n=426) ΔBMI
Baseline BMI <85th percentile 362 1.007 <0.001 0.216 0.001
Baseline BMI 85th to <95th percentile 40 1.262 0.389 0.214 0.509
Baseline BMI ≥95th percentile 24 2.535 0.016 0.557 0.011
ΔWC
Baseline WC <90th percentile 392 1.085 <0.001 0.220 0.002
Baseline WC ≥90th percentile 34 2.080 0.017 0.479 0.013
Adjusted for age, waist circumference (only BMI analysis), BMI (only WC analysis), smoking status, alcohol intake, and physical activity at base-line.
HOMA-IR, homeostasis model assessment of insulin resistance; Δ, change between baseline and follow-up; β, regression coefficients are calcu-lated per one standard deviation for each anthropometric variable; BMI, body mass index; WC, waist circumference.
be associated with normal fasting blood glucose due to pancre-atic compensatory hyperinsulinemia. In young people without diabetes, although plasma glucose levels are maintained within a narrow range through puberty, have increased fasting insulin levels [26,27]. In fact, according to our results, the blood glu-cose concentration decreased and the insulin concentration increased for 2 years. This may be a sign of insulin resistance, where insulin secretion increases with increasing adiposity to maintain normal glucose levels [28]. Adolescence is generally easy to think that healthy group with a low incidence rate of cardiovascular disease or mortality rate. However, even if the symptoms do not appear, most illnesses and many health problems already begin in adolescence. In the same vein, it can be overlooked that obese adolescents continue to have elevated levels of insulin to control their blood glucose.
This study has some limitations. First, most of the study par-ticipants were in the midst of puberty; thus, hormonal status may influence the indices of anthropometry, as well as glucose homeostasis variables. Moreover, insulin resistance during pu-berty cannot be distinguished from insulin resistance due to obesity. In addition, our results showed that insulin concentra-tion and HOMA-IR increased, but triglyceride, a factor associ-ated with insulin resistance, decreased. Although we measured fasting insulin and calculated HOMA-IR, these indicators may not reflect changes in insulin resistance in adolescence. Sec-ond, because of the lack of dietary intake data, this study did not address the role of diet in the regulation of glucose homeo-stasis and related risk of obesity. Finally, this study was con-ducted at a single high school and included one ethnic group; thus, the study findings cannot be generalized to other adoles-cent populations. In cross-sectional study of general Korean adolescents [29], insulin and HOMA-IR decreased by increas-ing age. When the same population was followed up as in our study, the results showed that insulin and HOMA-IR may in-crease by increasing age. Therefore, more follow-up studies are needed for adolescents.
In conclusion, this study suggests that increase in BMI, WC, WHR, and WHtR were positively associated with increase in fasting insulin levels. Among all anthropometric indices, BMI and WC were more associated with elevated fasting insulin levels. Furthermore, compared with healthy adolescents, over-weight or obese adolescents at baseline may have higher insu-lin levels when anthropometric indices are increased. Al-though insulin measurements are not recommended in ado-lescents [30], our results suggest that changes in obesity indices
in adolescence may lead to an increase in insulin concentra-tions and HOMA-IR. As in many areas of child health, in-creases in anthropometric indices during adolescence will af-fect the overall health during adulthood. Therefore, lifestyle practices that prevent or control obesity are important during adolescence, and these practices may help prevent hyperglyce-mia, insulin resistance, and even diabetes.
CONFLICTS OF INTEREST
No potential conflict of interest relevant to this article was re-ported.
ACKNOWLEDGMENTS
This research was supported by Basic Science Research Pro-gram through the National Research Foundation of Korea (NRF) grant funded by the Ministry of Education, Science and Technology (MEST) (No. 2010-0007860, No. 2015R1D1A-1A09057301).
REFERENCES
1. World Health Organization: Global Strategy on Diet, Physical Activity and Health. Available from: https://www.who.int/ nmh/wha/59/dpas/en/ (cited 2018 Dec 27).
2. Ogden CL, Carroll MD, Kit BK, Flegal KM. Prevalence of obe-sity and trends in body mass index among US children and ad-olescents, 1999-2010. JAMA 2012;307:483-90.
3. Oh K, Jang MJ, Lee NY, Moon JS, Lee CG, Yoo MH, Kim YT. Prevalence and trends in obesity among Korean children and adolescents in 1997 and 2005. Korean J Pediatr 2008;51:950-5. 4. Lee M, Larson R. The Korean ‘examination hell’: long hours of
studying, distress, and depression. J Youth Adolesc 2000;29: 249-71.
5. Kong IG, Lee HJ, Kim SY, Sim S, Choi HG. Physical activity, study sitting time, leisure sitting time, and sleep time are differ-ently associated with obesity in Korean adolescents: a popula-tion-based study. Medicine (Baltimore) 2015;94:e1965. 6. Daniels SR, Arnett DK, Eckel RH, Gidding SS, Hayman LL,
Kumanyika S, Robinson TN, Scott BJ, St Jeor S, Williams CL. Overweight in children and adolescents: pathophysiology, consequences, prevention, and treatment. Circulation 2005; 111:1999-2012.
Changes in risk variables of metabolic syndrome since child-hood in pre-diabetic and type 2 diabetic subjects: the Bogalusa Heart Study. Diabetes Care 2008;31:2044-9.
8. Srinivasan SR, Myers L, Berenson GS. Changes in metabolic syndrome variables since childhood in prehypertensive and hypertensive subjects: the Bogalusa Heart Study. Hypertension 2006;48:33-9.
9. Sinaiko AR, Donahue RP, Jacobs DR Jr, Prineas RJ. Relation of weight and rate of increase in weight during childhood and ad-olescence to body size, blood pressure, fasting insulin, and lip-ids in young adults. The Minneapolis Children’s Blood Pressure Study. Circulation 1999;99:1471-6.
10. Whitaker RC, Wright JA, Pepe MS, Seidel KD, Dietz WH. Pre-dicting obesity in young adulthood from childhood and paren-tal obesity. N Engl J Med 1997;337:869-73.
11. Karpe F, Dickmann JR, Frayn KN. Fatty acids, obesity, and in-sulin resistance: time for a reevaluation. Diabetes 2011;60: 2441-9.
12. Choi DP, Lee JY, Kim HC. Cohort profile: The JS High School study (JSHS): a cohort study of Korean adolescents. Int J Epi-demiol 2017;46:393-402.
13. Korea Center for Disease Control and Prevention. Korean Children and Adolescents Growth Standard (commentary for the development of 2007 growth chart). Seoul: Korea Center for Disease Control and Prevention; 2007.
14. Kondaki K, Grammatikaki E, Pavon DJ, Manios Y, Gonzalez-Gross M, Sjostrom M, Gottrand F, Molnar D, Moreno LA, Kaf-atos A, Gilbert C, Kersting M, De Henauw S. Comparison of several anthropometric indices with insulin resistance proxy measures among European adolescents: The Helena Study. Eur J Pediatr 2011;170:731-9.
15. Freedman DS, Kahn HS, Mei Z, Grummer-Strawn LM, Dietz WH, Srinivasan SR, Berenson GS. Relation of body mass index and waist-to-height ratio to cardiovascular disease risk factors in children and adolescents: the Bogalusa Heart Study. Am J Clin Nutr 2007;86:33-40.
16. Sung RY, Yu CC, Choi KC, McManus A, Li AM, Xu SL, Chan D, Lo AF, Chan JC, Fok TF. Waist circumference and body mass index in Chinese children: cutoff values for predicting cardio-vascular risk factors. Int J Obes (Lond) 2007;31:550-8. 17. Nakamoto JM. Myths and variations in normal pubertal
devel-opment. West J Med 2000;172:182-5.
18. Malina RM, Bouchard C. Growth, maturation, and physical activity. Champaign: Human Kinetics Books; 1991.
19. Burke GL, Webber LS, Srinivasan SR, Radhakrishnamurthy B,
Freedman DS, Berenson GS. Fasting plasma glucose and insu-lin levels and their relationship to cardiovascular risk factors in children: Bogalusa Heart Study. Metabolism 1986;35:441-6. 20. Bao W, Srinivasan SR, Berenson GS. Persistent elevation of
plasma insulin levels is associated with increased cardiovascu-lar risk in children and young adults. The Bogalusa Heart Study. Circulation 1996;93:54-9.
21. Gavin JR 3rd, Roth J, Neville DM Jr, de Meyts P, Buell DN. In-sulin-dependent regulation of insulin receptor concentrations: a direct demonstration in cell culture. Proc Natl Acad Sci U S A 1974;71:84-8.
22. Hunter SJ, Garvey WT. Insulin action and insulin resistance: diseases involving defects in insulin receptors, signal transduc-tion, and the glucose transport effector system. Am J Med 1998;105:331-45.
23. Kahn SE, Prigeon RL, McCulloch DK, Boyko EJ, Bergman RN, Schwartz MW, Neifing JL, Ward WK, Beard JC, Palmer JP. Quantification of the relationship between insulin sensitivity and beta-cell function in human subjects. Evidence for a hy-perbolic function. Diabetes 1993;42:1663-72.
24. Sinha R, Fisch G, Teague B, Tamborlane WV, Banyas B, Allen K, Savoye M, Rieger V, Taksali S, Barbetta G, Sherwin RS, Caprio S. Prevalence of impaired glucose tolerance among children and adolescents with marked obesity. N Engl J Med 2002;346:802-10.
25. Li C, Ford ES, Zhao G, Mokdad AH. Prevalence of pre-diabetes and its association with clustering of cardiometabolic risk fac-tors and hyperinsulinemia among U.S. adolescents: National Health and Nutrition Examination Survey 2005-2006. Diabe-tes Care 2009;32:342-7.
26. Smith CP, Dunger DB, Williams AJ, Taylor AM, Perry LA, Gale EA, Preece MA, Savage MO. Relationship between insulin, in-sulin-like growth factor I, and dehydroepiandrosterone sulfate concentrations during childhood, puberty, and adult life. J Clin Endocrinol Metab 1989;68:932-7.
27. Rosenbloom AL, Wheeler L, Bianchi R, Chin FT, Tiwary CM, Grgic A. Age-adjusted analysis of insulin responses during normal and abnormal glucose tolerance tests in children and adolescents. Diabetes 1975;24:820-8.
28. Nambiar S, Truby H, Davies PS, Baxter K. Use of the waist-height ratio to predict metabolic syndrome in obese children and adolescents. J Paediatr Child Health 2013;49:E281-7. 29. Yi KH, Hwang JS, Kim EY, Lee SH, Kim DH, Lim JS.
Preva-lence of insulin resistance and cardiometabolic risk in Korean children and adolescents: a population-based study. Diabetes
Res Clin Pract 2014;103:106-13.
30. Styne DM, Arslanian SA, Connor EL, Farooqi IS, Murad MH, Silverstein JH, Yanovski JA. Pediatric obesity-assessment,
treat-ment, and prevention: an Endocrine Society clinical practice guideline. J Clin Endocrinol Metab 2017;102:709-57.