Abstract. Fabry disease is an X-linked lysosomal storage disorder caused by mutations in the gene encoding the
α-galactosidase A (α-Gal A) lysosomal enzyme, which results in globotriaosylceramide (Gb3) storage in vascular endothelial cells and different cell types throughout the body. Involvement of the kidney and heart is life threatening, and fibrosis of these organs is considered to be involved in the pathogenesis of Fabry disease. An increased concentration of deacylated Gb3 (lyso-Gb3) in the plasma of symptomatic patients has also been suggested as a causative molecular event. To elucidate the molecular mechanisms involved in renal fibrosis in Fabry disease, the present analyzed the changes in global gene expression prior to and following Gb3 or lyso-Gb3 treatment in two types of kidney cell lines, human proximal renal tubular epithelial (HK-2) and mouse renal glomerular mesangial (SV40 MES 13) cells. Gb3 and lyso-Gb3 treatment regulated the expression of 199 and 328 genes in each cell type, demon-strating a >2.0-fold change. The majority of the biological functions of the regulated genes were associated with fibro-genesis or epithelial-mesenchymal transition (EMT). The gene expression patterns of sphingolipid-treated HK-2 cells were distinguishable from the patterns in the SV40 MES 13 cells. Several genes associated with the EMT were selected and evaluated further in kidney cells and in Fabry mouse kidney tissues. In the SV40 MES 13 cells, the DLL1, F8, and HOXA11 genes were downregulated, and FOXP2 was upregulated by treatment with Gb3 or lyso-Gb3. In the HK-2 cells, the ADAMTS6, BEST1, IL4, and MYH11 genes were upregulated. Upregulation of the FOXP2, COL15A1, IL4, and
MYH11 genes was also observed in the Fabry mouse kidney
tissues. The gene expression profiles in kidney cells following the addition of Gb3 or lyso-Gb3 revealed substrate‑specific and cell‑specific patterns. These findings suggested that Gb3 and lyso‑Gb3 lead to renal fibrosis in Fabry disease through different biochemical modulations.
Introduction
Fabry disease (OMIM 301500) is an X-linked lysosomal storage disorder, which is caused by mutations in the gene encoding the lysosomal enzyme α-galactosidase A (α-Gal A; EC 3.2.1.22) (1,2). In Fabry disease, globotriaosylceramide (Gb3) accumulation occurs in lysosomes and other cellular compartments, and results in disease manifestation and organ failure. Among the types of cell in the kidney in which Gb3 accumulates and Gb3 inclusions are found, podocytes are most prominently involved, followed by distal tubular cells and parietal epithelial cells. Prominent Gb3 accumulation occurs in hemizygotes at or even prior to birth, prior to the develop-ment of any clinical symptoms (3). The initial symptoms of Fabry disease, including angiokeratoma, neuropathic pain, hypohidrosis or hyperhidrosis, and digestive tract symptoms, usually appear in childhood in heterozygotes. During the second decade of life, potentially life-threatening involve-ment may develop, including stroke, chronic kidney disease associated with fibrosis, proteinuria and progressive decrease in glomerular filtration rate, left ventricular hypertrophy and heart failure (3). Organ fibrosis is a key feature of Fabry disease (4). Progressive podocyte injury can lead to podocyte loss and segmental glomerulosclerosis, the latter of which is a common late finding in Fabry nephropathy.
The presence of deacylated Gb3, globotriaosylsphingosine (lyso-Gb3), in the plasma of disease patients with Fabry has been noted as a hallmark of Fabry disease (5). Aerts et al (5) reported that the plasma of Fabry patients contains markedly increased concentrations of lyso-Gb3, and the increase in the plasma concentration of this soluble glycolipid exceeds that of Gb3. Lyso-Gb3 promotes Gb3 storage and induces proliferation of smooth muscle cells in vitro, which is sugges-tive of a causasugges-tive role of lyso-Gb3 in the pathogenesis of Fabry disease (5). In cultured human podocytes, lyso-Gb3 recruits secondary mediators of inflammation and fibrosis. Even in normal human podocytes, lyso-Gb3 increases the
Substrate-specific gene expression profiles in different
kidney cell types are associated with Fabry disease
YOUN-JEONG SHIN*, YEO JIN JEON*, NAMHEE JUNG, JOO-WON PARK, HAE-YOUNG PARK and SUNG-CHUL JUNG
Department of Biochemistry, School of Medicine, Ewha Womans University, Seoul 158-710, Republic of Korea Received September 12, 2014; Accepted May 28, 2015
DOI: 10.3892/mmr.2015.4010
Correspondence to: Dr Sung-Chul Jung, Department of Biochemistry, School of Medicine, Ewha Womans University, 1071 Anyangcheon-ro, Seoul 158-710, Republic of Korea
E-mail: jungsc@ewha.ac.kr *Contributed equally
Key words: Fabry disease, kidney, globotriaosylceramide, globotriaosylsphingosine, gene expression profile, mesangial cell, epithelial cell
expression of the fibrogenic cytokine transforming growth factor β1 (TGFβ1) in a dose- and time-dependent manner, and increases the synthesis of extracellular matrix (ECM) proteins, including fibronectin and type IV collagen, in a TGFβ1-dependent manner (6). Fibrosis is characterized by an increased accumulation of the ECM (7-9). In addition, through potential direct effects of glycolipids on tubular cells, proteinuria itself may lead to tubular cell activation, inflam-matory responses and interstitial fibrosis (4). Activation of interstitial fibroblasts gives rise to collagen-secreting myofibroblasts. However, different studies have demon-strated that myofibroblasts can also originate from renal tubular epithelial and endothelial cells, which undergo the epithelial-mesenchymal transition (EMT), in mouse models of renal fibrosis (10,11).
The present study aimed to identify changes in the gene expression profiles of epithelial and mesangial cells grown in culture and exposed to Gb3 or lyso-Gb3, as a model of Fabry disease. Microarrays were used to identify the gene expression profiles, which contribute to the EMT process and leads to kidney fibrosis. In addition, the expression profiles in different tissues and cells were compared to discern the cell‑specific activation patterns in the epithelial and mesangial cells. Materials and methods
Animals. Fabry mice were bred to acquire a sufficient
number of mice (12). Mice were maintained on a diurnal light cycle of 12 h in a temperature (21±2˚C) and humidity (55±5%) controlled room. Mice were fed an autoclaved diet and water ad libitum. The present study was approved by the Institutional Animal Care and Use Committee of the Ewha Womans University School of Medicine (Seoul, Korea). All mice were treated in accordance with the Animal Care Guidelines of the Ewha Womans University School of Medicine, and the National Research Council (US) Guide for the Care and Use of Laboratory Animals (13). All mice were genotyped using polymerase chain reaction (PCR; Bio-Rad Laboratories, Inc., Johannesburg, South Africa). The mice were all 16-week-old males and were grouped into wild-type and hemizygous Fabry mice. A minimum of 3 age-matched mice were used for each group. Animals were sacrificed by CO2 inhalation euthanasia.
Cell culture. For the in vitro investigation, the HK-2 Homo sapiens kidney tubular epithelial cell line and SV40 MES 13
mouse kidney glomerular mesangial cell line were purchased from American Type Culture Collection (Manassas, VA, USA). The HK-2 cells were cultured in complete growth media; keratinocyte serum-free medium supplemented with 0.05 mg/ml bovine pituitary extract, 5 ng/ml human recombi-nant epidermal growth factor (EGF) and 5 µg/ml gentamicin (Invitrogen Life Technologies, Carlsbad, CA, USA). The SV40 MES 13 cells were maintained in a 3:1 mixture of Dulbecco's modified Eagle's medium and Ham's F12 medium (Welgene, Daegu, Korea) with 14 mM HEPES (Welgene) supplemented with 5% fetal bovine serum (Invitrogen Life Technologies) and penicillin/streptomycin (100 U/ml; Invitrogen Life Technologies) at 37˚C in 5% CO2 in a
humidi-fied incubator.
Gb3 and lyso‑Gb3 treatment. The HK-2 cells (1x10⁵) and
SV40 MES 13 (4x10⁴) cells were seeded into 60 mm tissue
culture plates (SPL Life Sciences, Pocheon-si, Korea), and proportion of which were treated with Gb3 (Matreya, Pleasant Gap, PA, USA) or lyso-Gb3 (Sigma-Aldrich, St. Louis, MO, USA) in serum‑free culture medium. The final concentration of treatment was 30 µM for Gb3 and 400 nM for lyso-Gb3, which were dissolved in 100% dimethyl sulfoxide (Sigma-Aldrich). The cells were treated with Gb3 or lyso-Gb3 for 72 h.
Microarray analysis. The HK-2 cells and SV40 MES 13 cells
were assigned to a control and a Gb3- or lyso-Gb3-treated group. The cells from each group were pooled, and the total RNA was extracted using an RNeasy Plus Mini Kit (Qiagen, Valencia, CA, USA), according to the manufac-turer's instructions. The quality of RNA was analyzed using a 2100 Bioanalyzer (Agilent Technologies, Inc., Palo Alto, CA, USA). The total RNA from each group was amplified separately using a Low RNA Input Linear Amplification kit PLUS (Agilent Technologies). The Cy3 (control)- or Cy5 (Gb3 or lyso-Gb3 treated)-labeled targets were hybridized to an Agilent 44K human or mouse oligo microarray at 60˚C for 17 h. Following hybridization, the arrays were washed in three consecutive steps using an Agilent Gene Expression Wash Buffer kit (Agilent Technologies, Inc.). The microar-rays were scanned using a DNA Microarray scanner using SureScan High-Resolution Technology (G2565CA; Agilent Technologies, Inc.) and were analyzed using GeneSpring GX software (Agilent Technologies, Inc.). For normalization and hierarchical clustering analysis, the data obtained from the Gb3- and lyso-Gb3-treated cells were corrected using the values for the appropriate control and then imported into the GeneSpring GX software. Significant genes were selected for probes that exhibited a difference of >2-fold in the normalization ratio. In the functional investigation, analysis of gene ontology was used to predict the function of each gene, classified by the biological process. Genes specifically expressed in each cluster of Gb3 or lyso-Gb3 treated cells were identified by comparing with non‑treated control cells. Differentially expressed genes were categorized in Gene Ontology groups using the DAVID tool (http://david.abcc. ncifcrf.gov/).
Reverse transcription‑quantitative (RT‑qPCR). Using the
results from the microarray analysis, the present study identi-fied genes, which were either upregulated or downregulated by >2‑fold as significant genes. RT‑qPCR was performed using SYBR® Premix Ex TaqTM (Takara, Bio, Inc., Shiga,
Japan) on an ABI 7500 Fast Real-Time PCR system (PE Applied Biosystems, Foster City, CA, USA) to confirm the relative expression levels of the genes in the control, Gb3 and lyso-Gb3 groups. RNA was reverse transcribed using the High Capacity cDNA Archive kit (Applied Biosystems). The total volume of the PCR reaction was 20 µl, containing 0.8 µl of each primer (5 µM), 1 µl cDNA, 10 µl 2X SYBR® Premix
Ex Taq™ II, 0.4 µl Rox dye and 7.8 µl sterile ddH2O. PCR
cycling conditions were as follows: Initial 30 sec denatur-ation at 95˚C, followed by 40 cycles of amplificdenatur-ation at 95˚C for 3 sec and 60˚C for 30 sec, and a subsequent melting curve analysis, where the temperature was increased from 60 to
95˚C. In order to quantify each candidate gene expression, the mRNA expression levels were normalized to the GAPDH mRNA level. Relative gene expression was analyzed using the comparative cycle threshold (Ct) method (2‑ΔΔCt) (14).
RT-qPCR was performed in triplicate for each sample and was repeated three times for each assay.
Western blot analysis. The Gb3- or lyso-Gb3-treated cells
were washed with ice-cold phosphate-buffered saline and resuspended in PRO-PREP buffer (iNtRON Biotechnology, Inc.) supplemented with phosphatase inhibitor cocktail
solution for 30 min on ice. Insoluble material was removed by centrifugation at 13,000 x g for 20 min at 4˚C. Total protein concentration was determined using bicinchoninic acid assay (Pierce Biotechnology, Inc., Rockford, IL, USA). The protein was electrophoresed on a 10% sodium dodecyl sulfate-polyacrylamide gel, and transferred onto a polyvi-nylidene membrane (EMD Millipore, Billerica, MA, USA). The membrane was blocked with 5% nonfat dry milk in Tris-buffered saline (Elpis Biotech, Inc., Taejeon, Korea) containing 0.1% Tween-20 (TBST; Sigma-Aldrich) for 1 h and then incubated overnight at 4˚C with anti‑WT1 polyclonal Table I. Gene expression patterns in SV40 MES 13 cells treated with Gb3 or lyso-Gb3.
Fold change
---Gene symbol GenBank ID Gene name Gb3 Lyso-Gb3
Cytoskeleton
FSCN2 NM_172802 Fascin homolog 2, actin-bundling 15.97 -1.74
protein, retinal
NCKAP1L NM_153505 Hematopoietic protein 1 5.91 6.72
VIL1 NM_009509 Villin 1 3.57 1.51
EGF NM_010113 Epidermal growth factor 2.10 -1.35
SCIN NM_009132 Scinderin 2.10 -1.50
Extracellular matrix
MMP9 NM_013599 Matrix metalloproteinase 9 5.59 -1.13
COL4A3 NM_007734 Collagen, type IV, alpha 3 2.77 -1.33
(Goodpasture antigen)
COL15A1 NM_009928 Collagen, type XV, alpha 1 2.29 2.61
NTN4 NM_021320 Netrin 4 2.44 1.84
RELN NM_011261 Reelin precursor -1.08 27.84
IMPG2 NM_174876 Interphotoreceptor matrix -2.34 -4.13
proteoglycan 2
KERA NM_008438 Keratocan -3.39 -11.52
Cell proliferation/differentiation
PRM2 NM_008933 Protamine 2 22.61 1.49
DNER NM_152915 Delta/notch-like EGF-related 9.12 7.55
receptor
WT1 NM_144783 Wilms' tumor 1 6.36 2.60
FOXP2 NM_053242 Forkhead box P2 2.89 45.68
HOXA11 NM_010450 Homeobox A11 -2.51 -2.19
DLL1 NM_007865 Delta-like 1 -5.14 -6.89
DMRT2 NM_145831 Doublesex and mab-3 related 1 -5.79 3.05
transcription factor 2 isoform Cell migration
CYBB NM_007807 Cytochrome b-245, beta polypeptide 8.20 2.36
ISL1 NM_021459 ISL1 transcription factor, 6.27 1.08
LIM/homeodomain (islet 1)
TNF NM_013693 Tumor necrosis factor alpha 4.72 1.57
NM_009382 Thymus cell antigen 1, theta 1.32 16.51
PRRXL1 NM_001001796 Paired related homeobox protein-like 1 -1.76 -5.97
F8 NM_007977 Coagulation factor VIII -2.90 -3.33
antibody (cat. no. sc-192; Santa Cruz Biotechnology, Inc., Santa Cruz, CA, USA). The primary antibody was removed, and the blots were washed three times with TBST and then incubated for 1 h at room temperature with goat anti-rabbit IgG (cat. no. sc-2054; Santa Cruz Biotechnology, Inc.) as the secondary antibody. Following removal of the secondary antibody, the blots were washed and the specific bands were detected using enhanced chemiluminescence with a WestSave GOLDTM Western Blot Detection kit (AbFronteir,
Seoul, Korea), according to the manufacturer's instructions. All signals were analyzed using densitometric scanning (LAS‑3000; Fujifilm, Tokyo, Japan).
Statistical analysis. The values are presented as either the
mean ± standard deviation or ± standard error of the mean. Data were analyzed using Prism 4.0 software (GraphPad Software. Inc., La Jolla, CA, USA). The significance of differ-ences between groups was determined using Student's t-test. P<0.05 was considered to indicate a statistically significant difference.
Results
Gene expression profile from microarrays of SV40 MES 13 mesangial cells and HK‑2 tubular epithelial cells. The present
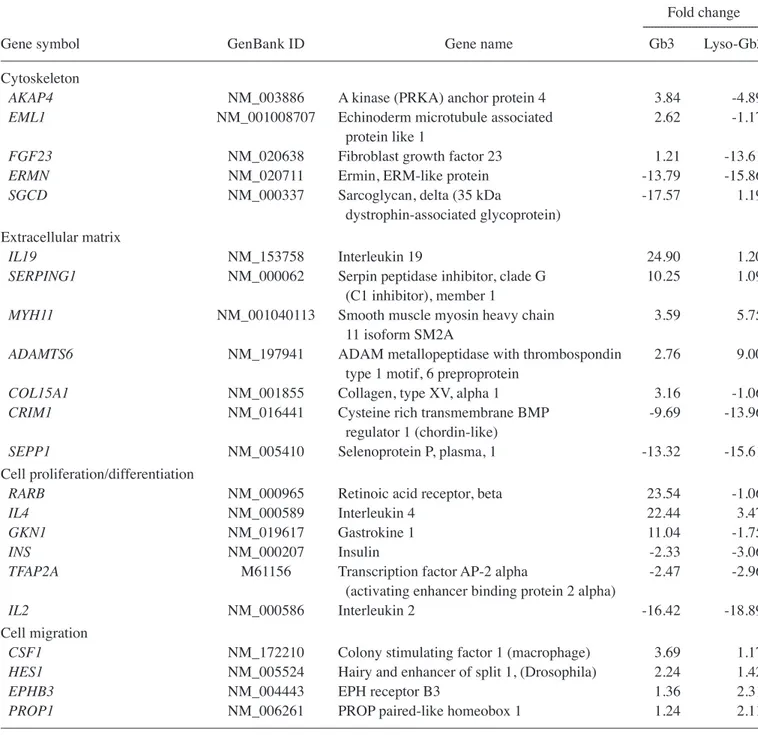
Table II. Gene expression patterns in HK-2 cells treated with Gb3 or lyso-Gb3.
Fold change
---Gene symbol GenBank ID Gene name Gb3 Lyso-Gb3
Cytoskeleton
AKAP4 NM_003886 A kinase (PRKA) anchor protein 4 3.84 -4.89
EML1 NM_001008707 Echinoderm microtubule associated 2.62 -1.17
protein like 1
FGF23 NM_020638 Fibroblast growth factor 23 1.21 -13.61
ERMN NM_020711 Ermin, ERM-like protein -13.79 -15.86
SGCD NM_000337 Sarcoglycan, delta (35 kDa -17.57 1.19
dystrophin-associated glycoprotein) Extracellular matrix
IL19 NM_153758 Interleukin 19 24.90 1.20
SERPING1 NM_000062 Serpin peptidase inhibitor, clade G 10.25 1.09
(C1 inhibitor), member 1
MYH11 NM_001040113 Smooth muscle myosin heavy chain 3.59 5.75
11 isoform SM2A
ADAMTS6 NM_197941 ADAM metallopeptidase with thrombospondin 2.76 9.00
type 1 motif, 6 preproprotein
COL15A1 NM_001855 Collagen, type XV, alpha 1 3.16 -1.06
CRIM1 NM_016441 Cysteine rich transmembrane BMP -9.69 -13.96
regulator 1 (chordin-like)
SEPP1 NM_005410 Selenoprotein P, plasma, 1 -13.32 -15.61
Cell proliferation/differentiation
RARB NM_000965 Retinoic acid receptor, beta 23.54 -1.06
IL4 NM_000589 Interleukin 4 22.44 3.47
GKN1 NM_019617 Gastrokine 1 11.04 -1.75
INS NM_000207 Insulin -2.33 -3.06
TFAP2A M61156 Transcription factor AP-2 alpha -2.47 -2.96
(activating enhancer binding protein 2 alpha)
IL2 NM_000586 Interleukin 2 -16.42 -18.89
Cell migration
CSF1 NM_172210 Colony stimulating factor 1 (macrophage) 3.69 1.17
HES1 NM_005524 Hairy and enhancer of split 1, (Drosophila) 2.24 1.42
EPHB3 NM_004443 EPH receptor B3 1.36 2.31
PROP1 NM_006261 PROP paired-like homeobox 1 1.24 2.11
study examined the gene expression profiles in the kidney cells following treatment with Gb3 or lyso-Gb3 (Table. I and II). If the gene expression value was upregulated or downregu-lated >2-fold, compared with the control group, the change was considered to be significant.
SV40 MES 13 cells. A total of 39,429 genes were detected in
the SV40 MES 13 cells, of which 2,991 were significant. The majority of the upregulated genes were associated with ‘ECM’, ‘cell migration,’ ‘cell differentiation’ or ‘immune response’. The majority of the of the downregulated genes were asso-ciated with ‘ECM’, ‘immune response’ or ‘cell migration’ (Fig. 1A and B).
HK‑2 cells. A total of 34,127 genes were detected in the HK-1
cells, of which 1,141 were identified as either significantly upregulated or downregulated. The majority of the upregulated genes were associated with ‘ECM’, ‘cell differentiation,’ ‘cell migration’ or ‘immune response’. The majority of the down-regulated genes were associated with ‘cell migration’, ‘cell death’, ‘cell differentiation’ or ‘immune response’ (Fig. 1C and D).
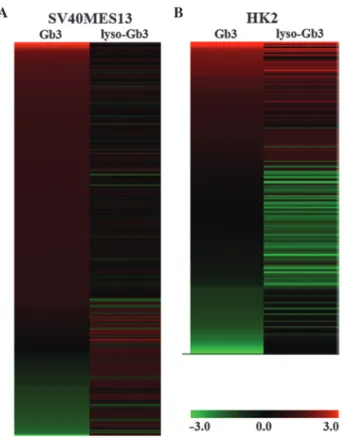
Hierarchical clustering analysis. Hierarchical clustering
anal-ysis revealed that, following treatment of the SV40 MES 13 cells and HK-2 cells with Gb3 or lyso-Gb3, the change in gene expression was dependant on the cell type and substrate (Fig. 2). In the SV40 MES 13 cells treated with Gb3, the
Figure 1. Gene ontology analyses based on microarray data using DAVID Bioinformatics Resources 6.7. Gene ontology profile in SV40 MES 13 cells treated with (A) Gb3 or (B) lyso-Gb3, and in HK-2 cells treated with (C) Gb3 or (D) lyso-Gb3. The number of upregulated or downregulated genes in each group among the total of significantly regulated genes is expressed as the ratio (%) of the Gb3‑treated, vs. control cells or lyso‑Gb3‑treated, vs. control cells. Gb3, globo-triaosylceramide; lyso-Gb3, deacylated Gb3.
Figure 2. Hierarchical clustering analysis. Comparison of gene expression pat-terns in kidney cells treated with either Gb3 or lyso-Gb3. (A) SV40 MES 13 cells and (B) HK-2 cells. Expression levels are indicated by color coding, in which red represents upregulation and green represents downregulation. Gb3, globotriaosylceramide; lyso-Gb3, deacylated Gb3.
A B
C D
majority of the significantly altered genes were upregulated, however, their corresponding gene expression patterns were different following treatment with lyso-Gb3 (Fig. 2A). In the HK-2 cells, the gene expression pattern was more stable, compared with than that observed in the SV40 MES 13 cells (Fig. 2B), although the patterns differed between treatments with Gb3 and lyso-Gb3. In contrast to the SV40 MES 13 cells treated with Gb3, the majorit of the significantly altered genes in the HK-2 cells were upregulated following treatment with lyso-Gb3.
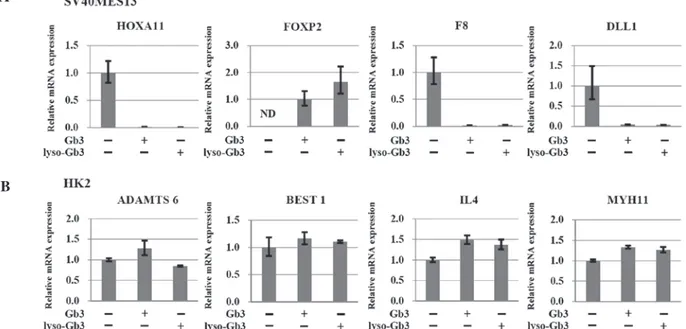
Validation of gene expression patterns in the cell models using RT‑qPCR. To confirm the microarray-predicted
expression patterns, the present study performed RT-qPCR to analyze the candidate genes. The ‘target’ genes, which presented with relatively consistent patterns in the micro-array and RT-qPCR, including IL4, MYH11, ADAMTS6,
BEST1, FOXP2, F8, HOXA11, DLL1 and WT1 were
identi-fied. In the SV40 MES 13 mesangial cells treated with Gb3 or lyso-Gb3, the expression of FOXP2 was upregulated and the expression levels of HOXA11, F8 and DLL1 were downregulated, compared with the control cells (Fig. 3A). In the HK-2 epithelial cells, the mRNA expression levels of
ADAMTS6, BEST1, IL4 and MYH11 were upregulated in the
Gb3- and lyso-Gb3-treated epithelial cells, compared with the control cells (Fig. 3B).
Validation of gene expression in kidney tissues. The present
study also examined the expression levels of FOXP2,
COL15A1, MYH11 and IL4 in kidney tissues from wild-type
and Fabry mice (Fig. 4). Compared with the wild-type tissues, the expression levels of COL15A1, IL4 and MYH11 were significantly upregulated in the Fabry mouse kidney tissues.
No significant upregulation in the expression of FOXP2 was observed in the Fabry mouse kidney (P=0.059).
Expression of WT1 in the cell models. To further confirm the
patterns of gene expression identified in the present study, immunoblotting of the protein encoded by the WT1 gene was performed. The protein expression of WT1 was identified in the SV40 MES 13 cells and HK-2 cells following treatment with either Gb3 or lyso-Gb3 (Fig. 5). In agreement with the microarray data, the expression of WT1 was significantly increased in the SV40 MES 13 cells treated with Gb3, compared with the control. However, the expression of WT1 was decreased in SV40 MES 13 cells treated with lyso-Gb3. In the HK-2 cells, the expression of WT1 was increased
Figure 3. RT-qPCR analyses to determine changes in gene expression. (A) RT-qPCR analyses of the HOXA11, FOXP2, F8 and DLL1 genes in SV40 MES 13 cells, and of the (B) ADAMTS6, BEST1, IL4 and MYH11 genes in HK-2 cells. Expression levels of genes in SV40 MES 13 and HK-2 cells treated with Gb3 or lyso-Gb3 were analyzed using RT-qPCR and expressed as a ratio relative to the expression in untreated cells. Data are presented as the mean ± standard error of the mean of at least three experiments. RT-qPCR, reverse transcription-quantitative polymerase chain reaction; Gb3, globotriaosylceramide; lyso-Gb3, deacylated Gb3.
Figure 4. Reverse transcription-quantitative polymerase chain reaction analyses of the FOXP2, COL15A1, IL4, and MYH11 genes in mouse kidney tissues. The gene expression ratios of each gene in the kidneys were com-pared between Fabry mice and wild-type mice. Data are expressed as the mean ± standard error of the mean of at least three experiments. *P<0.05,
wild-type, vs. Fabry tissues. A
marginally when treated with Gb3 or lyso-Gb3, compared with the control.
Discussion
Fabry disease progresses to irreversible tissue damage and organ dysfunction. Among the complications of Fabry disease, renal failure significant contributes to rates of morbidity and mortality. In Fabry nephropathy, glycolipids are deposited in the glomerular cells, articularly in podocytes, mesangial cells and endothelial cells, in tubular epithelial cells of the distal nephron, and in vascular cells, including endothelial cells of the capillaries, veins, arteries and vascular smooth muscle cells (3). Early progressive podocyte injury can lead to podocyte loss and fibrosis, caused by epithelial cell segmental or global glomerulosclerosis, which is a common finding in Fabry nephropathy (15,16), with interstitial fibrosis and tubular atrophy usually observed later.
In the past two decades, the contribution of the EMT to fibrinogenesis has been noted. Therefore, the present study examined whether the renal gene expression profiles in tissues with Fabry disease are associated with the EMT, which is considered to be involved in fibrosis of the kidney. The present study compared the expression patterns of candidate genes in HK-2 tubular epithelial and SV40 MES 13 mesangial cells in response to treatment with Gb3 and lyso-Gb3. Gene ontology analysis revealed that the most significantly altered genes were associated with ‘ECM’, ‘cell migration’, or ‘cell proliferation’ in the two cell types. This result indicated that Gb3 or lyso-Gb3 primarily regulated the expression of genes associated with the EMT in these kidney cells.
Following Gb3 or lyso-Gb3 treatment, BEST1, ADAMTS6,
MYH11 and IL4 were upregulated only in the HK-2 cells, and ADAM18, COL4A3, PDE1C and FOXP2 were upregulated
only in the SV40 MES 13 cells. The expression levels of DLL1,
F8, and HOXA11 were downregulated in the SV40 MES 13
cells, but were unchanged in the HK-2 cells. The gene expres-sion patterns in the SV40 MES 13 and HK-2 cells differed
between the group treated with Gb3 and the group treated with lyso‑Gb3. The gene expression profile of the SV40 MES 13 cells exhibited more marked changes following Gb3 treatment, suggesting that these cells are more sensitive to Gb3, whereas the HK-2 cells appeared to be more sensitive to lyso-Gb3.
In the present study, the expression levels of FOXP2,
COL15A1, IL4 and MYH11 were upregulated in kidney tissues
from Fabry mice. FOXP2 encodes an evolutionarily conserved transcription factor, which is expressed in fetal and adult brains and has been found to act as a transcriptional repressor and be involved in multiple biological processes, including development and immunoregulation (17). The expression of
FOXP2 was upregulated in the epithelial and mesangial cells,
however, its expression in the mesangial cells exceeded that in the epithelial cells and was sensitive to lyso-Gb3 treatment. Upregulation of COL15A1 was observed in the SV40 MES 13 and HK-2 cells, with the exception of the HK-2 cells treated with lyso-Gb3. The expression of COL15A1 is closed asso-ciated with the fibrotic process in the kidney (18). Renal interstitial type XV collagen staining in patients with kidney fibrosis is pronounced due to these fibrotic changes (18).
Interleukin-4 (IL-4) is a ligand for the IL-4 receptor and mediates its numerous functions by binding to recep-tors expressed on target cells. IL4 has been implicated in the pathogenesis of experimental and human glomerulone-phritis (19). Aberrant multi-organ expression of IL4, including in the kidney, causes progressive glomerulosclerosis leading to end-stage renal failure. Renal expression of IL‑4 leads to increased ECM production and alters the glomerular struc-ture, possibly by promoting immunoglobulin (Ig) deposition, and upregulation of the renal expression of TGF-β1 following glomerular Ig deposition accelerates sclerosis and exacerbates disease development (20). The present study observed that the expression of IL4 was upregulated in epithelial cells and was activated significantly by Gb3 treatment.
MYH11 encodes a smooth muscle myosin belonging to
the myosin heavy chain family, and mutation of MYH11 has been reported to increase TGF-β signaling in familial thoracic
Figure 5. (A) Western blot analysis of the expression of WT1 in SV40 MES 13 and HK-2 cells treated with Gb3 or lyso-Gb3. (B) Expression levels of WT1 in the two cell types treated with Gb3 or lyso-Gb3 were compared with that of untreated cells. Data are expressed as the mean ± standard error of the mean (n=3). Gb3, globotriaosylceramide; lyso-Gb3, deacylated Gb3.
A
aortic aneurysm/dissection (21). In the present study, the expression of MYH11 was upregulated in epithelial cells and downregulated in mesangial cells. The expression of MYH11 was also upregulated more in the kidney tissues of Fabry mice, compared with those from wild-type mice. WT1 acts as an activator or a repressor of target genes, depending on the cell type and target gene with which WT1 interacts. It is well known that WT1 is critical during embryogenesis, despite the expression pattern of WT1 being highly complex (22,23). Following birth, terminally differentiated cells, including epithelial tubular cells do not exhibit WT1 expression, whereas cells with the potential for EMT, including podocytes, continue to produce WT1 (23,24). WT1 can be found outside podocytes, including mesangial cells, in diabetic nephropathy or endothelial cells (25,26). In the present study, the expression of WT1 in SV40 MES 13 mesangial cells was upregulated by Gb3, but was downregulated by lyso-Gb3. By contrast, the expression of WT1 was weak in the HK-2 epithelial cells and was marginally upregulated by either Gb3 or lyso-Gb3. This result suggested that WT1 may be involved in the progression of fibrosis in kidney cells in Fabry disease.
Lyso-Gb3 has been reported as a major bioactive molecule in Fabry disease, and may promote the release of secondary mediators of glomerular injury, including diabetic nephrop-athy and disease manifestations. Lyso-Gb3 may activate target tissue cells, including podocytes (4,6). Although intracellular Gb3 accumulation throughout the body has traditionally been ascribed as a major cause of pathogenesis in Fabry disease, serum levels of Gb3 and Gb3 deposits do not necessarily correlate with clinical manifestations (5). Lyso-Gb3 is asso-ciated with vascular smooth muscle cell proliferation and induces podocytes to produce mediators of glomerular injury, including TGF-β1, a critical mediator of ECM production, fibrosis and podocyte injury (4,5,27).
In conclusion, to identify biomarkers of the EMT, which may be critical in renal fibrosis and end‑stage renal disease, the present study performed microarray analysis of epithe-lial and mesangial cells, to compare the effects of Gb3 and lyso-Gb3 treatment in models of Fabry disease. The micro-array results suggested that the gene expression patterns in kidney cells are cell specific and substrate specific. Despite the relatively high Gb3 and lyso-Gb3 concentra-tions in plasma and kidneys, these levels did not reflect overt pathology or clinical manifestations, which suggested that glycolipids are involved in determining the target tissue or cell‑specific pattern. The present study hypothesized that Gb3 and lyso‑Gb3 themselves are not specific biomarkers for the diagnosis of Fabry disease, but each appears to have a specific role and time course in relation to cell activation, disease progression and clinical manifestations. Further investigation is required to determine the precise mecha-nisms through which Gb3 and lyso-Gb3 contribute to the progression of fibrosis, and the potential roles of biomarkers of the EMT in different cell types.
Acknowledgements
This study was supported by grants from the Health Technology R&D project (grant. no. HI12C0598) of the Ministry of Health and Welfare, Republic of Korea.
References
1. Brady RO, Gal AE, Bradley RM, Martensson E, Warshaw AL and Laster L: Enzymatic defect in Fabry's disease. Ceramidetrihexosidase deficiency. N Engl J Med 276: 1163‑1167, 1967.
2. Kint JA: The enzyme defect in Fabry's disease. Nature 227: 1173, 1970.
3. Densick RJ, Ioannou YA and Eng CM: Alpha-galactosidase A deficiency: Fabry disease. In: The Metabolic and Molecular Bases of Inherited Disease. (8th ed.) Scriver, CR, Beaudet AL, Sly WS, Valle D (ed.). McGraw-Hill, New York. pp3733-3774, 2001. 4. Weidemann F, Sanchez-Niño MD, Politei J, Oliveira JP,
Wanner C, Warnock DG and Ortiz A: Fibrosis: A key feature of Fabry disease with potential therapeutic implications. Orphanet J Rare Dis 8: 116, 2013.
5. Aerts JM, Groener JE, Kuiper S, Donker-Koopman WE, Strijland A, Ottenhoff R, van Roomen C, Mirzaian M, Wijburg FA, Linthorst GE, et al: Elevated globotriaosylsphin-gosine is a hallmark of Fabry disease. Proc Natl Acad Sci USA 105: 2812-2817, 2008.
6. Sanchez-Niño MD, Sanz AB, Carrasco S, Saleem MA, Mathieson PW, Valdivielso JM, Ruiz-Ortega M, Egido J and Ortiz A: Globotriaosylsphingosine actions on human glomerular podocytes: Implications for Fabry nephropathy. Nephrol Dial Transplant 26: 1797-1802, 2011.
7. Campanholle G, Ligresti G, Gharib SA and Duffield JS: Cellular mechanisms of tissue fibrosis. 3. Novel mechanisms of kidney fibrosis. Am J Physiol Cell Physiol 304: C591‑C603, 2013. 8. Iredale JP: Models of liver fibrosis: Exploring the dynamic nature
of inflammation and repair in a solid organ. J Clin Invest 117: 539-548, 2007.
9. Zeisberg M and Neilson EG: Mechanisms of tubulointerstitial fibrosis. J Am Soc Nephrol 21: 1819‑1834, 2010.
10. Iwano M, Plieth D, Danoff TM, Xue C, Okada H and Neilson EG: Evidence that fibroblasts derive from epithelium during tissue fibrosis. J Clin Invest 110: 341‑350, 2002.
11. Zeisberg EM, Potenta SE, Sugimoto H, Zeisberg M and Kalluri R: Fibroblasts in kidney fibrosis emerge via endothelial‑to‑mesen-chymal transition. J Am Soc Nephrol 19: 2282-2287, 2008. 12. Ohshima T, Murray GJ, Swaim WD, Longenecker G, Quirk JM,
Cardarelli CO, Sugimoto Y, Pastan I, Gottesman MM, Brady RO, et al: α‑Galactosidase A deficient mice: a model of Fabry disease. Proc Natl Acad Sci USA 94: 2540-2544, 1997.
13. National Research Council (US) Committee for the Update of the Guide for the Care and Use of Laboratory Animals. Guide for the Care and Use of Laboratory Animals, 8th edition. Washington (DC): National Academies Press (US), 2011.
14. Schefe JH, Lehmann KE, Buschmann IR, Unger T and Funke-Kaiser H: Quantitative real-time RT-PCR data analysis: Current concepts and the novel "gene expression's CT difference" formula. J Mol Med 84: 901-910, 2006.
15. Gubler MC, Lenoir G, Grünfeld JP, Ulmann A, Droz D and Habib R: Early renal changes in hemizygous and heterozygous patients with Fabry's disease. Kidney Int 13: 223-235, 1978. 16. Fogo AB, Bostad L, Svarstad E, Cook WJ, Moll S, Barbey F,
Geldenhuys L, West M, Ferluga D, Vujkovac B, et al: Scoring system for renal pathology in Fabry disease: report of the International Study Group of Fabry Nephropathy (ISGFN). Nephrol Dial Transplant 25: 2168-2177, 2010.
17. Konopka G, Bomar JM, Winden K, Coppola G, Jonsson ZO, Gao F, Peng S, Preuss TM, Wohlschlegel JA and Geschwind DH: Human‑specific transcriptional regulation of CNS development genes by FOXP2. Nature 462: 213-217, 2009.
18. Hägg PM, Hägg PO, Peltonen S, Autio-Harmainen H and Pihlajaniemi T: Location of type XV collagen in human tissues and its accumulation in the interstitial matrix of the fibrotic kidney. Am J Pathol 150: 2075-2086, 1997.
19. Furusu A, Miyazaki M, Koji T. Abe K, Ozono Y, Harada T, Nakane PK, Hara K and Kohno S: Involvement of IL-4 in human glomerulonephritis: an in situ hybridization study of IL-4 mRNA and IL-4 receptor mRNA. J Am Soc Nephrol 8: 730-741, 1997. 20. Rüger BM, Hasan Q, Erb KJ and Davis PF: Progression of renal
disease in interleukin-4 transgenic mice: involvement of trans-forming growth factor-beta. Int J Exp Pathol 80: 113-123, 1999. 21. Renard M, Callewaert B, Baetens M, Campens L, MacDermot K,
Fryns JP, Bonduelle M, Dietz HC, Gaspar IM, Cavaco D, et al: Novel MYH11 and ACTA2 mutations reveal a role for enhanced TGFβ signaling in FTAAD. Int J Cardiol 165: 314-321, 2011.
22. Pritchard-Jones K, Fleming S, Davidson D, Bickmore W, Porteous D, Gosden C, Bard J, Buckler A, Pelletier J and Housman D: The candidate Wilms' tumour gene is involved in genitourinary development. Nature 346: 194-197, 1990.
23. Buckler AJ, Pelletier J, Haber DA, Glaser T and Housman DE: Isolation, characterization and expression of the murine Wilms' tumor gene (WT1) during kidney development. Mol Cell Biol 11: 1707-1712, 1991.
24. Grubb GR, Yun K, Williams BR, Eccles MR and Reeve AE: Expression of WT1 protein in fetal kidneys and Wilms tumors. Lab Invest 71: 472-479, 1994.
25. Brunskill EW and Potter SS: Changes in the gene expression programs of renal mesangial cells during diabetic nephropathy. BMC Nephrol 13: 70, 2012.
26. Mrowka C and Schedl A: Wilms' tumor suppressor gene WT1: from structure to renal pathophysiologic features. J Am Soc Nephrol 11 (Suppl 16): S106-S115, 2000.
27. Hills CE and Squires PE: The role of TGF-β and epithelial-to mesenchymal transition in diabetic nephropathy. Cytokine Growth Factor Rev 22: 131-139, 2011.