Korean J Pediatr 2019;62(2):55-61
Genotype-phenotype correlations in pediatric
patients with myotonic dystrophy type 1
Hyeong Jung Kim, MD, Ji-Hoon Na, MD, Young-Mock Lee, MD, PhD
Department of Pediatrics, Yonsei University College of Medicine, Seoul, Korea
Copyright © 2019 by The Korean Pediatric Society This is an open-access article distributed under the terms of the Creative Commons Attribution Non-Commercial License (http://creativecommons.org/ licenses/by-nc/4.0/) which permits unrestricted non-commercial use, distribution, and reproduction in any medium, provided the original work is properly cited. Korean J Pediatr 2019;62(2):55-61
https://doi.org/10.3345/kjp.2018.06919 pISSN 1738-1061•eISSN 2092-7258
Purpose: Myotonic dystrophy, also known as dystrophia myotonica (DM), is an autosomal dominant disorder with 2 genetically distinct forms. DM type 1 (DM1) is the more common form and is caused by abnormal expansion of cytosine/thymine/guanine (CTG) repeats in the DM protein kinase (DMPK ) gene. Our study aimed to determine whether the age of onset is correlated with CTG repeat length in a population of pediatric patients with DM1.
Methods: We retrospectively identified 30 pediatric patients with DM1 that underwent DMPK testing, of which the clinical data of 17 was sufficient. The cohort was divided into 2 subgroups based on the clinical phenotype (congenital-onset vs. late-onset) and number of CTG repeats (<1,000 vs. ≥1,000).
Results: We found no significant difference between the age of onset and CTG repeat length in our pediatric patient population. Based on clinical subgrouping, we found that the congenital-onset subgroup was statistically different with respect to several variables, including prematurity, rate of admission to neonatal intensive care unit, need for respiratory support at birth, hypotonia, dysphagia, ventilator dependence, and functional status on last visit, compared to the late-onset subgroup. Based on genetic subgrouping, we found a single variable (poor feeding in neonate) that was significantly different in the large CTG subgroup than that in the small CTG subgroup.
Conclusion: Clinical variables exhibiting statistically significant differences between the subgroups should be focused on prognosis and designing tailored management approaches for the patients; our findings will contribute to achieve this important goal for treating patients with DM1.
Key words: Myotonic dystrophy type 1, Genotype, Phenotype, CTG repeat, Age of onset
Introduction
Myotonic dystrophy (also known as dystrophia myotonica; DM) is an autosomal dominant disorder characterized by muscular dystrophy, myotonia, cataract, hypogonadism, and cardiac conduction disorders. It is classified into 2 types, DM type 1 (DM1) and DM type 2 (DM2), based on the causative genetic mutation1); DM1 is more severe and common with an estimated
prevalence of 1 in 8,000.2,3)
Although diagnosis can be made on the basis of several symptoms, it is often difficult to confirm the diagnosis, solely based on clinical symptoms, in mild cases.4) For such instances,
direct analysis of the cytosine/thymine/guanine (CTG) trinucleotide repeat in the 3' untranslat ed region of myotonic dystrophy protein kinase (DMPK) gene on chromosome 19 by Southern blotting enables a reliable diagnosis,5) since DM1 is known to result from an abnormal number
of CTG repeats.2,6)
Severity of DM1 varies with the number of CTG repeats.6,7) While mildly affected patients
have 50–150 repeats, patients with classic DM1 have 100–1,000 repeats, and those with the congenital form of the disease have >2,000 repeats.2,8,9) However, due to insufficient number of
Corresponding author: Young-Mock Lee, MD, PhD Department of Pediatrics, Yonsei University College of Medicine, 211 Eonju-ro, Gangnam-gu, Seoul 06273, Korea Tel: +82-2-2019-3350 Fax: +82-2-2019-4881 E-mail: [email protected] https://orcid.org/0000-0002-5838-249X Received: 28 August, 2018 Revised: 18 September, 2018 Accepted: 20 September, 2018 Korean J Pediatr
CTG” subgroup included individuals with >1,000 CTG repeats while the “small CTG” subgroup consisted of individuals with <1,000 CTG repeats. Currently, the most widely known classification of disease severity based on CTG repeats is as follows: normal individuals (5– 37 repeats), mildly affected patients (50–150 repeats), patients with classic DM1 (100–1,000 repeats), and patients with congenital DM1 (>2,000 repeats). As stated earlier, there is no established cutoff val ue or classification standard for the distribution of the patients according to CTG repeat length, especially over 1,000–2,000 repeats. Since 23% of patients had congenital DM1, possessing 1,000–2,000 repeats of the CTG trinucleotide, in our patient group, we set >1,000 repeats as the threshold for classification of congenital DM1 in our cohort.
3. Statistics
All analyses were conducted using IBM SPSS Statistics ver. 20.0 (IBM Co., Armonk, NY, USA). We used Fisher exact test to calculate P values between each set of subgroups. Spearman rank correlation was used to identify whether there was a relationship between length of the CTG repeat region and age of onset, whereas the Mann Whitney U test was used to compare time periods between birth, symptom onset, and diagnosis. A P value of <0.05 was considered statistically significant.
patients, investigation of various hypotheses regarding diagnostic tools and treatment of DM1 has been limited. In fact, there is currently no established cutoff value or classification standard for the distribution of patients, genetically diagnosed with DM1, according to CTG repeat length.
Thus, our aim was to determine whether a correlation between severity of clinical phenotype and length of the CTG repeat region could be established for better classification of the disease in affected individuals.
Materials and methods
1. Patient group
We identified 30 patients with DM1, who were followed up in 2 centers of our hospital (Gangnam Severance Hospital and Severance Children’s Hospital), through a retrospective study (Fig. 1). All participants were diagnosed with DM1 by genetic testing of DMPK from November 2005 to June 2017. Thirteen patients were excluded from the study due to poor clinical data. Our final cohort of 17 pati ents with DM1 had sufficient clinical data, including clinical symp toms, age of onset, previous history, length of CTG repeat, labo ratory and radiological findings, and followup data. Institutional Review Board, Gangnam Severance Hospital, Yonsei University College of Medicine (approval number: 320170263) and written informed consent was obtained from the parents or legal guardians of all patients.
2. Subgroup analysis
We derived 2 different sets of subgroups for intergroup compari son based on 2 criteria, clinical and genetic. In clinical subgrouping, patients were classified based on the onset time of symptoms; the ones whose symptoms appeared within one month formed the con genitalonset subgroup while the others with later onset of symp toms formed the lateonset subgroup. In genetic subgrouping, pati ents were classified based on the number of CTG repeats. The “Large
Patients with myotonic dystrophy 1 (n=30)
Mutation of DMPK gene (Reported in Nov. 2005–Junbe. 2017)
Patients with sufficient clinical data (n=17)
Including size of repeated CTG, clinical symptoms, age of onset, hisotry, laboratory/radiologic finding, and follow-up data
Lack of clinical data (n=13)
Genotype-phenotype correlation
Clinical subgrouping
Congenital-onset (n=10) vs. late-onset (n=7)
Genetic subgrouping
Larger CTG (n=9) vs. smaller CTG (n=8)
Fig. 1. Subgroup analysis of patients with myotonic dystrophy. CTG,
cytosine/thymine/guanine.
Table 1. Demographic characteristics of patients with myotonic
dystrophy (n=17)
Variable Value
Sex
Male 12 (70.6)
Female 5 (29.4)
Time period between birth, symptom onset, and genetic diagnosis (yr)
From birth to symptom onset 4.1±5.8
From symptom onset to diagnosis 1.6±2.7
From birth to diagnosis 5.7±7.3
Age of onset
Neonate (<1 mo) 10 (58.8)
Infant and older (≥1 mo) 7 (41.2)
<5 yr 1/7 (14.3) 5–10 yr 3/7 (42.9) 10–15 yr 3/7 (42.9) CTG repeat length 100–500 5 (29.4) 500–1,000 3 (17.6) 1,000–2,000 4 (23.5) ≥2,000 5 (29.4)
Values are presented as number (%) or mean±standard deviation. CTG, cytosine/thymine/guanine.
Results
1. Demographics
Our cohort consisted of 12 male (70.6%) and 5 female patients (29.4%) (Table 1). The time period from diagnosis to onset of symptoms was 1.6±2.7 years, and that from birth to onset was 4.1± 5.8 years. Ten patients were found to have congenitalonset DM1 whose symp toms manifested within 1 month from birth, 7 were found to be lateonset patients whose symptoms manifested after 1 month from birth. We observed a varied distribution in the number of patients classified according to CTG trinucleotide repeat length, but there was no correlation between age of onset and length of CTG repeat in our pediatric patient population. However, there was a nonsignificant ten dency towards an inverse relationship on scatter
plot (Correlation coeffi cient=0.194, P=0.384). 2. Clinical subgrouping
1) General characteristics and clinical manifestations
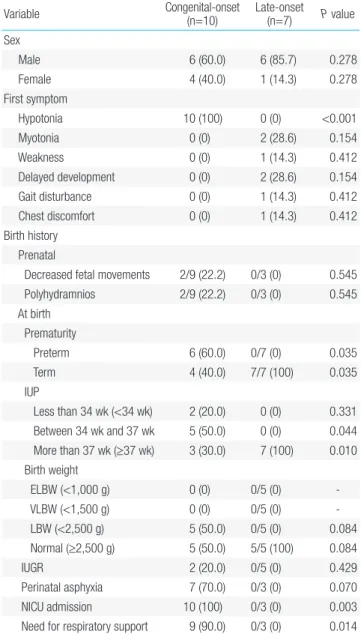
As shown in Table 2, among our clinically derived subgroups, the sex ratio was 6 male (60.0%) to 4 female patients (40.0%) in the con genitalonset subgroup and 6 male (85.7%) to 1 female patient (14.3 %) in the lateonset subgroup. This difference in sex distribution was, however, not statistically significant. The first symptom to manifest
Table 2. General characteristics and clinical manifestations of patients
with myotonic dystrophy based on clinical subgrouping (n=17) Variable Congenital-onset (n=10) Late-onset (n=7) P value
Sex Male 6 (60.0) 6 (85.7) 0.278 Female 4 (40.0) 1 (14.3) 0.278 First symptom Hypotonia 10 (100) 0 (0) <0.001 Myotonia 0 (0) 2 (28.6) 0.154 Weakness 0 (0) 1 (14.3) 0.412 Delayed development 0 (0) 2 (28.6) 0.154 Gait disturbance 0 (0) 1 (14.3) 0.412 Chest discomfort 0 (0) 1 (14.3) 0.412 Birth history Prenatal
Decreased fetal movements 2/9 (22.2) 0/3 (0) 0.545 Polyhydramnios 2/9 (22.2) 0/3 (0) 0.545 At birth Prematurity Preterm 6 (60.0) 0/7 (0) 0.035 Term 4 (40.0) 7/7 (100) 0.035 IUP Less than 34 wk (<34 wk) 2 (20.0) 0 (0) 0.331 Between 34 wk and 37 wk 5 (50.0) 0 (0) 0.044 More than 37 wk (≥37 wk) 3 (30.0) 7 (100) 0.010 Birth weight ELBW (<1,000 g) 0 (0) 0/5 (0) VLBW (<1,500 g) 0 (0) 0/5 (0) LBW (<2,500 g) 5 (50.0) 0/5 (0) 0.084 Normal (≥2,500 g) 5 (50.0) 5/5 (100) 0.084 IUGR 2 (20.0) 0/5 (0) 0.429 Perinatal asphyxia 7 (70.0) 0/3 (0) 0.070 NICU admission 10 (100) 0/3 (0) 0.003
Need for respiratory support 9 (90.0) 0/3 (0) 0.014
Table 2. General characteristics and clinical manifestations of patients
with myotonic dystrophy based on clinical subgrouping (n=17) (Contiuned)
Variable Congenital-onset (n=10) Late-onset (n=7) P value
Family history
History of muscular disease 6 (60.0) 4 (57.1) 0.646 Time period between birth, symptom
onset, and genetic diagnosis (yr)
From birth to symptom onset 0.1 (0.1–0.1) 9.9 (1.2–14.9) <0.001 From symptom onset to diagnosis 0.1 (0.1–1.7) 2.0 (0.1–10.5) 0.007 From birth to diagnosis 0.1 (0.1–1.7) 15.0 (4.5–20.4) <0.001 Systemic involvements
Head and neck
Cataract 0/10 (0) 1/7 (14.3) 0.412
Cardiac
Arrhythmia 0/10 (0) 1/7 (14.3) 0.412
Gastrointestinal
Poor feeding in neonate 8/10 (80.0) 2/7 (28.6) 0.052 Dysphagia 8/10 (80.0) 1/7 (14.3) 0.015 Intestinal pseudo-obstruction 0/10 (0) 0/7 (0)
Cholelithiasis 0/10 (0) 0/7 (0)
Respiratory
Congenital respiratory distress 6 (60.0) 0 (0) 0.035 Muscular
Hypotonia in neonate 10 (100) 1 (14.3) <0.001
Myotonia 4/4 (100) 5/5 (100)
Weakness 6/6 (100) 5/6 (83.3) 0.500
Myotonic discharges on EMG 1/1 (100) 2/5 (40.0) 0.500 Neurologic Delayed development or MR 5/6 (83.3) 5/7 (71.4) 0.563 CTG repeat length (n) 100–500 3 (30.0) 2 (28.6) 0.686 500–1,000 1 (10.0) 2 (28.6) 0.360 1,000–2,000 4 (40.0) 0 (0) 0.088 ≥2,000 2 (20.0) 3 (42.9) 0.314
Values are presented as number (%) or median (range).
IUP, intrauterine pregnancy; ELBW, extremely low birth weight; VLBW, very low birth weight; LBW, low birth weight; IUGR, intrauterine growth restriction; NICU, neonatal intensive care unit; EMG, electromyogram; MR, mental retardation; CTG, cytosine/thymine/guanine.
in cases with DM1, though variable, included hypotonia, myotonia, weakness, delayed development, gait disturbance, and chest dis com fort. We found a significant difference in the occurrence of hy poto nia between patients from our clinical subgroups; hypotonia occurred in all patients from the congenitalonset subgroup while it was not at all reported in the lateonset subgroup. Furthermore, we found that birth and family history, including prematurity, neonatal intensive care unit (NICU) admission rate, and need for respiratory support, was significantly dominant in the congenitalonset sub group compared to those in the lateonset subgroup. Prematurity occurred in 60.0% of patients from the congenitalonset subgroup while it occurred in none in the lateonset subgroup (P=0.035); the proportion of NICU admission and need for respiratory support (100% and 90.0%, respectively) in the congenitalonset subgroup was high compared to none in the lateonset subgroup (P=0.003 and P=0.014, respectively). On the other hand, prenatal history, such as decreased fetal movements and polyhydramnios, had no statistically significant difference between the subgroups. We also found that the involved systems were variable and 4 clinical symptoms, specifically poor feeding in neonate, dysphagia, congenital respiratory distress, and hypotonia in neonate, were statisti cally more frequent in the congenitalonset subgroup, with frequencies of 80.0%, 80.0%, 60.0%, and 100%, respectively. Furthermore, CTG repeat distribution in congenital and lateonset subgroups was not significantly different for patients with >2,000 CTG repeats (20.0% vs. 42.9%, respectively), 1,000–2,000 CTG repeats (40.0% vs. 0%, respectively), 500–1,000 CTG repeats (10.0% vs. 28.6%, respectively), and 100–500 CTG repeats (30.0% vs. 28.6%, respectively).
2) Diagnostic evaluation and functional status in the last visit
Although 31.3% of all patients showed increased creatinine kinase (CK), there was no significant difference between the 2 subgroups (Table 3). In addition, abnormal findings in brain MRI were more common in the congenitalonset subgroup compared to that in the lateonset subgroup (85.7% vs. 50.0%, respectively), though not statistically significant. In the last outpatient followup visit, dependence on ventilator was higher in the congenitalonset subgroup compared to that in the lateonset subgroup (50.0% vs. 0%, respectively), whereas the lateonset subgroup had fewer limits (in the mild form) on daily life.
Table 3. Diagnostic evaluation and functional status of patients with
myotonic dystrophy on the last visit based on clinical subgrouping (n=17) Variable Congenital-onset (n=10) Late-onset(n=7) P value
CK level (n=16)
Elevated 4 (40.0) 1/6 (16.7) 0.346
Brain MRI findings (n=11)
Normal 1/7 (14.3) 2/4 (50.0) 0.279
Abnormal 6/7 (85.7) 2/4 (50.0)
-Signal changes of white matter 4/7 (57.1) 1/4 (25.0) 0.348 Atrophy of brain parenchyme 2/7 (28.6) 1/4 (25.0) 0.721 Need for respiratory support (n=17)
Independent 5 (50.0) 7 (100) 0.044
Dependent on ventilator 5 (50.0) 0 (0) 0.044 Activities of daily life (n=17)*
Mild 4 (40.0) 7 (100) 0.035
Moderate 2 (20.0) 0 (0) 0.331
Severe 4 (40.0) 0 (0) 0.103
Values are presented as number (%).
CK, creatinine kinase; MRI, magnetic resonance imaging.
*Mild: ambulatory and/or independent, moderate: WC and/or partially de-pendent, severe: bed-ridden and/or totally dependent.
Table 4. General characteristics and clinical manifestations of patients with myotonic dystrophy based on genetic subgrouping (n=17)
Variable Large CTG(n=9) Small CTG (n=8) P value
Sex Male 6 (66.7) 6 (75.0) 0.563 Female 3 (33.3) 2 (25.0) 0.563 First symptom Hypotonia 6 (66.7) 4 (50.0) 0.419 Myotonia 0 (0) 2 (25.0) 0.206 Weakness 0 (0) 1 (12.5) 0.471 Delayed development 2 (22.2) 0 (0) 0.265 Gait disturbance 1 (11.1) 0 (0) 0.529 Chest discomfort 0 (0) 1 (12.5) 0.471 Birth history Prenatal
Decreased fetal movements 1/6 (16.7) 1/6 (16.7) 0.773
Polyhydramnios 0/6 (0) 2/6 (33.3) 0.227 At birth Prematurity Preterm 5 (55.6) 1 (12.5) 0.088 Term 4 (44.4) 7 (87.5) 0.088 IUP Less than 34 wk (<34 wk) 1 (11.1) 1 (12.5) 0.735 Between 34 wk and 37 wk 4 (44.4) 1 (12.5) 0.183 More than 37 wk (≥37 wk) 4 (44.4) 6 (75.0) 0.218 Birth weight ELBW (<1,000 g) 0/8 (0) 0/7 (0) -VLBW (<1,500 g) 0/8 (0) 0/7 (0) -LBW (<2,500 g) 4/8 (50.0) 1/7 (14.3) 0.182 Normal (≥2,500 g) 4/8 (50.0) 6/7 (85.7) 0.182 IUGR 2/8 (25.0) 0/7 (0) 0.267 Perinatal asphyxia 4/8 (50.0) 3/5 (60.0) 0.587 NICU admission 6/8 (75.0) 4/5 (80.0) 0.685 Need for respiratory support 6/8 (75.0) 3/5 (60.0) 0.510
3. Genetic subgrouping
1) General characteristics and clinical manifestations
As shown in Table 4, there were 6 male (66.7%) and 3 female patients (33.3%) in the large CTG subgroup and 6 males (75.0%) and 1 fe male (25.0%) in the small CTG subgroup. This gender difference was, however, not statistically significant. In contrast to our findings from clinical subgrouping, we found no significant difference between the genetic subgroups for hypotonia as a first symptom, prematurity, NICU admission rate, need for respiratory support,
and several other clinical symptoms. We found hypotonia as a first symptom in 66.7% of patients from the large CTG subgroup and in 50.0% of patients from the small CTG subgroup, whereas the pro portion of premature birth was 55.6% in the large CTG subgroup versus 12.5% in the small CTG subgroup. The proportion of cases requiring NICU admis sion and need for respiratory support was both 75.0% in the large CTG subgroup compared to 80.0% and 60.0%, respectively, in the small CTG subgroup. Poor feeding in neonate was found to be the only symptom that was significantly increased in patients in the large CTG subgroup, compared to that found in the small CTG sub group (88.9% vs. 25.0% respectively, P=0.015).
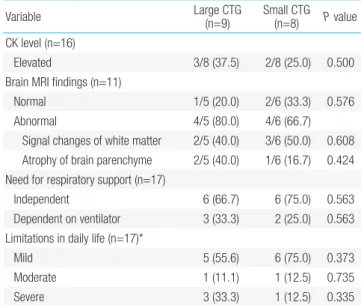
2) Diagnostic evaluation and functional status in the last visit
Similar to our findings from clinical subgroups, we found no sig ni ficant difference in CK level and abnormal findings from brain MRI between the 2 genetically defined subgroups (Table 5). In creased CK levels of 37.5% and 25.0% were found in the large CTG and small CTG subgroups respectively; we also found that 80.0% and 66.7% of patients from these 2 subgroups had abnormal findings in brain MRI. Similarly, we found no significant difference between the genetic subgroups based on ventilator dependence (33.3 % vs. 25.0%, respectively) and quality of daily life (55.6% vs. 75.0%, res pectively).
Discussion
Patients with DM1 do not always present typical symptoms of the Table 4. General characteristics and clinical manifestations of patients
with myotonic dystrophy based on genetic subgrouping (n=17) (Con-tinued)
Variable Large CTG(n=9) Small CTG (n=8) P value
Family history
History of muscular disease 6 (66.7) 4 (50.0) 0.419 Period between birth, symptom
onset, and genetic diagnosis (yr)
From birth to symptom onset 0.1 (0.1–9.9) 4.3 (0.1–14.9) 0.321 From symptom onset to diagnosis 0.1 (0.1–10.5) 0.85 (0.1–2.0) 0.606 From birth to diagnosis 0.1 (0.1–20.4) 5.35 (0.1–16.2) 0.139 Systemic involvements
Head and neck
Cataract 0 (0) 1 (12.5) 0.471
Cardiac
Arrhythmia 0 (0) 1 (12.5) 0.471
Gastrointestinal
Poor feeding in neonate 8 (88.9) 2 (25.0) 0.015
Dysphagia 6 (66.7) 3 (37.5) 0.238
Intestinal pseudo-obstruction 0 (0) 0 (0)
-Cholelithiasis 0 (0) 0 (0)
-Respiratory
Congenital respiratory distress 4 (44.4) 2 (25.0) 0.373 Muscular
Hypotonia in neonate 7 (77.8) 4 (50.0) 0.247
Myotonia 3/3 (100) 6/6 (100)
-Weakness 4/5 (80.0) 7/7 (100) 0.417
Myotonic discharges on EMG 1/1 (100) 2/5 (40.0) 0.088 Neurologic
Delayed development or MR 5/5 (100) 5 (62.5) 0.196 Age of onset
Neonate (<1 mo) 6 (66.7) 4 (50.0) 0.419 Infant and older (≥1 mo) 3 (33.3) 4 (50.0) 0.419
<5 yr 1 (11.1) 0 (0) 0.529
5–10 yr 2 (22.2 1 (12.5) 0.547
10–15 yr 0 (0) 3 (37.5) 0.082
Values are presented as number (%) or mean (range).
IUP, intrauterine pregnancy; ELBW, extremely low birth weight; VLBW, very low birth weight; LBW, low birth weight; IUGR, intrauterine growth restriction; NICU, neonatal intensive care unit; EMG, electromyogram; MR, mental retardation.
Table 5. Diagnostic evaluation and functional status of patients with myotonic dystrophy on the last visit based on genetic subgrouping (n=17) Variable Large CTG (n=9) Small CTG (n=8) P value
CK level (n=16)
Elevated 3/8 (37.5) 2/8 (25.0) 0.500
Brain MRI findings (n=11)
Normal 1/5 (20.0) 2/6 (33.3) 0.576
Abnormal 4/5 (80.0) 4/6 (66.7)
Signal changes of white matter 2/5 (40.0) 3/6 (50.0) 0.608 Atrophy of brain parenchyme 2/5 (40.0) 1/6 (16.7) 0.424 Need for respiratory support (n=17)
Independent 6 (66.7) 6 (75.0) 0.563
Dependent on ventilator 3 (33.3) 2 (25.0) 0.563 Limitations in daily life (n=17)*
Mild 5 (55.6) 6 (75.0) 0.373
Moderate 1 (11.1) 1 (12.5) 0.735
Severe 3 (33.3) 1 (12.5) 0.335
Values are presented as number (%).
CTG, cytosine/thymine/guanine; CK, creatinine kinase; MRI, magnetic reso nance imaging.
*Mild, ambulatory and/or independent; moderate, WC and/or partially depen-dent; severe, bed-ridden and/or totally dependent.
disease, but may show variable symptoms and severities. Variable instability of a CTG trinucleotide repeat in DMPK causes genotypic and phenotypic variation.10) Some studies have included patients
with motor impairments and most patients may have several clinical features like myotonia, muscular weakness, and family history.10,11)
We found variable symptoms in our study cohort as well. However, there have been few studies that subgrouped patients according to age of onset to compare prominent clinical features between groups. One study divided patients into 5 clinical categories (congenital, infantile, juvenile, adultonset, and lateonset) and found that mus cle weakness typically arises earlier in the congenital group, whereas myotonia was the earliest prominent symptom in patients from the infantile group. Early cardiac defects were prominent in ju venile group, whereas secondary symptoms, such as cataract and endo crine disorders, were prominent in the adultonset group.12) Based on
clinical characteristics, we divided our study cohort into 2 groups, congenitalonset and lateonset, and found that there were several variables with statistically significant differences between these 2 cohorts.
In our study, prematurity, NICU admission rate, need for respi ratory support, and hypotonia were important in the early period, while dysphagia, ventilator dependence, and functional status became important in the longterm. A previous study with 169 patients with DM1 had shown that over half the number reported swallowing problems, whose major contributor seemed to be mus cular weakness. Further, researchers found that swallowing ab nor malities may be present even if only a few symptoms were reported, or severity of the disease was not much pronounced.13) Therefore,
serial checkups for swallowing may be warranted in clinical follow up visits for patients with DM1. Furthermore, al though pulmonary function impairment is relatively slow in patients with DM1, com pared to that in patients with other neuromu scular disorders, we need to carefully assess respiratory symptoms and rou tinely perform screening tests since respiratory impair ment is a major cause of death among patients with DM1.14) Therefore, al though all the symp
toms of DM1 are important for such a variable disease, longitudinal monitoring of certain clinical variables is required for affect ed indi viduals.
Individuals with DM1 inherently present a variable genotype that is dependent on the number of CTG repeats in DMPK. In our study, we found that patients exhibited a wide range of CTGrepeat length, ranging from 100 to more than 2,000 repeats. However, on the basis of genetic subgrouping, and in contrast to our finding from clinical subgrouping, we found poor feeding in neonate as the only variable that was statistically significant when compared between the 2 genetically defined subgroups. In contrast, a previous study had shown that patients with DM1 along with muscular weakness or dysfunction of the central nervous system also harbored larger CTG expansions compared to those without either symptom.10)
Fur thermore, many studies have reported that age of onset was in
versely correlated with the CTG repeat length10,11); however, others
argued that the correlation between age of onset and CTG repeat length was only significant for patients with small expansions.15,16)
In our current study, we found no evidence of association between the length of CTG repeats and age of onset, although all of the patients from our cohort were less than 15 years of age. Collectively, these findings demonstrate the challenges involved in genotype phenotype correlations. If age of onset and CTG repeatlength were inversely correlated, we would expect our findings, based on genetic subgrouping, to be similar to that of clinical subgrouping, which had shown evidence of association. Admittedly, in addition to the scarcity of the disease, our findings may not be generalizable due to the small number of patients evaluated, as well as, the fact that they were all under 15 years of age. Nevertheless, we cannot rule out the possibility of having no correlation between these factors at all, or of such associations being populationspecific. In addition, since this is a retrospective study, there may be biases or errors in the medical records that may affect our study outcomes. Thus, further studies are warranted with a larger group of wellcharacterized patients.
Undoubtedly, a genetic approach is important for diagnosis since clinical symptoms of DM are not always specific; however, in reality, most diagnostic approach of DM1 is based on clinical symptoms as well, since it is necessary to make diagnostic estimates using several clues, unless a family history has been determined or confirmatory genetic testing is performed. In other words, clinical suspicion is the first step in diagnosis before confirmatory examinations, such as genetic tests, are performed. De Antonio et al.12) had stated that
age of onset and clinical form may be the key criteria in the design of clinical trials, when considering DM1 health management and research. Similarly, it is important to detect clinical clues from pati ents, including age of onset, and to know what characteristics to look for. Such efforts help in prognosis and preparation of proper management approach tailored for each patient; these could not be achieved simply from the number of CTG repeats.
Since DM1 has variable phenotypes and genotypes, there is no typical natural course or established management guidelines for patients with DM1. Serial examinations to detect newly developed abnormal signs and symptoms, for early treatment, need to be performed. Although some studies have recommended a series of examinations, they are general screening tools that are not based on individual parameters from patients.17,18) For example, annual slit
lamp examination of the lens (cataracts), pulmonary function test (respiratory failture), polysomnography (central/obstructive apnea), electrocardiogram (conduction disorder) and periodic thyroid function test (thyroid dysfunction), echocardiogram or cardiac magnetic resonance imaging (cardiomyopathy) are recommended. Therefore, several studies, such as PhenoDM1,19) are underway to
unravel the natural course of DM1 and achieve better outcomes. It is through these studies that a concrete and distinct protocol for the management of DM1 may be established, and many clinical features
will play an important role in this process.
To summarize, we demonstrate the advantage of evaluating clini cal variables through subgrouping in our small cohort of patients with DM1. Since DM is a rare disease, large prospective studies are difficult to perform; however, more largescale studies are needed to develop individualized management protocols, based on the natural course of the disease and each patient’s clinical characteristics; proper subgroup analyses, as in this study, will contribute to achieve this important goal for patients with DM1.
Conflicts of interest
No potential conflict of interest relevant to this article was re ported.
Acknowledgments
The authors are grateful to all staff members, doctors, and statis tical consultants who were involved in this study.
References
1. De Vivo DC, Ryan MM, Jones HR, Darras BT. Neuromuscular disor ders of infancy, childhood, and adolescence: a clinician’s approach. 2nd ed. Amsterdam: Academic Press, 2014.
2. Musova Z, Mazanec R, Krepelova A, Ehler E, Vales J, Jaklova R, et al. Highly unstable sequence interruptions of the CTG repeat in the myo tonic dystrophy gene. Am J Med Genet A 2009;149A:136574. 3. Harper PS, Brook JD, Newman E. Myotonic dystrophy. 3rd ed. Lon
don: WB Saunders, 2001.
4. Bundey S, Carter CO, Soothill JF. Early recognition of heterozygotes for the gene for dystrophia myotonica. J Neurol Neurosurg Psychiatry 1970;33:27993.
5. Pizzuti A, Friedman DL, Caskey CT. The myotonic dystrophy gene. Arch Neurol 1993;50:11739.
6. Mahadevan M, Tsilfidis C, Sabourin L, Shutler G, Amemiya C, Jansen
G, et al. Myotonic dystrophy mutation: an unstable CTG repeat in the 3' untranslated region of the gene. Science 1992;255:12535. 7. Brook JD, McCurrach ME, Harley HG, Buckler AJ, Church D,
Aburatani H, et al. Molecular basis of myotonic dystrophy: expansion of a trinucleotide (CTG) repeat at the 3' end of a transcript encoding a protein kinase family member. Cell 1992;68:799808.
8. Arsenault ME, Prévost C, Lescault A, Laberge C, Puymirat J, Mathieu J. Clinical characteristics of myotonic dystrophy type 1 patients with small CTG expansions. Neurology 2006;66:124850.
9. Harley HG, Rundle SA, MacMillan JC, Myring J, Brook JD, Crow S, et al. Size of the unstable CTG repeat sequence in relation to phenotype and parental transmission in myotonic dystrophy. Am J Hum Genet 1993;52:116474.
10. Kim SY, Kim JY, Kim GP, Sung JJ, Lim KS, Lee KW, et al. Molecular and clinical characteristics of myotonic dystrophy type 1 in koreans. Korean J Lab Med 2008;28:48392.
11. Kahrizi K, Moradin N, Azimian M, Shojasaffar B, Alavi K, Nafiisi S, et al. Genotypephenotype correlations in Iranian myotonic dystrophy type I patients. Iran Rehabil J 2010;8:812.
12. De Antonio M, Dogan C, Hamroun D, Mati M, Zerrouki S, Eymard B, et al. Unravelling the myotonic dystrophy type 1 clinical spectrum: a systematic registrybased study with implications for disease classifi cation. Rev Neurol (Paris) 2016;172:57280.
13. Willaert A, Jorissen M, Goeleven A. Swallowing dysfunction in myotonic dystrophy: a retrospective study of symptomatology and radiographic findings. BENT 2015;11:24956.
14. Thil C, Agrinier N, Chenuel B, Poussel M. Longitudinal course of lung function in myotonic dystrophy type 1. Muscle Nerve 2017;56:8168. 15. Hamshere MG, Harley H, Harper P, Brook JD, Brookfield JF. Myotonic
dystrophy: the correlation of (CTG) repeat length in leucocytes with age at onset is significant only for patients with small expansions. J Med Genet 1999;36:5961.
16. Savić D, RakocvicStojanovic V, Keckarevic D, Culjkovic B, Stojkovic O, Mladenovic J, et al. 250 CTG repeats in DMPK is a threshold for correlation of expansion size and age at onset of juvenileadult DM1. Hum Mutat 2002;19:1319.
17. Kurihara T. New classification and treatment for myotonic disorders. Intern Med 2005;44:102732.
18. Smith CA, Gutmann L. Myotonic dystrophy type 1 management and therapeutics. Curr Treat Options Neurol 2016;18:52.
19. Hanns L, Chris T. PhenoDM1 Myotonic Dystrophy type 1 (DM1) deep phenotyping to improve delivery of personalised medicine and assist in the planning, design and recruitment of clinical trials. Clinical Trials.gov. NCT02831504. Bethesda (MD): U.S. National Library of Medicine, 2016