Effect of image quality fluctuations
on the repeatability of thickness
measurements in swept‑source
optical coherence tomography
Heon Yang
1, Hye Sun Lee
4, Hyoung Won Bae
2, Gong Je Seong
2, Chan Yun Kim
2&
Sang Yeop Lee
2,3*This study investigated the effect of image quality fluctuations on the repeatability of thickness measurements of the peripapillary retinal nerve fibre (PP‑RNFL) and ganglion cell‑inner plexiform (GC‑IPL) layers using swept‑source optical coherence tomography (SS‑OCT). Three consecutive OCT scans each were performed on 56 healthy subject. Finally, 168 SS‑OCT results were analysed. Based on the tertile values of the mean absolute difference of image quality score, all subjects were divided into the following three groups—low‑(LIQD), moderate‑(MIQD), and high‑(HIQD) image quality score difference groups. A linear mixed model and intraclass correlation coefficients (ICCs) were used for analyses. Despite high ICC values (> 0.9), several sectors showed significant differences in the ICC values in intergroup comparisons. For LIQD‑HIQD and MIQD‑HIQD, most PP‑RNFL sectors showed significant differences. For GC‑IPL sectors, the LIQD‑HIQD comparison showed significant differences in the temporosuperior (p = 0.012), inferior (p < .001), and temporoinferior (p = 0.042) sectors. Significant differences existed in the average GC‑IPL (p = 0.009), nasoinferior (p = 0.035), and inferior GC‑IPL sectors (p < .001) for MIQD‑HIQD comparison. With higher image quality fluctuations, the repeatability of SS‑OCT decreased in several sectors, which are considered clinically relevant in evaluating glaucoma status. Therefore, maintaining high‑quality image status is essential to enhance the reliability of SS‑OCT.
Optical coherence tomography (OCT) is an indispensable ophthalmic imaging technology that effectively identi-fies retinal structural alterations. OCT technologies have undergone longitudinal development from time-domain OCT to spectral-domain OCT (SD-OCT) and swept-source OCT (SS-OCT). The recently developed SS-OCT uses a tunable light source with a central wavelength of 1,050 nm, and a photodiode detector with a semicon-ductor camera for light detection. These features permit a high scanning speed and a deep imaging range with uniform sensitivity. In glaucoma cases, these technological advances in OCT device have eased the measurement of changes in the peripapillary retinal nerve fibre layer (PP-RNFL) and ganglion cell-inner plexiform layer (GC-IPL) thickness. Both these layers are critical to evaluate the extent of damage of the glaucomatous optic nerve.
Diagnostic precision is of utmost importance when diagnosing a disease or monitoring its progression using OCT. Both image quality and repeatability/reproducibility of an OCT measurement affect its overall diagnostic precision. Segmentation error and misalignment of measurement area generate artefacts that affect the image quality and, ultimately, the OCT measurement values1–3. Repeatability and reproducibility relate to the scatter of
measured values and indicate whether a constant value is obtained when the same object is measured repeatedly. These parameters are helpful to monitor disease progression because repeated measurements are performed over time at the same anatomical region of an individual patient. Both SD-OCT and SS-OCT have demonstrated
open
1Kong Eye Center, Seoul, Republic of Korea. 2Department of Ophthalmology, Institute of Vision Research, Severance Hospital, Yonsei University College of Medicine, Seoul, Republic of Korea. 3Department of Ophthalmology, Yongin Severance Hospital, Yonsei University College of Medicine, Yongin, Gyeonggi-do, Republic of Korea. 4Biostatistics Collaboration Unit, Department of Research Affairs, Yonsei University College of Medicine, Seoul, Republic of Korea. *email: [email protected]
repeatability and reproducibility for clinical use4–7, which is an important reason for the widespread use of OCT
in the diagnosis and management of various ocular conditions, including glaucoma.
Although image quality and repeatability/reproducibility of OCT images are important factors when inter-preting the results, only few studies have previously investigated the effect of image quality fluctuations on repeatability or reproducibility8,9. Moreover, these studies were implemented using time-domain OCT or
SD-OCT at the peripapillary area. Therefore, this study aimed to evaluate the effect of image quality fluctuations on the repeatability of SS-OCT measurement values in both the macular and peripapillary areas. The results of this study indicate the importance of maintaining image quality in SS-OCT while performing repeated measurements.
Results
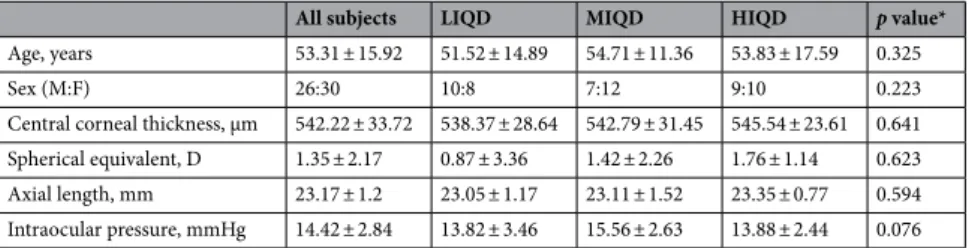
Of the 58 healthy subjects who were selected for OCT imaging, two were excluded based on their image quality scores. SS-OCT data of 56 subjects (25 men and 31 women), comprising 168 results from the three consecutive OCT examinations, were analysed. Based on the tertile values of the mean absolute difference of image qual-ity score, the subjects were stratified into three groups—low image qualqual-ity score difference group (LIQD; with scores ranging between 0.06 and 0.86 in PP-RNFL, and between 0.067 and 0.747 in GC-IPL), moderate image quality score difference group (MIQD; with scores ranging between 0.873 and 1.927 in PP-RNFL, and between 0.753 and 1.227 in GC-IPL), and high image quality score difference group (HIQD; with scores ranging between 1.947 and 10.053 in PP-RNFL, and between 1.253 and 8.3 in GC-IPL). The three groups showed no significant differences in their demographic or clinical characteristics (Table 1).
Comparison of PP‑RNFL and GC‑IPL thicknesses among the three groups.
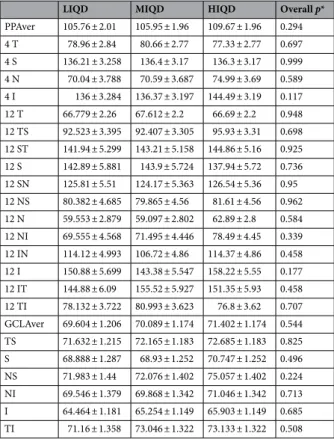
Table 2 shows results for the comparison of PP-RNFL and GC-IPL thicknesses among the three groups at each measurement sector. The linear mixed model showed no significant differences in PP-RNFL and GC-IPL thicknesses of different sec-tors among the three groups (Table 2). However, when the difference in image quality between OCT examina-tions was large, GC-IPL tended to be thick; this tendency was not seen in the peripapillary sectors.Correlations between image quality and SS‑OCT results at each measurement sector.
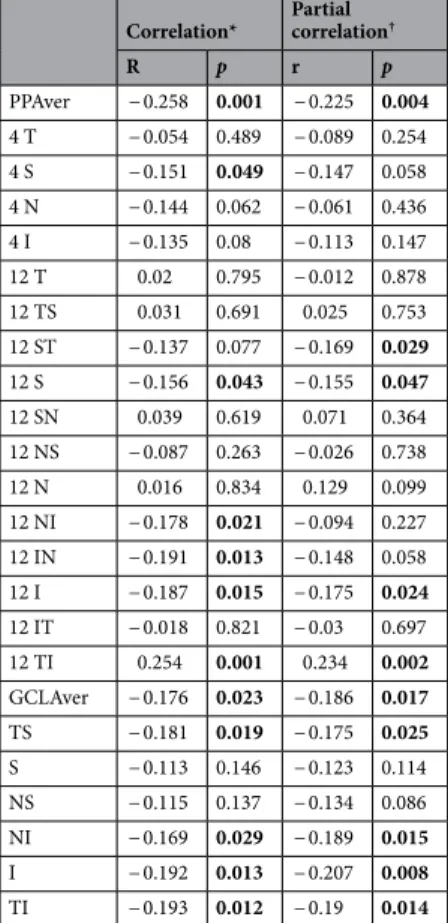
Corre-lation analyses between image quality and OCT results at each measurement sector were performed for repeated measurements (Table 3). After adjusting for age and sex, five sectors showed significant negative correlations between image quality and PP-RNFL (average PP-RNFL, superotemporal, superior, inferior, and temporoinfe-rior sectors) or GC-IPL (average GC-IPL, temporosupetemporoinfe-rior, nasoinfetemporoinfe-rior, infetemporoinfe-rior, and temporoinfetemporoinfe-rior sectors).Comparisons of repeatability among the three groups at each measurement sector.
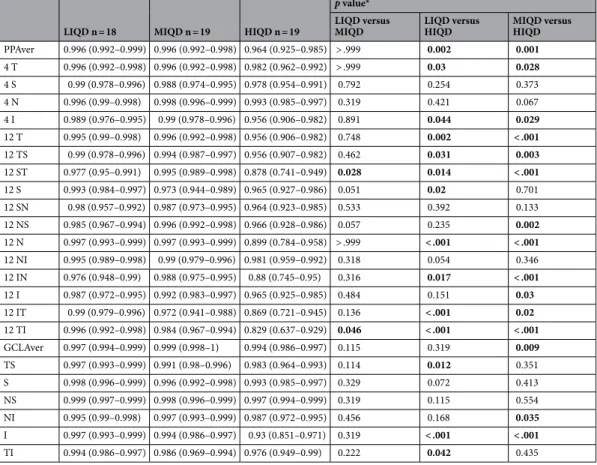
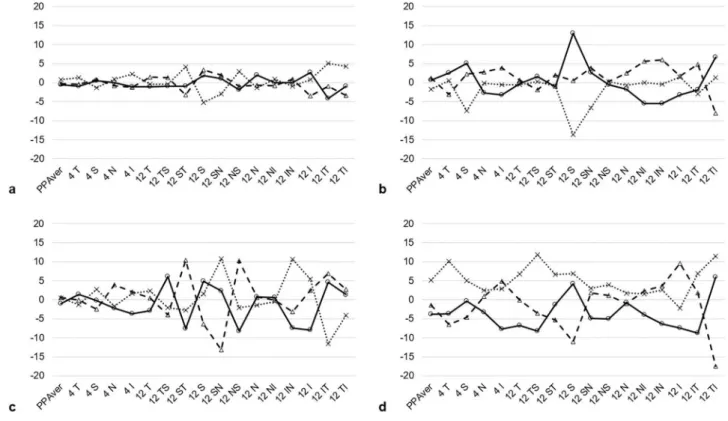
ICC of three consecutive measurement values was calculated and compared among the groups (Table 4). The overall repeatability was high in all sectors for all groups (ICC > 0.8). The ICC values were the lowest for the HIQD group in every measurement sector. Figure 1 shows the representative results for difference in thickness at each measurement sectors of PP-RNFL by image quality difference. With increase in the image quality difference value, the difference between the measured values increased accordingly. Results of between-group comparisons showed significant differences in repeatability at only two sectors (temporoinferior for PP-RNFL; inferior for GC-IPL) in the LIQD and MIQD groups. In addition, results of comparisons between LIQD and HIQD groups, and between MIQD and HIQD groups, showed significant differences in repeatability at most sectors for PP-RNFL, except at the superior, nasal, superior nasal, and nasoinferior sectors. On comparison of repeatability in GC-IPL sectors, significant differences were seen at the temporosuperior, inferior, and temporoinferior sectors between LIQD and HIQD groups, and at the average GC-IPL, nasoinferior, and inferior sectors between MIQD and HIQD groups. No sector showed significant differences in repeatability when compared between LIQD and MIQD groups. The proportion of sectors affected by image quality fluctuations was higher in PP-RNFL than in GC-IPL.Discussion
The results of this study, which investigated the association between image quality fluctuations and repeatability of SS-OCT measurements, showed that repeatability decreases with an increase in image quality fluctuation in several sectors of PP-RNFL and GC-IPL. These observations were made in healthy subjects with an OCT image quality > 60, which was calculated as per manufacturer’s recommendation for clinical use. Therefore, it
Table 1. Comparison of demographics and clinical characteristics among groups. LIQD low image quality
difference group, MIQD moderate image quality difference group, HIQD high image quality difference group,
SD standard deviation. *Analysis of variance or chi-square test; all values are represented as mean ± SD or ratio.
All subjects LIQD MIQD HIQD p value*
Age, years 53.31 ± 15.92 51.52 ± 14.89 54.71 ± 11.36 53.83 ± 17.59 0.325 Sex (M:F) 26:30 10:8 7:12 9:10 0.223 Central corneal thickness, µm 542.22 ± 33.72 538.37 ± 28.64 542.79 ± 31.45 545.54 ± 23.61 0.641 Spherical equivalent, D 1.35 ± 2.17 0.87 ± 3.36 1.42 ± 2.26 1.76 ± 1.14 0.623 Axial length, mm 23.17 ± 1.2 23.05 ± 1.17 23.11 ± 1.52 23.35 ± 0.77 0.594 Intraocular pressure, mmHg 14.42 ± 2.84 13.82 ± 3.46 15.56 ± 2.63 13.88 ± 2.44 0.076
can be said that our study was conducted under settings wherein the factors affecting OCT results, such as low image quality (image quality score < 60) and structural alteration by ocular disease, were controlled. In addi-tion, when the study groups were compared based on the mean absolute difference among three consecutive OCT measurements, no significant differences were noted in the measured thickness at any of the measurement sectors (Table 2). This result also indicates that there was no large deviation in the measured values of our data set. Nevertheless, even with good image quality (recommended for clinical use) and high repeatability (based on ICC), the measurement repeatability was affected by image quality fluctuations in several sectors, especially in comparisons involving the HIQD group. Moreover, this phenomenon affected sectors that are considered important in glaucoma management. Thus, it is crucial to maintain not only a high level of image quality but also a constant value of image quality for the clinical application of SS-OCT.
Interestingly, although the HIQD group had the lowest ICC value of each measurement sector among the three groups, not all sectors showed significant differences on comparison with the LIQD or MIQD groups. In addition, only five sectors of the clock-hour map for PP-RNFL (superotemporal, nasal, inferonasal, inferotem-poral, and temporoinferior sectors) showed ICC values under 0.9. If repeatability is exclusively determined by image quality, the repeatability of the OCT results obtained from subjects of HIQD group should be lower regardless of location of the measurement sectors. Segmentation is important for analysing the thickness of the retinal layer using OCT results. Although image quality is a critical factor for segmentation, ocular structural factors such as axial length, shape of optic disc, or tortuosity of retinal vessel also affect segmentation3,10,11. The
superotemporal, inferonasal, inferotemporal, and temporoinferior sectors contain retinal blood vessels, which contribute to the structural variation of the parapapillary area. Thus, the anatomic structure around the optic disc, which varies largely even in healthy eyes, could have influenced the repeatability.
Inter-individual diversity in the optic disc shape and peripapillary structures contribute to inaccuracies in the measurement of PP-RNFL thickness by OCT. In contrast, the macular area is well-known for its inter-individual similarities12–14. Such inaccuracies might influence clinical decision-making in glaucoma management. Therefore,
several studies have emphasised on the usefulness of GC-IPL parameters for the diagnosis of glaucoma in myopic eyes15–17. In the present study, the repeatability of GC-IPL sectors was relatively less affected by image quality
fluctuations as compared to PP-RNFL sectors. This result further supports the usefulness of macular GC-IPL thickness evaluation for estimating glaucoma status, although further studies on patients with glaucoma are required to confirm this occurrence. Previous studies have shown a positive correlation between image quality
Table 2. Comparison of thickness values measured using SS-OCT among the three groups. SS-OCT
swept-source optical coherence tomography, LIQD low image quality difference group, MIQD moderate image quality difference group, HIQD high image quality difference group, SE standard error, PPAver average PP-RNFL thickness, T temporal, S superior, N nasal, I inferior, TS temporosuperior, ST superotemporal, SN superonasal, NS nasosuperior, NI nasoinferior, IN inferonasal, IT inferotemporal, TI temporoinferior, GCLAver average GC-IPL thickness. *Linear mixed model; all values are represented as least-squares mean ± SE.
LIQD MIQD HIQD Overall p*
PPAver 105.76 ± 2.01 105.95 ± 1.96 109.67 ± 1.96 0.294 4 T 78.96 ± 2.84 80.66 ± 2.77 77.33 ± 2.77 0.697 4 S 136.21 ± 3.258 136.4 ± 3.17 136.3 ± 3.17 0.999 4 N 70.04 ± 3.788 70.59 ± 3.687 74.99 ± 3.69 0.589 4 I 136 ± 3.284 136.37 ± 3.197 144.49 ± 3.19 0.117 12 T 66.779 ± 2.26 67.612 ± 2.2 66.69 ± 2.2 0.948 12 TS 92.523 ± 3.395 92.407 ± 3.305 95.93 ± 3.31 0.698 12 ST 141.94 ± 5.299 143.21 ± 5.158 144.86 ± 5.16 0.925 12 S 142.89 ± 5.881 143.9 ± 5.724 137.94 ± 5.72 0.736 12 SN 125.81 ± 5.51 124.17 ± 5.363 126.54 ± 5.36 0.95 12 NS 80.382 ± 4.685 79.865 ± 4.56 81.61 ± 4.56 0.962 12 N 59.553 ± 2.879 59.097 ± 2.802 62.89 ± 2.8 0.584 12 NI 69.555 ± 4.568 71.495 ± 4.446 78.49 ± 4.45 0.339 12 IN 114.12 ± 4.993 106.72 ± 4.86 114.37 ± 4.86 0.458 12 I 150.88 ± 5.699 143.38 ± 5.547 158.22 ± 5.55 0.177 12 IT 144.88 ± 6.09 155.52 ± 5.927 151.35 ± 5.93 0.458 12 TI 78.132 ± 3.722 80.993 ± 3.623 76.8 ± 3.62 0.707 GCLAver 69.604 ± 1.206 70.089 ± 1.174 71.402 ± 1.174 0.544 TS 71.632 ± 1.215 72.165 ± 1.183 72.685 ± 1.183 0.825 S 68.888 ± 1.287 68.93 ± 1.252 70.747 ± 1.252 0.496 NS 71.983 ± 1.44 72.076 ± 1.402 75.057 ± 1.402 0.224 NI 69.546 ± 1.379 69.868 ± 1.342 71.046 ± 1.342 0.713 I 64.464 ± 1.181 65.254 ± 1.149 65.903 ± 1.149 0.685 TI 71.16 ± 1.358 73.046 ± 1.322 73.133 ± 1.322 0.508
and OCT-based measurement of macular or PP-RNFL thickness18–21, i.e., a reduction in image quality decreases
the macular or PP-RNFL thickness, thereby leading to incorrect OCT interpretations of glaucoma progression. In this study, image quality correlated significantly in several sectors for both PP-RNFL and GC-IPL thickness, and this result did not change even after adjusting for age and sex. Therefore, image quality remains an essential factor in the interpretation of SS-OCT results. Unlike the correlation results reported previously, the negative correlation between the thickness values and image quality may be due to repeated measurements, small sample size, or unknown intrinsic characteristics of SS-OCT. It is possible that a study on patients with glaucoma may yield negative correlation between the thickness values and image quality.
Studies on the relationship between image quality fluctuations and repeatability of OCT measurements are limited. Lee et al. reported the effect of signal strength difference on the repeatability of PP-RNFL thickness in time-domain OCT8, and Kim et al. reported the effect of signal strength on PP-RNFL thickness and colour-coded
classification in SD-OCT9. Both studies inferred that substantial differences in the signal strength lower the
repeatability. Our study presents similar results using SS-OCT. Compared to previous studies, the use of three consecutive measurements for statistical analysis provide more reliability to this study, and this strategy is more appropriate for identifying the impact of image quality fluctuation on OCT results.
This study has several limitations. First, although the data were collected prospectively, the number of sub-jects included was relatively small. Second, the effect of image quality fluctuation on repeatability was studied in healthy subjects. A similar study on patients with glaucoma will help to understand the clinical significance of image quality fluctuations on SS-OCT results. Third, the results of our study cannot be applied directly to other studies focused on other types of OCT. This is because the image quality score which was used for calculating image quality fluctuation in the present study was developed by the manufacturer of DRI OCT, although it is not difficult to predict that the accuracy of segmentation of the OCT will be lowered if the quality of the image deteriorates. Further studies involving other types of OCT seem necessary to clarify the effect of image quality fluctuation on repeatability in each type of OCT. Despite these limitations, our findings are meaningful because this is the first study to investigate the effect of image quality fluctuation on repeatability in SS-OCT using pro-spectively collected data.
Table 3. Correlations and partial correlations between image quality and SS-OCT results. SS-OCT
swept-source optical coherence tomography, PPAver average PP-RNFL thickness, T temporal, S superior, N nasal,
I inferior, TS, temporosuperior, ST superotemporal, SN superonasal, NS nasosuperior, NI nasoinferior, IN
inferonasal, IT inferotemporal, TI temporoinferior, GCLAver average GC-IPL thickness. *Pearson’s correlation estimated using a linear mixed model; †Partial correlation after age- and sex-adjustments; significant p values
are shown as bold-face text.
Correlation* Partial correlation†
R p r p PPAver − 0.258 0.001 − 0.225 0.004 4 T − 0.054 0.489 − 0.089 0.254 4 S − 0.151 0.049 − 0.147 0.058 4 N − 0.144 0.062 − 0.061 0.436 4 I − 0.135 0.08 − 0.113 0.147 12 T 0.02 0.795 − 0.012 0.878 12 TS 0.031 0.691 0.025 0.753 12 ST − 0.137 0.077 − 0.169 0.029 12 S − 0.156 0.043 − 0.155 0.047 12 SN 0.039 0.619 0.071 0.364 12 NS − 0.087 0.263 − 0.026 0.738 12 N 0.016 0.834 0.129 0.099 12 NI − 0.178 0.021 − 0.094 0.227 12 IN − 0.191 0.013 − 0.148 0.058 12 I − 0.187 0.015 − 0.175 0.024 12 IT − 0.018 0.821 − 0.03 0.697 12 TI 0.254 0.001 0.234 0.002 GCLAver − 0.176 0.023 − 0.186 0.017 TS − 0.181 0.019 − 0.175 0.025 S − 0.113 0.146 − 0.123 0.114 NS − 0.115 0.137 − 0.134 0.086 NI − 0.169 0.029 − 0.189 0.015 I − 0.192 0.013 − 0.207 0.008 TI − 0.193 0.012 − 0.19 0.014
In conclusion, this study reported that higher image quality fluctuation leads to lower repeatability of SS-OCT results in several sectors of PP-RNFL and GC-IPL. Interestingly, the identified sectors were clinically important for glaucoma management. In addition, the repeatability of GC-IPL sectors was relatively less affected than that of PP-RNFL sectors by image quality fluctuations. Thus, maintaining a high-quality image status is vital to enhance the reliability of SS-OCT for PP-RNFL and GC-IPL measurements, more so in the PP-RNFL region.
Methods
This study collected raw data retrospectively from the dataset used in a previous study to compare the repeat-ability and agreement between SD-OCT and SS-OCT in healthy eyes5. The institutional review board of
Yon-sei University Severance Hospital, Seoul, Korea, approved this study (1-2019-0043), and the need for written informed consent was waived because of the retrospective study design. The study adhered to the tenets of the Declaration of Helsinki. The detailed characteristics of the subjects in dataset have been described previously5.
Normal subjects who had visited the glaucoma clinic at our hospital between August 2014 and December 2014 were enrolled Medical history, Snellen best-corrected visual acuity (BCVA), slit-lamp biomicroscopy findings, intraocular pressure (IOP; Goldmann applanation tonometry), and indirect ophthalmoscopy findings were obtained. In addition, the following data were acquired: axial length estimated using the IOL Master (Carl Zeiss Meditec AG, Jena, Germany); central corneal thickness calculated using ultrasound pachymetry (DGH-1000; DGH Technology Inc., Frazer, PA, USA); optic disc and RNFL thickness measurements performed using a + 90 diopter (D) lens, colour disc, and red-free photography (VISUCAM200, Carl Zeiss Meditec AG, Jena, Germany). Optic nerve function had been estimated using a Humphrey Visual Field analyser (24-2 Swedish Interactive Threshold Algorithm; Carl Zeiss Meditec, Inc., Dublin, CA, USA).
Healthy subjects of age > 19 years with a BCVA ≥ 20/25 and no evidence of glaucomatous optic disc changes, RNFL defects, or visual field changes with IOP < 21 mmHg were included retrospectively. The eye that was analysed in each patient was selected randomly. Exclusion criteria were the presence of cataract grade of Lens Opacities Classification System III > 3, axial length > 24.5 mm, refractive errors with spherical equivalent > ±5D,
Table 4. Comparison of repeatability among the three groups. ICC intraclass correlation coefficient, CI
confidence interval, LIQ low image quality difference group, MIG moderate image quality difference group,
HIQ high image quality difference group, LSM least-squares mean, SE standard error, PPAver average PP-RNFL
thickness, T temporal, S superior, N nasal, I inferior, TS temporosuperior, ST superotemporal, SN superonasal,
NS nasosuperior, NI nasoinferior, IN inferonasal, IT inferotemporal, TI temporoinferior, GCLAver average
GC-IPL thickness. *Z-test, data are represented as ICC (95% CI); significant p values are shown as bold-faced text.
LIQD n = 18 MIQD n = 19 HIQD n = 19
p value*
LIQD versus
MIQD LIQD versus HIQD MIQD versus HIQD
PPAver 0.996 (0.992–0.999) 0.996 (0.992–0.998) 0.964 (0.925–0.985) > .999 0.002 0.001 4 T 0.996 (0.992–0.998) 0.996 (0.992–0.998) 0.982 (0.962–0.992) > .999 0.03 0.028 4 S 0.99 (0.978–0.996) 0.988 (0.974–0.995) 0.978 (0.954–0.991) 0.792 0.254 0.373 4 N 0.996 (0.99–0.998) 0.998 (0.996–0.999) 0.993 (0.985–0.997) 0.319 0.421 0.067 4 I 0.989 (0.976–0.995) 0.99 (0.978–0.996) 0.956 (0.906–0.982) 0.891 0.044 0.029 12 T 0.995 (0.99–0.998) 0.996 (0.992–0.998) 0.956 (0.906–0.982) 0.748 0.002 < .001 12 TS 0.99 (0.978–0.996) 0.994 (0.987–0.997) 0.956 (0.907–0.982) 0.462 0.031 0.003 12 ST 0.977 (0.95–0.991) 0.995 (0.989–0.998) 0.878 (0.741–0.949) 0.028 0.014 < .001 12 S 0.993 (0.984–0.997) 0.973 (0.944–0.989) 0.965 (0.927–0.986) 0.051 0.02 0.701 12 SN 0.98 (0.957–0.992) 0.987 (0.973–0.995) 0.964 (0.923–0.985) 0.533 0.392 0.133 12 NS 0.985 (0.967–0.994) 0.996 (0.992–0.998) 0.966 (0.928–0.986) 0.057 0.235 0.002 12 N 0.997 (0.993–0.999) 0.997 (0.993–0.999) 0.899 (0.784–0.958) > .999 < .001 < .001 12 NI 0.995 (0.989–0.998) 0.99 (0.979–0.996) 0.981 (0.959–0.992) 0.318 0.054 0.346 12 IN 0.976 (0.948–0.99) 0.988 (0.975–0.995) 0.88 (0.745–0.95) 0.316 0.017 < .001 12 I 0.987 (0.972–0.995) 0.992 (0.983–0.997) 0.965 (0.925–0.985) 0.484 0.151 0.03 12 IT 0.99 (0.979–0.996) 0.972 (0.941–0.988) 0.869 (0.721–0.945) 0.136 < .001 0.02 12 TI 0.996 (0.992–0.998) 0.984 (0.967–0.994) 0.829 (0.637–0.929) 0.046 < .001 < .001 GCLAver 0.997 (0.994–0.999) 0.999 (0.998–1) 0.994 (0.986–0.997) 0.115 0.319 0.009 TS 0.997 (0.993–0.999) 0.991 (0.98–0.996) 0.983 (0.964–0.993) 0.114 0.012 0.351 S 0.998 (0.996–0.999) 0.996 (0.992–0.998) 0.993 (0.985–0.997) 0.329 0.072 0.413 NS 0.999 (0.997–0.999) 0.998 (0.996–0.999) 0.997 (0.994–0.999) 0.319 0.115 0.554 NI 0.995 (0.99–0.998) 0.997 (0.993–0.999) 0.987 (0.972–0.995) 0.456 0.168 0.035 I 0.997 (0.993–0.999) 0.994 (0.986–0.997) 0.93 (0.851–0.971) 0.319 < .001 < .001 TI 0.994 (0.986–0.997) 0.986 (0.969–0.994) 0.976 (0.949–0.99) 0.222 0.042 0.435
or cylindrical error > ±3D, and any medical or ophthalmic conditions that influenced the optic disc, RNFL, and visual field measurements.
Thickness measurement using SS‑OCT for repeatability.
In this study, we used the DRI OCT-1 system (Topcon, Tokyo, Japan, analysis software version 9.1.2.28693), which had a high-speed wavelength tun-ing laser source with central wavelength of 1,050 nm. This SS-OCT system had an image acquisition speed of 100,000 A-scan/second, with an axial and transverse resolutions of 8 and 20 µm, respectively. Three consecu-tive SS-OCT scans were acquired on the same day with an interval of at least 5 min between the scans. A single technician performed all scans using an internal fixation target. Pupillary dilation was performed in all subjects. A three-dimensional (3D) optic disc and 3D wide scan protocols were used to measure PP-RNFL and GC-IPL thicknesses, respectively. The 3D optic disc scan covered a 6 × 6-mm area on the optic disc and comprised 512 A-scans × 256 B-scans. PP-RNFL thickness was measured in a 3.4-mm-diameter scan circle centred on the optic disc. The 3D wide scan protocol covered a 12 × 9-mm rectangular area centred between the optic disc and fovea and comprised 512 A-scans × 256 B-scans. PP-RNFL thicknesses was measured in each quadrant (evenly spaced 4 sectors), 12 clock-hour sectors (evenly spaced 12 sectors), and as an average. The quadrant PP-RNFL sector names started with the number 4, while the clock-hour sector names started with the number 12. The average GC-IPL thickness and measurement in each of six sectors (evenly configured sectors centred on the fovea) were collected. Built-in automated segmentation algorithms were used to distinguish each retinal layer. Two investigators (S.Y.L. and Y.H.) independently reconfirmed the image quality, segmentation, and alignment of the measurement window. SS-OCT images with image quality scores > 60 were selected for analysis according to the manufacturer’s recommendation.The mean absolute difference among three consecutive OCT measurements were calculated as follows:
where IQn—image quality score at the nth measurement.
The subjects were stratified into three groups based on the tertile values of the mean absolute difference of image quality score—LIQD (n = 18), MIQD (n = 19), and HIQD (n = 19). Because subjects in the LIQD group
Mean absolute difference of image quality score: (|IQ1 − IQ2|+|IQ2 − IQ3|+|IQ1 − IQ3|)/3
Figure 1. The representative results of differences between the measured values by image quality difference
at each sector of PP-RNFL. The image quality difference for a, b, c, and d was 0.107, 0.88, 5.233, and 8.087, respectively. X-axis indicates the measurement sectors, and Y-axis indicates the difference between the masured values. The solid line indicates the difference between the first and second measurements. The thick dotted line indicates the difference between the second and third measurements. The thin dotted line indicates the difference between the first and third measurements. PP Aver average PP-RNFL thickness, T temporal, S superior, N nasal, I inferior, TS temporosuperior, ST superotemporal, SN superonasal, NS nasosuperior, NI nasoinferior, IN inferonasal, IT inferotemporal, TI temporoinferior, PP-RNFL peripapillary retinal nerve fibre layer.
were included in the first third when the mean absolute difference of image quality score was listed in ascending order, they had similar image quality scores among the three consecutive OCT results. In contrast, subjects in the HIQD group showed substantial variation among the three image quality scores because these subjects were the last third subjects.
Statistical analyses.
Analyses of variance and chi-square tests were performed for the comparison of con-tinuous and categorical variables between the groups. A linear mixed model compared the thickness values among the three groups. To determine the repeatability of three consecutive measurements, intraclass correla-tion coefficients (ICCs) were used. The degree of repeatability was decided according to the ICC value—almost perfect (0.81–1), substantial (0.61–0.8), moderate (0.41–0.6), fair (0.21–0.4), and slight (0–0.2)22. To comparethe between-group ICC values, the z-score test was used22–24. Pearson’s correlation coefficients with and without
adjustment of age and sex were used to investigate correlation between the image quality and thickness value. Correlation coefficients were estimated using a linear mixed-effects model to consider three datasets in one individual. All statistical analyses were performed using SAS version 9.4 software (SAS Institute Inc., Cary, NC, USA) by a statistician (H.S.L). Statistical significance was defined as p value < 0.05.
Received: 17 February 2020; Accepted: 23 July 2020
References
1. Asrani, S., Essaid, L., Alder, B. D. & Santiago-Turla, C. Artifacts in spectral-domain optical coherence tomography measurements in glaucoma. JAMA Ophthalmol. 132, 396–402 (2014).
2. Lee, S. Y. et al. Frequency, type and cause of artifacts in swept-source and cirrus HD optical coherence tomography in cases of glaucoma and suspected glaucoma. Curr. Eye Res. 41, 957–964 (2016).
3. Mansberger, S. L., Menda, S. A., Fortune, B. A., Gardiner, S. K. & Demirel, S. Automated segmentation errors when using optical coherence tomography to measure retinal nerve fiber layer thickness in glaucoma. Am. J. Ophthalmol. 174, 1–8 (2017). 4. Matlach, J., Wagner, M., Malzahn, U. & Gobel, W. Repeatability of peripapillary retinal nerve fiber layer and inner retinal thickness
among two spectral domain optical coherence tomography devices. Invest. Ophth. Vis. Sci. 55, 6536–6546 (2014).
5. Lee, S. Y., Bae, H. W., Kwon, H. J., Seong, G. J. & Kim, C. Y. Repeatability and agreement of swept source and spectral domain optical coherence tomography evaluations of thickness sectors in normal eyes. J. Glaucoma 26, e46–e53 (2017).
6. Lee, S. Y., Bae, H. W., Seong, G. J. & Kim, C. Y. Diagnostic ability of swept-source and spectral-domain optical coherence tomog-raphy for glaucoma. Yonsei Med. J. 59, 887–896 (2018).
7. Dominguez-Vicent, A., Brautaset, R. & Venkataraman, A. P. Repeatability of quantitative measurements of retinal layers with SD-OCT and agreement between vertical and horizontal scan protocols in healthy eyes. PLoS ONE 14, e0221466 (2019). 8. Lee, E. S., Kim, H. & Kim, J. M. Effect of signal strength on reproducibility of peripapillary retinal nerve fiber layer thickness
measurement and its classification by time-domain optical coherence tomography. Jpn. J. Ophthalmol. 54, 414–422 (2010). 9. Kim, J. H. et al. Effect of signal strength on reproducibility of circumpapillary retinal nerve fiber layer thickness measurement and
its classification by spectral-domain optical coherence tomography. Jpn. J. Ophthal. 55, 220–227 (2011).
10. Miki, A. et al. Prevalence and associated factors of segmentation errors in the peripapillary retinal nerve fiber layer and macular ganglion cell complex in spectral-domain optical coherence tomography images. J. Glaucoma 26, 995–1000 (2017).
11. Ye, C., Yu, M. & Leung, C. K. Impact of segmentation errors and retinal blood vessels on retinal nerve fibre layer measurements using spectral-domain optical coherence tomography. Acta Ophthalmol. 94, e211-219 (2016).
12. Mwanza, J. C. et al. Macular ganglion cell-inner plexiform layer: automated detection and thickness reproducibility with spectral domain-optical coherence tomography in glaucoma. Invest. Ophth. Vis. Sci. 52, 8323–8329 (2011).
13. Jeong, J. H., Choi, Y. J., Park, K. H., Kim, D. M. & Jeoung, J. W. Macular ganglion cell imaging study: covariate effects on the spectral domain optical coherence tomography for glaucoma diagnosis. PLoS ONE 11, e0160448 (2016).
14. Kim, K. E. & Park, K. H. Macular imaging by optical coherence tomography in the diagnosis and management of glaucoma. Brit.
J. Ophthalmol. 102, 718–724 (2018).
15. Akashi, A. et al. The ability of SD-OCT to differentiate early glaucoma with high myopia from highly myopic controls and nonhighly myopic controls. Invest. Ophth. Vis. Sci. 56, 6573–6580 (2015).
16. Seol, B. R., Jeoung, J. W. & Park, K. H. Glaucoma detection ability of macular ganglion cell-inner plexiform layer thickness in myopic preperimetric glaucoma. Invest. Ophth. Vis. Sci. 56, 8306–8313 (2015).
17. Kim, Y. K. et al. Glaucoma-diagnostic ability of ganglion cell-inner plexiform layer thickness difference across temporal raphe in highly myopic eyes. Invest. Ophth. Vis. Sci. 57, 5856–5863 (2016).
18. Cheung, C. Y., Leung, C. K., Lin, D., Pang, C. P. & Lam, D. S. Relationship between retinal nerve fiber layer measurement and signal strength in optical coherence tomography. Ophthalmology 115, 1347–1351 (2008).
19. Wu, Z., Huang, J., Dustin, L. & Sadda, S. R. Signal strength is an important determinant of accuracy of nerve fiber layer thickness measurement by optical coherence tomography. J. Glaucoma 18, 213–216 (2009).
20. Cheung, C. Y. et al. Determinants of quantitative optic nerve measurements using spectral domain optical coherence tomography in a population-based sample of non-glaucomatous subjects. Invest. Ophth. Vis. Sci. 52, 9629–9635 (2011).
21. Hardin, J. S., Taibbi, G., Nelson, S. C., Chao, D. & Vizzeri, G. Factors affecting cirrus-HD OCT optic disc scan quality: A review with case examples. J. Ophthalmol. 2015, 746150 (2015).
22. Landis, J. R. & Koch, G. G. The measurement of observer agreement for categorical data. Biometrics 33, 159–174 (1977). 23. Fanchin, R. et al. High reproducibility of serum anti-Mullerian hormone measurements suggests a multi-staged follicular secretion
and strengthens its role in the assessment of ovarian follicular status. Hum. Reprod. 20, 923–927 (2005).
24. Hirai, T. et al. Quantitative blood flow measurements in gliomas using arterial spin-labeling at 3T: Intermodality agreement and inter- and intraobserver reproducibility study. AJNR. Am. J. Neuroradiol. 32, 2073–2079 (2011).
Author contributions
The authors are solely responsible for the content and writing of this manuscript; Drafting of the main manu-script: H.Y., S.Y.L.; Conception and design: H.Y., H.Y.B., G.J.S., C.Y.K., S.Y.L.; Analysis and interpretation: H.S.L., H.Y., S.Y.L.; Data collection: H.Y., S.Y.L.; Overall responsibility: S.Y.L.
Competing interests
Additional information
Correspondence and requests for materials should be addressed to S.Y.L. Reprints and permissions information is available at www.nature.com/reprints.
Publisher’s note Springer Nature remains neutral with regard to jurisdictional claims in published maps and
institutional affiliations.
Open Access This article is licensed under a Creative Commons Attribution 4.0 International
License, which permits use, sharing, adaptation, distribution and reproduction in any medium or format, as long as you give appropriate credit to the original author(s) and the source, provide a link to the Creative Commons licence, and indicate if changes were made. The images or other third party material in this article are included in the article’s Creative Commons licence, unless indicated otherwise in a credit line to the material. If material is not included in the article’s Creative Commons licence and your intended use is not permitted by statutory regulation or exceeds the permitted use, you will need to obtain permission directly from the copyright holder. To view a copy of this licence, visit http://creat iveco mmons .org/licen ses/by/4.0/.