Evaluation of the predictive value of coronary artery calcium
score for obstructive coronary artery disease in asymptomatic
Korean patients with type 2 diabetes mellitus
Ki-Bum Won
a,e, Hyuk-Jae Chang
a,c, Hiroyuki Niinuma
e, Jimin Sung
d,
Sanghoon Shin
a, In-Jeong Cho
a, Chi-Young Shim
a, Geu-Ru Hong
a,
Young Jin Kim
b, Byung-Wook Choi
band Namsik Chung
aBackground Compared with coronary computed tomographic angiography (CCTA), the coronary artery calcium score (CACS) may be limited in predicting adverse cardiovascular events in asymptomatic diabetic patients. Methods We evaluated the predictive value of CACS for obstructive coronary plaques (OCPs) assessed by CCTA in 328 consecutive asymptomatic patients with type 2 diabetes mellitus who had an estimated glomerular filtration rate greater than 60 ml/min/1.73 m2.
Results In total, 29 (9%) patients had OCPs: calcified or mixed OCPs and noncalcified OCPs were found in 26 (8%) and three (1%) patients, respectively. On the basis of a CACS of 0, 1–10, 11–100, and greater than 100, OCPs were found in 2, 5, 15, and 36% of patients, respectively. On receiver operating characteristic curve analysis, the optimal cutoff CACS for predicting OCPs was found to be 33, with 83% sensitivity and 81% specificity (area under the curve, 0.853; 95% confidence interval, 0.777–0.930; P < 0.001). Positive and negative predictive values of a CACS of 33 for OCPs were 30 and 98%, respectively. On multivariate logistic regression analysis, age [odds ratio (OR), 1.09], microalbuminuria (OR, 3.43), current smoking (OR, 3.93), and CACS greater than 33 (OR, 15.85) were found to be
independently associated with an increased risk for OCPs (P < 0.05, respectively). The predictive significance of CACS greater than 33 for OCPs improved after considering the status of microalbuminuria and current smoking. Conclusion These findings suggest that CACS is an effective gatekeeper for evaluating obstructive coronary artery disease using CCTA in asymptomatic Korean patients with type 2 diabetes mellitus who have near-normal kidney function. Coron Artery Dis 26:150–156 Copyright © 2015 Wolters Kluwer Health, Inc. All rights reserved.
Coronary Artery Disease2015, 26:150–156
Keywords: coronary artery calcium score, coronary computed tomographic angiography, obstructive coronary plaque, type 2 diabetes mellitus
aDivision of Cardiology,bDivision of Radiology, Yonsei Cardiovascular Center,
Yonsei University College of Medicine,cSeverance Biomedical Science Institute,
Seoul,dGraduate School of Health and Welfare CHA University, Seongnam,
Republic of Korea andeDivision of Cardiology, St. Luke’s International Hospital, Tokyo, Japan
Correspondence to Hyuk-Jae Chang, MD, PhD, Division of Cardiology, Yonsei Cardiovascular Center, Yonsei University College of Medicine, 50 Yonsei-ro, Seodaemun-gu, Seoul 120-752, Republic of Korea
Tel: + 82 2 222 88460; fax: + 82 2 393 2041; e-mail: [email protected] Received25 June 2014 Revised 23 August 2014
Accepted19 September 2014
Introduction
Diabetes is strongly associated with adverse cardiovas-cular (CV) events [1]. Coronary artery disease (CAD) is the major cause of mortality among diabetic patients, accounting for 75% of deaths in this population [2]. However, myocardial ischemia in patients with diabetes is often asymptomatic and frequently manifests clinically in the advanced stage [3,4]. Given these associations between CAD and diabetes, screening for obstructive CAD in asymptomatic diabetic patients is of importance. The coronary artery calcium score (CACS), which was developed to quantify the extent of coronary calcification [5], is a good marker of the degree of atheromatous
plaque burden [6,7]. CACS is an independent predictor of coronary events and improves CV risk prediction in asymptomatic individuals [7–9]. However, CACS may have limited predictive value for adverse coronary events in diabetic patients compared with nondiabetic indivi-duals, although the risk for coronary events increases with increasing calcium scores and diabetes status among asymptomatic individuals [10]. This implies that CACS more accurately reflects the total atheromatous plaque burden rather than the presence of obstructive coronary plaques (OCPs) despite the incremental impact of dia-betes on coronary atherosclerosis.
Coronary computed tomographic angiography (CCTA) is a novel, noninvasive imaging approach for evaluating coronary atherosclerosis, with a high diagnostic accuracy for detecting coronary plaques [11–13]. A recent study has reported that the severity of CAD assessed by CCTA
This is an open-access article distributed under the terms of the Creative Commons Attribution-NonCommercial-NoDerivatives 3.0 License, where it is permissible to download and share the work provided it is properly cited. The work cannot be changed in any way or used commercially.
is independently associated with adverse clinical out-comes in diabetic patients [14]. Thus, the identification of obstructive CAD may be important in asymptomatic diabetic patients for CV risk stratification. However, the routine use of CCTA for CV risk assessment of asymp-tomatic individuals has not been recommended, irre-spective of the presence of diabetes [15]. Although the application of CCTA on the basis of CACS may be a useful method for evaluating obstructive CAD in asymptomatic diabetic patients, data on the association between CACS and obstructive CAD are limited, espe-cially in the Asian population. In the present study, we investigated the predictive value of CACS for obstructive CAD assessed by CCTA in 328 consecutive asympto-matic Korean patients with type 2 diabetes mellitus (T2DM) who had an estimated glomerular filtration rate (GFR) greater than 60 ml/min/1.73 m2.
Materials and methods
ParticipantsThis cross-sectional study included 328 consecutive asymptomatic patients with T2DM who underwent CCTA between January 2008 and December 2009 at Severance Cardiovascular Hospital. None of the patients had CV symptoms, including typical angina, atypical angina, dyspnea, and excessive fatigue. Exclusion criteria were age less than 35 years, type 1 diabetes mellitus, ECG evidence of Q-wave myocardial infarction, ischemic ST-segment or T-wave changes, or complete left-bundle branch block, a clinical history of CV disease, cere-brovascular disease, or malignancy, and an estimated modification of diet in renal disease GFR less than 60 ml/ min/1.73 m2. All participants provided informed consent, and the study protocol was approved by the ethics com-mittee of our institution.
Multidetector computed tomography protocol
Participants with an initial heart rate of at least 65 beats/min before undergoing multidetector computed tomography (CT) received a single oral dose of 50 mg metoprolol tar-trate (Betaloc; Yuhan, Seoul, South Korea) 1 h before CT examination, unless treatment with a β-blocker was traindicated because of heart failure, atrioventricular con-duction abnormalities, or bronchial asthma. Imaging was performed for all patients using a 64-slice CT scanner (Sensation 64; Siemens Medical System, Forchheim, Germany). All CT examinations were performed during breath holding in inspiration. Initially, a nonenhanced prospective ECG-gated scan to evaluate CACS was per-formed with the following parameters: rotation time of 330 ms, slice collimation of 0.6 mm, slice width of 3.0 mm, tube voltage of 100–120 kV, tube current of 50 mA, and table feed/scan of 18 mm. Thereafter, CCTA was per-formed using retrospective ECG gating with the following scan parameters: rotation time of 330 ms, slice collimation of 64× 0.6 mm, tube voltage of 100–120 kV, tube current of 400–800 mA (depending on the patient size), table feed/
scan of 3.8 mm, and pitch factor of 0.2. ECG-based tube current modulation was applied to 65% of the R–R interval. A real-time bolus-tracking technique was applied to trigger the initiation of the scan. Contrast enhancement was achieved with 60 ml iopamidol (370 mg/ml iodine, Iopamiro; Bracco, Milan, Italy) injected at 5 ml/s, followed by injection of 30 ml diluted contrast medium (saline –-contrast agent ratio of 7 : 3) and then 30 ml saline at 5 ml/s with a power injector (Envision CT; Medrad, Indianola, Pennsylvania, USA) through an antecubital vein. Image reconstruction was performed in the scanner workstation using commercially available software (Wizard; Siemens Medical Solutions). Axial images were reconstructed ret-rospectively at 65% of the R–R interval for each cardiac cycle. If artifacts were present, additional data sets were obtained for various points of the cardiac cycle, and the data set with the minimum artifact was selected for further analysis. The reconstructed image data sets were trans-ferred to an offline workstation (Aquar-ius Workstation; TeraRecon Inc., San Mateo, California, USA). Each lesion identified was examined using maximum intensity pro-jection and multiplanar reconstruction techniques on a short axis and along multiple longitudinal axes. Lesions were classified by the maximal stenosis of luminal diameter observed on any plane.
Coronary calcium and plaque measurement
All CCTA results were evaluated by two experienced cardiac radiologists (Y.J.K. and B.-W.C., who had 6 and 9 years of experience, respectively, in cardiac CT). In the case of disagreement, a joint reading was performed to reach a consensus. This study evaluated the association between CACS and the presence of any plaque and OCPs. CACS was evaluated on the basis of the scoring system, using a previously described method [5]. Because the frequency of CACS greater than 100 in the Asian population is known to be low compared with that among African-American, Caucasian, and Hispanic populations [16] and because a few participants in the present study had CACS greater than 400 (7%), the participants were categorized by a CACS of 0, 1–10, 11–100, and greater than 100. Plaques or OCPs were classified into two subtypes according to the presence of coronary calcifi-cation – that is, calcified or mixed plaque and non-calcified plaque. Plaques were defined as structures greater than 1 mm2within and/or adjacent to the vessel lumen that were clearly distinguished from the lumen and surrounding pericardial tissue, and OCPs were defined as plaques with stenosis of at least 50% luminal diameter. Obstructive CAD was defined by the presence of OCPs on CCTA.
Biochemical and clinical parameters
Information on current smoking and a history of hyper-tension, dyslipidemia, and diabetes was systematically collected. Height, weight, and blood pressure were measured during hospital visits. All blood samples were
obtained after a minimum of 8 h of fasting and analyzed for lipid profiles, including triglyceride, high-density lipoprotein cholesterol, low-density lipoprotein choles-terol, and glucose levels. BMI was calculated as weight (kg) divided by height (m2), and obesity was defined as a BMI of at least 25 kg/m2. Kidney function was assessed on the basis of the estimated GFR calculated using the formula validated in the modification of diet in renal disease study [17]. The albumin-to-creatinine ratio in untimed spot urine was used for assessing proteinuria as recommended [18]. Spot urine albumin-to-creatinine ratio greater than 17 mg/g (men) or greater than 25 mg/g (women) was defined as microalbuminuria. The partici-pant was considered a current smoker if he/she con-sistently smoked or smoked within 1 month before the study. Hypertension was defined as a systolic blood pressure of at least 140 mmHg and/or a diastolic blood pressure of at least 90 mmHg, or by treatment with antihypertensive agents. Dyslipidemia was defined as a total cholesterol level of at least 240 mg/dl, a low-density lipoprotein level of at least 130 mg/dl, a high-density lipoprotein level of up to 40 mg/dl, a triglyceride level of at least 150 mg/dl, and/or treatment with lipid-lowering agents. Diabetes was defined as either a fasting glucose level of at least 126 mg/dl, a referral diagnosis of diabetes, or the presence of antidiabetic treatment.
Statistical analysis
Values are expressed as mean± SD for continuous ables and numbers and percentages for categorical vari-ables. Continuous variables were compared using Student’s t-test, and categorical variables were compared using the χ2-test or Fisher’s exact test, as appropriate. Receiver operating characteristic curve analysis using the Youden index was carried out to determine the optimal cutoff CACS for predicting OCPs. Univariate logistic regression analysis was carried out to identify the impact of an individual CV risk factor on OCPs, and multivariate logistic regression analysis was carried out to identify independent determinants of OCPs. We then compared the predictive significance of the optimal cutoff CACS for OCPs after considering independent risk factors. All analyses were carried out using SAS (version 9.1.3; SAS Institute Inc., Cary, North Carolina, USA). AP-value less than 0.05 was considered statistically significant.
Results
The baseline characteristics of the 328 patients (53± 9 years, 77% men) in this study are shown in Table 1. Hypertension, dyslipidemia, and obesity were present in 39, 60, and 46% of the participants, respec-tively. The incidence of microalbuminuria and current smoking was 26 and 34%, respectively. The mean CACS was 80± 241, and the incidence of the CACS categories 0, 1–10, 11–100, and greater than 100 was 62, 7, 17, and 14%, respectively. Forty-six percent of the patients had pla-ques, with calcified or mixed plaques and noncalcified
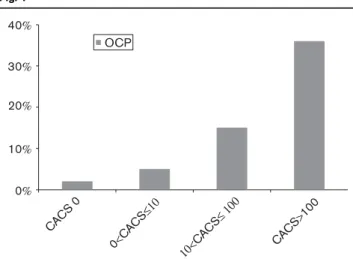
plaques found in 38 and 8%, respectively. Nine percent of the patients had OCPs, with calcified or mixed OCPs and noncalcified OCPs found in 8 and 1%, respectively. OCPs were found in 2, 5, 15, and 36% of the patients belonging to CACS categories 0, 1–10, 11–100, and greater than 100, respectively (Fig. 1). On receiver operating characteristic analysis, the optimal cutoff CACS for predicting OCPs, as determined using the Youden index, was found to be 33, with 83% sensitivity and 81% specificity [area under curve
Table 1 Baseline characteristics
Characteristics n= 328 Patients Age (years) 53± 9 Men [n (%)] 252 (77) BMI (kg/m2) 25.1± 3.2 Obesity [n (%)] 151 (46) Hypertension [n (%)] 129 (39) Dyslipidemia [n (%)] 196 (60) Current smoking [n (%)] 110 (34) Total cholesterol (mg/dl) 199± 38 Triglyceride (mg/dl) 159± 99 HDL (mg/dl) 51± 12 LDL (mg/dl) 107± 30 Creatinine (mg/dl) 1.1± 0.1 Microalbuminuria [n (%)] 78 (24) GFR (ml/min/1.73 m2) 75± 11 Coronary artery CACS 80± 241 CACS= 0 [n (%)] 204 (62) 0< CACS ≤ 10 [n (%)] 22 (7) 10< CACS ≤ 100 [n (%)] 55 (17) CACS> 100 [n (%)] 47 (14) Any plaque [n (%)] 152 (46) Calcified or mixed plaque [n (%)] 124 (38) Noncalcified plaque [n (%)] 28 (8)
OCP [n (%)] 29 (9)
Calcified or mixed OCP [n (%)] 26 (8) Noncalcified OCP [n (%)] 3 (1) Data are expressed as n (%) or mean± SD.
CACS, coronary artery calcium score; GFR, glomerular filtration rate; HDL, high-density lipoprotein; LDL, low-high-density lipoprotein; OCP, obstructive coronary plaque.
Fig. 1 40% 30% 20% 10% 0% CAC S 0 0<CAC S≤10 10<CAC S≤ 100 CAC S>100 OCP
The occurrence of OCPs according to the categorized CACS. CACS, coronary artery calcium score; OCP, obstructive coronary plaque.
(AUC), 0.853; 95% confidence interval (CI), 0.777–0.930; P < 0.001]. The positive and negative predictive values of CACS 33 for OCPs were 30 and 98%, respectively (Fig. 2).
The clinical characteristics of the participants according to the presence of OCPs are shown in Table 2. The mean age was significantly higher among T2DM patients with OCPs than among those without OCPs. The incidence of male sex, microalbuminuria, and CACS greater than 33 was significantly higher among T2DM patients with OCPs than among those without OCPs.
Univariate logistic regression analysis showed that age [odds ratio (OR), 1.08; 95% CI, 1.03–1.12; P = 0.010], microalbuminuria (OR, 4.56; 95% CI, 2.05–10.15; P < 0.001), and CACS greater than 33 (OR, 19.95; 95% CI, 7.30–54.50; P < 0.001) were significantly associated with an increased risk for OCPs. On multivariate logistic regression analysis, age (OR, 1.09; 95% CI, 1.02–1.17; P = 0.016), microalbuminuria (OR, 3.43; 95% CI, 1.31–8.99; P = 0.012), current smoking (OR, 3.93; 95% CI, 1.26–12.28; P = 0.019), and CACS greater than 33 (OR, 15.85; 95% CI, 4.83–52.03; P < 0.001) were found to be independently associated with an increased risk for OCPs (Table 3).
The predictive significance of CACS greater than 33 for OCPs improved after considering the status of micro-albuminuria (CACS> 33AUC vs. CACS> 33 with micro-albuminuria AUC: 0.816 vs. 0.862; P = 0.033) and both microalbuminuria and current smoking (CACS> 33AUC vs. CACS> 33 with microalbuminuria and current smokingAUC: 0.816 vs. 0.864;P = 0.044; Table 4).
Discussion
Compared with CCTA, CACS may have a limited pre-dictive value for adverse coronary events in asympto-matic diabetic patients because CACS more accurately reflects the total plaque burden rather than the presence of OCPs despite the incremental impact of diabetes on coronary atherosclerosis. Although the application of CCTA based on the CACS may be a useful method for evaluating obstructive CAD in asymptomatic diabetic patients, data on the association between CACS and obstructive CAD are scarce, especially in the Asian population.
The association between diabetes and CV disease is well established. CAD is the leading cause of death among diabetic patients but is more often silent in patients with diabetes [3,4]. Thus, screening for obstructive CAD in asymptomatic diabetic patients is an appealing concept. CACS, a coronary atherosclerotic surrogate marker, has been extensively studied and is known to be an inde-pendent predictor of coronary events that improves CV risk prediction in asymptomatic individuals [7–9]. However, the South Bay Heart Watch study, which was conducted on high-risk asymptomatic patients, showed that CACS was not significantly associated with the subsequent occurrence of CV events; however, CACS was significantly higher in diabetic than in nondiabetic individuals, with diabetic patients experiencing twice as many CV events [10]. In contrast, the COronary CT Angiography EvaluatioN For Clinical Outcomes: an InteRnational Multicenter Registry (CONFIRM) study recently reported that the severity of CAD assessed by CCTA is independently associated with adverse clinical outcomes in both nondiabetic and diabetic individuals [14]. Accordingly, compared with CACS, the identifica-tion of OCPs might be helpful in assessing CV risk
Fig. 2 1.0 0.8 0.6 0.4 0.2 0.0 0.0 0.2 0.4 0.6 0.8 1.0 1−Specificity Sensitivity
Optimal cutoff CACS: 33 Sensitivity: 83% Specificity: 81% PPV: 30% NPV: 98%
Receiver operating characteristic curve of CACS for OCPs. CACS, coronary artery calcium score; NPV, negative predictive value; OCP, obstructive coronary plaque; PPV, positive predictive value.
Table 2 Comparison of clinical characteristics according to the presence of OCPs Obstructive CAD negative (n= 299) Obstructive CAD positive (n= 29) P Age (years) 53± 9 59± 9 0.001 Men [n (%)] 225 (75) 27 (93) 0.030 BMI (kg/m2) 25.1± 3.1 25.0± 3.5 0.797 Obesity [n (%)] 135 (45) 16 (55) 0.301 Hypertension [n (%)] 116 (39) 13 (45) 0.526 Dyslipidemia [n (%)] 176 (59) 20 (69) 0.289 Current smoking [n (%)] 97 (32) 13 (45) 0.177 Total cholesterol (mg/dl) 199± 37 202± 46 0.669 Triglyceride (mg/dl) 158± 97 172± 120 0.464 HDL (mg/dl) 51± 12 51± 14 0.829 LDL (mg/dl) 107± 29 108± 35 0.976 Creatinine (mg/dl) 1.1± 0.1 1.1± 0.2 0.859 Microalbuminuria [n (%)] 62 (23) 16 (57) < 0.001 GFR (ml/min/1.73 m2) 75± 9 79± 23 0.055 CACS> 33 58 (19) 24 (83) < 0.001 Data are expressed as n (%) or mean± SD.
CACS, coronary artery calcium score; CAD, coronary artery disease; GFR, glo-merular filtration rate; HDL, high-density lipoprotein; LDL, low-density lipoprotein; OCP, obstructive coronary plaque.
stratification in asymptomatic diabetic patients. However, the routine application of CCTA for CV risk assessment in asymptomatic individuals has not been recommended in clinical practice.
This study evaluated the association between CACS and obstructive CAD in asymptomatic patients with T2DM who had near-normal kidney function. A previous study reported that silent myocardial ischemia, as assessed by adenosine technetium-99m sestamibi single-photon emis-sion computed tomography myocardial perfuemis-sion imaging, occurred in more than one of five asymptomatic diabetic patients in a western population [19]. Obstructive CAD was found in 9% of the patients in the present study, which is relatively low compared with the incidence in the western population. This discrepancy might be associated with ethnic differences in the development and progres-sion of CAD and the evaluation method for obstructive CAD. Although 9% of the patients in this study had OCP, the occurrence of OCPs radically increased up to 36% in patients with a CACS greater than 100. It is noteworthy that in the patients of the present study almost all cases of OCPs were accompanied by calcification. In the present study, the optimal cutoff value of CACS for predicting obstructive CAD was 33. This cutoff value had a very high negative predictive value for obstructive CAD,∼ 98%, and a relatively high sensitivity and specificity for obstructive CAD in asymptomatic patients with T2DM. In particular, the predictive significance of a CACS of 33 for obstructive CAD improved after considering the status of micro-albuminuria and current smoking in asymptomatic patients with T2DM.
The identification of obstructive CAD might be impor-tant in asymptomatic diabetic patients. Stress testing and the provocation of inducible ischemia have been mainly used for identifying obstructive CAD but have limitations because of a diminished diagnostic accuracy compared with the gold standard of invasive coronary angiography. On the basis of data from the National Cardiovascular Data Registry, the rate of nonobstructive CAD identified by invasive coronary angiography was 59% in patients with a positive functional test results, and the rate of negative stress test results was as high as 28% in patients with obstructive CAD [20]. CCTA has been used as an alternative to conventional invasive coronary angiography for evaluating CAD because of its high diagnostic accu-racy for detecting coronary plaque [11–13]. However, CCTA is not recommended for the evaluation of CAD in patients with severe coronary calcification and morbid obesity because these factors may influence the image quality. Clinical features of patients with T2DM in Asia are different from those in other parts of the world, with T2DM developing in patients with much lower BMI in Asia compared with western countries [21]. In addition, most Korean individuals with T2DM are not obese, even with obesity defined as a BMI of more than 25 kg/m2[22]. Further, Nasiret al. [16] reported that the frequency of a CACS greater than 100 in the Asian population is sig-nificantly low compared with that in western populations. The mean CACS was 80± 241, and 14% of patients had CACS greater than 100 in the present study of asympto-matic patients with T2DM. Moreover, the mean BMI was 25.1±3.2 kg/m2 and 46% of the patients were obese, defined by a BMI of more than 25 kg/m2. Therefore, the use of CCTA based on CACS may be appropriate for evaluating obstructive CAD in asymptomatic Korean patients with T2DM who do not have significant dete-rioration of kidney function.
Previous studies have reported that chronic kidney dis-ease and traditional risk factors are associated with cor-onary calcification [23] and that urinary albumin excretion is significantly associated with coronary calci-fication in asymptomatic diabetic patients [24]. However, data on the association between microalbuminuria and
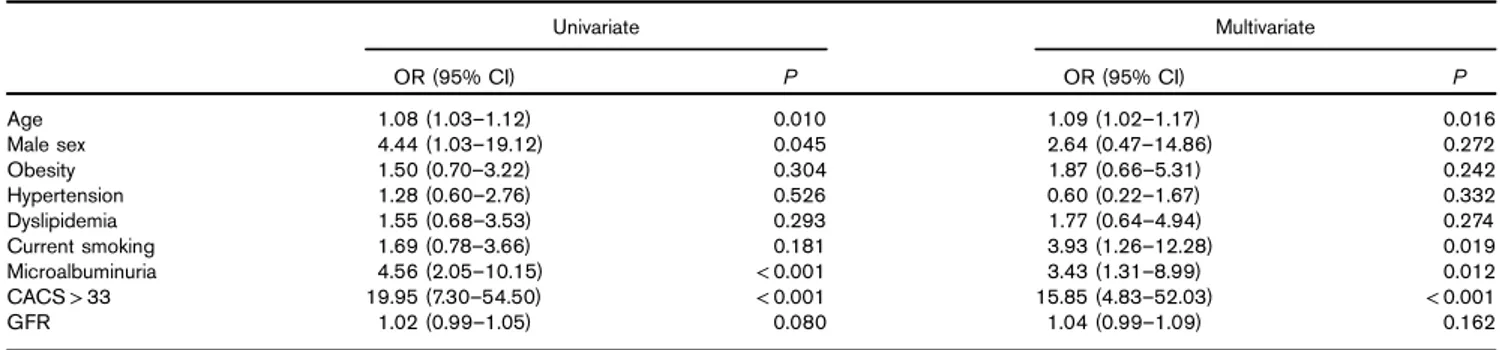
Table 3 Univariate and multivariate logistic regression analysis for identifying the determinants of OCPs
Univariate Multivariate OR (95% CI) P OR (95% CI) P Age 1.08 (1.03–1.12) 0.010 1.09 (1.02–1.17) 0.016 Male sex 4.44 (1.03–19.12) 0.045 2.64 (0.47–14.86) 0.272 Obesity 1.50 (0.70–3.22) 0.304 1.87 (0.66–5.31) 0.242 Hypertension 1.28 (0.60–2.76) 0.526 0.60 (0.22–1.67) 0.332 Dyslipidemia 1.55 (0.68–3.53) 0.293 1.77 (0.64–4.94) 0.274 Current smoking 1.69 (0.78–3.66) 0.181 3.93 (1.26–12.28) 0.019 Microalbuminuria 4.56 (2.05–10.15) < 0.001 3.43 (1.31–8.99) 0.012 CACS> 33 19.95 (7.30–54.50) < 0.001 15.85 (4.83–52.03) < 0.001 GFR 1.02 (0.99–1.05) 0.080 1.04 (0.99–1.09) 0.162 CACS, coronary artery calcium score; CI, confidence interval; GFR, glomerular filtration rate; OCP, obstructive coronary plaque; OR, odds ratio.
Table 4 Comparison of ROC models related to the cutoff value of CACS> 33 for predicting obstructive CAD
ROC models AUC (95% CI) CACS> 33 0.816 (0.740–0.892) CACS> 33 with microalbuminuria 0.862 (0.795–0.929)* CACS> 33 with microalbuminuria and current smoking 0.864 (0.782–0.945)†
AUC, area under the curve; CACS, coronary artery calcium score; CAD, coronary artery disease; CI, confidence interval; ROC, receiver operating characteristic. *P= 0.033 vs. CACS > 33.
obstructive CAD in asymptomatic diabetic patients with preserved renal function are scarce. The present study indicated that microalbuminuria is independently asso-ciated with obstructive CAD and that the predictive value of CACS for obstructive CAD significantly improved after considering the status of microalbuminuria in asympto-matic diabetic patients with near-normal kidney function. The identification of microalbuminuria status might be important when CACS is used as a screening tool for evaluating obstructive CAD in this patient population. The present study has some limitations. First, the asso-ciation between CACS and obstructive CAD might be different in asymptomatic diabetic patients according to ethnicity, considering the differences clinical features of T2DM between Asian and western populations. However, the present study included only a Korean population. Second, coronary calcification might be more pronounced in elderly and male patients. However, we did not evaluate the optimal cutoff CACS for obstructive CAD according to different age groups and sex because of the relatively small sample sizes in the present study. Finally, the present study was retrospective and may have been influenced by unobserved confounders and selection bias. Further pro-spective studies with larger sample sizes are required to address these issues.
Despite the limitations of the present study, it is unique in that we identified the association between CACS and OCPs in asymptomatic patients with T2DM who had preserved renal function in an Asian population. Considering that the clinical features of diabetic patients in an Asian population might be explicitly different from those in a western population [21], identification of the association between CACS and obstructive CAD in asymptomatic Asian diabetic patients might be important. The present study identified that CACS is a useful screening tool for evaluating obstructive CAD because noncalcified OCPs are extremely rare in asymptomatic Korean patients with T2DM who have near-normal kidney function.
Conclusion
Compared with calcified or mixed OCPs, noncalcified OCPs were scarcely observed in asymptomatic patients with T2DM. Considering the high negative predictive value of CACS for obstructive CAD, CACS may be used effectively as a gatekeeper for evaluating obstructive CAD using CCTA in asymptomatic Korean patients with T2DM who have near-normal kidney function. In addi-tion, consideration of the status of microalbuminuria and current smoking may be important for the evaluation of obstructive CAD on the basis of CACS in asymptomatic patients with T2DM.
Acknowledgements
This research was supported by the Leading Foreign Research Institute Recruitment Program through the National
Research Foundation of Korea, funded by the Ministry of Education, Science and Technology (2012027176).
Conflicts of interest
There are no conflicts of interest.
References
1 Grundy SM, Benjamin IJ, Burke GL, Chait A, Eckel RH, Howard BV, et al. Diabetes and cardiovascular disease: a statement for healthcare professionals from the American Heart Association. Circulation 1999; 100:1134–1146. 2 Bonow RO, Bohannon N, Hazzard W. Risk stratification in coronary artery
disease and special populations. Am J Med 1996; 101:4A17S–22S, discussion 22S–24S.
3 Nesto RW, Phillips RT, Kett KG, Hill T, Perper E, Young E, Jr Leland OS. Angina and exertional myocardial ischemia in diabetic and nondiabetic patients: assessment by exercise thallium scintigraphy. Ann Intern Med 1988; 108:170–175.
4 BARI Investigators. Seven-year outcome in the Bypass Angioplasty Revascularization Investigation (BARI) by treatment and diabetic status. J Am Coll Cardiol 2000; 35:1122–1129.
5 Agatston AS, Janowitz WR, Hildner FJ, Zusmer NR, Jr Viamonte M, Detrano R. Quantification of coronary artery calcium using ultrafast computed tomography. J Am Coll Cardiol 1990; 15:827–832.
6 Budoff MJ, Shaw LJ, Liu ST, Weinstein SR, Mosler TP, Tseng PH, et al. Long-term prognosis associated with coronary calcification: observations from a registry of 25,253 patients. J Am Coll Cardiol 2007; 49:1860–1870. 7 Detrano R, Guerci AD, Carr JJ, Bild DE, Burke G, Folsom AR, et al. Coronary
calcium as a predictor of coronary events in four racial or ethnic groups. N Engl J Med 2008; 358:1336–1345.
8 Greenland P, LaBree L, Azen SP, Doherty TM, Detrano RC. Coronary artery calcium score combined with Framingham score for risk prediction in asymptomatic individuals. JAMA 2004; 291:210–215.
9 Vliegenthart R, Oudkerk M, Hofman A, Oei HH, van Dijck W, van Rooij FJ, Witteman JC. Coronary calcification improves cardiovascular risk prediction in the elderly. Circulation 2005; 112:572–577.
10 Qu W, Le TT, Azen SP, Xiang M, Wong ND, Doherty TM, Detrano RC. Value of coronary artery calcium scanning by computed tomography for predicting coronary heart disease in diabetic subjects. Diabetes Care 2003; 26:905–910.
11 Budoff MJ, Dowe D, Jollis JG, Gitter M, Sutherland J, Halamert E, et al. Diagnostic performance of 64-multidetector row coronary computed tomographic angiography for evaluation of coronary artery stenosis in individuals without known coronary artery disease: results from the prospective multicenter ACCURACY (Assessment by Coronary Computed Tomographic Angiography of Individuals Undergoing Invasive Coronary Angiography) trial. J Am Coll Cardiol 2008; 52:1724–1732.
12 Miller JM, Rochitte CE, Dewey M, Arbab-Zadeh A, Niinuma H, Gottlieb I, et al. Diagnostic performance of coronary angiography by 64-row CT. N Engl J Med 2008; 359:2324–2336.
13 Hoffmann MH, Shi H, Schmitz BL, Schmid FT, Lieberknecht M, Schulze R, et al. Noninvasive coronary angiography with multislice computed tomography. JAMA 2005; 293:2471–2478.
14 Rana JS, Dunning A, Achenbach S, Al-Mallah M, Budoff MJ, Cademartiri F, et al. Differences in prevalence, extent, severity, and prognosis of coronary artery disease among patients with and without diabetes undergoing coronary computed tomography angiography: results from 10,110 individuals from the CONFIRM (COronary CT Angiography EvaluatioN For Clinical Outcomes): an InteRnational Multicenter Registry. Diabetes Care 2012; 35:1787–1794.
15 Greenland P, Alpert JS, Beller GA, Benjamin EJ, Budoff MJ, Fayad ZA, et al. American College of Cardiology Foundation; American Heart Association. 2010 ACCF/AHA guideline for assessment of cardiovascular risk in asymptomatic adults: a report of the American College of Cardiology Foundation/American Heart Association Task Force on Practice Guidelines. J Am Coll Cardiol 2010; 56:e50–e103.
16 Nasir K, Shaw LJ, Liu ST, Weinstein SR, Mosler TR, Flores PR, et al. Ethnic differences in the prognostic value of coronary artery calcification for all-cause mortality. J Am Coll Cardiol 2007; 50:953–960.
17 Levey AS, Coresh J, Balk E, Kausz AT, Levin A, Steffes MW, et al. National Kidney Foundation. National Kidney Foundation practice guidelines for chronic kidney disease: evaluation, classification, and stratification. Ann Intern Med 2003; 139:137–147.
18 National Kidney Foundation. K/DOQI clinical practice guidelines for chronic kidney disease: evaluation, classification, and stratification. Am J Kidney Dis 2002; 39:S1–S266.
19 Wackers FJ, Young LH, Inzucchi SE, Chyun DA, Davey JA, Barrett EJ, et al. Detection of Ischemia in Asymptomatic Diabetics Investigators. Detection of silent myocardial ischemia in asymptomatic diabetic subjects: the DIAD study. Diabetes Care 2004; 27:1954–1961.
20 Patel MR, Peterson ED, Dai D, Brennan JM, Redberg RF, Anderson HV, et al. Low diagnostic yield of elective coronary angiography. N Engl J Med 2010; 362:886–895.
21 Yoon KH, Lee JH, Kim JW, Cho JH, Choi YH, Ko SH, et al. Epidemic obesity and type 2 diabetes in Asia. Lancet 2006; 368:1681–1688.
22 Park JY, Lee KU, Kim CH, Kim HK, Hong SK, Park KS, et al. Past and current obesity in Koreans with non-insulin-dependent diabetes mellitus. Diabetes Res Clin Pract 1997; 35:49–56.
23 Nakamura S, Ishibashi-Ueda H, Niizuma S, Yoshihara F, Horio T, Kawano Y. Coronary calcification in patients with chronic kidney disease and coronary artery disease. Clin J Am Soc Nephrol 2009; 4:1892–1900.
24 Yamagami K, Hosoi M, Yamamoto T, Fukumoto M, Yamakita T, Miyamoto M, et al. Coronary arterial calcification is associated with albuminuria in type 2 diabetic patient. Diabetes Obes Metab 2005; 7:390–396.
![Table 2 Comparison of clinical characteristics according to the presence of OCPs Obstructive CAD negative (n = 299) Obstructive CADpositive (n= 29) P Age (years) 53 ± 9 59 ± 9 0.001 Men [n (%)] 225 (75) 27 (93) 0.030 BMI (kg/m 2 ) 25.1 ± 3.1 25.0 ± 3.5 0.7](https://thumb-ap.123doks.com/thumbv2/123dokinfo/5073874.72358/4.880.62.423.761.1037/comparison-clinical-characteristics-according-obstructive-negative-obstructive-cadpositive.webp)