231
The effect of fentanyl pretreatment on propofol sedation during
spinal anesthesia
Department of Anaesthesiology and Pain Medicine and Pain Research Institute, Yonsei University College of Medicine, Seoul, Korea
Myoung Hwa Kim, and Jung Ik Byun
Received: May 14, 2013.
Revised: 1st, June 4, 2013; 2nd, July 25, 2013; 3rd, July 30, 2013. Accepted: July 30, 2013.
Corresponding author: Myoung Hwa Kim, M.D., Department of Anaesthe-siology and Pain Medicine and Pain Research Institute, Yonsei University, College of Medicine, 250, Seongsan-ro, Seodaemun-gu, Seoul 120-752, Korea. Tel: 82-2-2227-3548, Fax: 82-2-312-7185, E-mail: [email protected] This article is a Master's Thesis by Myoung Hwa Kim.
Background: To test whether propofol with fentanyl pretreatment produces better sedative efficacy than that of propofol alone in patients under spinal anesthesia.
Methods: Fifty-four patients undergoing lower leg orthopedic surgery were sedated randomly with propofol-normal saline (PN, n = 27) or propofol-fentanyl (PF, n = 27). In both groups, sedation was maintained with an initial loading dose of propofol 0.4 mg/kg, and subsequent infusion at a rate of 50 μg/kg/min. Prior to propofol administration, normal saline 0.02 ml/kg or fentanyl 1 μg/kg was given intravenously to Group PN and Group PF, respectively. We measured bispectral index (BIS) and the Observer’s Assessment of Alertness/ Sedation (OAA/S) scale scores to investigate sedative efficacy, prior to and at 5 minute intervals for 1 hour after propofol infusion.
Results: BIS and OAA/S scores were decreased in both groups over time after starting propofol infusion (P < 0.0001). Comparison between the PF group and the PN group at each time point did not demonstrate statistically significant differences, and group effect was also not found to be statistically significant for BIS and OAA/S [BIS, P = 0.4644 (group effect), P = 0.7817 (time*group interaction)], [OAA/S scale, P = 0.4373 (group effect), P = 0.125 (time*group interaction)].
Conclusions: Judging from the BIS and OAA/S scores, propofol with fentanyl pretreatment did not produce an additional sedative effect compared to propofol alone in spinal anesthesia. (Anesth Pain Med 2013; 8: 231-236)
Key Words: BIS, Fentanyl, OAA/S scale, Propofol, Sedation, Spinal anesthesia.
INTRODUCTION
Patients undergoing surgery with regional anesthesia tend to
manifest anxiety, as patients who remain conscious during surgery are likely to become more alert when hearing the noises of the surgical equipment and the conversations of the surgical team. In addition, the patients must remain in a certain position for the duration of the surgery, and this can cause discomfort. The surgery itself also tends to cause stress. Hence, anxiolysis while they are under regional anesthesia, as sedation during surgery can lead to greater treatment tolera-bility. For these reasons, anesthesiologists use a number of intravenous anesthetics during regional anesthesia for the sedation of patients. Among these anesthetics, propofol has sedative, amnestic, and anxiolytic effects [1], and it is used during regional anesthesia to maintain sedation [2] due to its fast metabolism and the rapid recovery from sedation it provides [3]. In addition, opioids such as fentanyl, although they are analgesics, are often used in combination with propofol [4] because combining analgesics and sedatives can have a synergistic effect on sedation. Appropriate maintenance of sedation under regional anesthesia through the administration of the minimum effective dose of an IV sedative is important in order to reduce the anxiety and stress of surgery while also avoiding possible side effects of IV sedation, such as hypotension and respiratory depression.
Thus, it is necessary to assess the level of sedation while it is maintained in order to administer an adequate sedative dose, and various methods are used to that end. Among these methods, the bispectral index (BIS), which is part of the electroencephalogram (EEG) that analyzes brainwave data, has been employed as a simple and sensitive monitoring method that focuses on the sedative and hypnotic effect of anesthesia [5-7]. The BIS is widely used as an assessment tool, especially in measurement of the degree of consciousness during sedation induced by propofol [8]. The Observer's Assessment of Alertness/Sedation (OAA/S) scale developed by
Chernik et al. [9] can also be used to directly assess the level of sedation in patients.
The combination of propofol and fentanyl after regional anesthesia is frequently used to induce and maintain sedation and analgesia in patients, but there is controversy over the pharmacokinetic effect when these drugs are used together. It seems that there is interaction between propofol and fentanyl, and fentanyl can reduce the dose of propofol for loss of consciousness [10]. However, there is a great deal of controversy over the response to the use of a low-dose opioid for sedation [11], and it has been reported that a low-dose opioid rarely affects the BIS when used with propofol [12].
Therefore, this study was conducted to measure the BIS and OAA/S scale scores when propofol is used alone and when it is uesd in combination with fentanyl in order to determine whether there is an extra sedative effect from their combined use after spinal anesthesia.
MATERIALS AND METHODS
The chief investigator prepared the agents according to the selected randomized table, and investigators who were not involved in agent preparation recorded the OAA/S and BIS in study subjects. The double-blind restriction was lifted if the patient withdrew from the study, and the next patient was classified into a group while blinded by using the randomized table.
The study included 54 adult male patients between the ages of 20 and 50 years who underwent orthopedic lower limb surgery from September to December 2011 and who fell into the American Society of Anesthesiologists classes 1 and 2. Patients with a body mass index greater than 30, a history of antipsychotic medication use, a history of hypnotic dependence, cardiopulmonary disease, abnormal liver or kidney function, or neurologic disorder were excluded as they were not appropriate to the purpose of the study.
The patients were randomized to propofol-normal saline (PN) or propofol-fentanyl (PF), with 27 patients in each group, and sedation was induced after spinal anesthesia. To monitor the patients’ vital signs in the operating room, monitoring tools such as a non-invasive blood pressure machine, electrocardio-gram, and pulse oximeter were set up, and anesthesia was initiated after vital sign stability had been confirmed. Spinal anesthesia was performed with a 25 G Quincke spinal puncture needle in a lateral decubitus position, where the leg undergoing surgery was placed underneath the other leg. A hyperbaric
solution of 0.5% bupivacaine 12–16 mg was then admini-stered, and the appropriate sensory deprivation level of below T8 for the orthopedic lower limb surgery was confirmed after 20 minutes of administration. To prevent the lowering of blood pressure, 10 ml/kg of a colloid solution was intravenously administered 1 hour prior to the anesthesia, and oxygen 3 L/min was administered via nasal prongs. The part of the forehead to be used for the attachment of the BIS (BIS VISTATM Monitoring System, Aspect Medical Systems Inc., Boston, MA, USA) sensor electrodes was swabbed with cotton soaked in alcohol. Then 4 electrodes were attached to the forehead and left lateral canthus, and the BIS values were measured to monitor the level of sedation. For measurement of the OAA/S scale, the patients’ responses were monitored using 4 different approaches and then converted into scores. The scores were determined in part based on observation of the patient’s’ facial expressions, an eye shapes.
Sedation was induced 10 minutes prior to the surgery, with the continuous intravenous administration of propofol through a syringe pump (Terumo Japan TerufusionⓇ Syringe Pump TE-331, Tokyo, Japn). To prevent the vascular pain that propofol can cause, lidocaine 40 mg was mixed with propofol and administered. A loading dose of 0.4 mg/kg of propofol was initially administered via intravenous infusion, with an infusion rate of 50 μg/kg/min. In the PN group (n = 27), propofol was administered followed by an intravenous bolus of normal saline 0.02 ml/kg, and in the PF group (n = 27), propofol was administered followed by an intravenous bolus of fentanyl 1 μg/ kg (1 μg/kg = 0.02 ml/kg). The measurements of the BIS and OAA/S scale scores were initiated prior to the administration of propofol in both groups and were taken every 5 minutes; thus, measurements were recorded after 0, 5, 10, 15, 20, 25, 30, 35, 40, 45, 50, 55, and 60 minutes.
This study received approval from the Institutional Review Board, and informed consent was obtained from all of the study subjects prior to their participation. The SAS program (Version 9.2, SAS Institute Int., Cary, NC, USA) was used for statistical analysis, and all of the measurements were presented in the form of mean ± SD or median ± range. The compa-rison of age, weight, height, duration of surgery, heart rate, and average blood pressure between the PN and PF groups was performed through two sample t-tests, and the comparison of the BIS and the OAA/S scale according to the time frame between the two groups was performed through repeated measures ANOVA. The Bonferroni and Tukey methods were used for the back testing, and statistical significance was
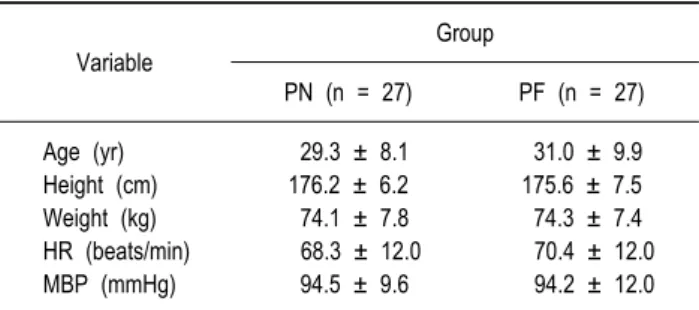
Table 1. Demographic Characteristics of the Patients Variable Group PN (n = 27) PF (n = 27) Age (yr) Height (cm) Weight (kg) HR (beats/min) MBP (mmHg) 29.3 ± 8.1 176.2 ± 6.2 74.1 ± 7.8 68.3 ± 12.0 94.5 ± 9.6 31.0 ± 9.9 175.6 ± 7.5 74.3 ± 7.4 70.4 ± 12.0 94.2 ± 12.0 Values are mean ± SD. n: number of patients. PN: propofol-normal saline sedation group, PF: propofol-fentanyl sedation group, HR: heart rate, MBP: mean blood pressure. There are no significant differences between groups.
Table 2. BIS Score
Group Time (min)
0 5 10 15 20 25 30 35 40 45 50 55 60 PN PF 96.7 ± 2.2 96.7 ± 2.2 91.6 ± 4.5 89.3 ± 5.9 88.4 ± 5.7 87.2 ± 8.5 86.2 ± 7.0 85.2 ± 10 85 ± 7.4 86.4 ± 7.4 82.7 ± 7.4 83.8 ± 8.7 81.3 ± 10.4 84 ± 7.0 80 ± 12.3 82.2 ± 8.5 77.5 ± 15.3 82 ± 9.1 78 ± 12.7 80.3 ± 9.8 77 ± 13.3 80.1 ± 8 75.6 ± 12.6 79 ± 10.1 76.9 ± 12.4 79.1 ± 9.2 Values are mean ± SD. The changes of BIS score in the two groups. The BIS score of propofol-normal saline (PN) group and propofol-fentanyl group (PF) are constantly decreased, but there is no significant difference in BIS score changes between two groups during sedation. BIS: bispectral index.
defined as having a P value of less than 0.05.
RESULTS
There was no significant difference between the PN and PF groups according to patients’ age, weight, height, heart rate, and mean arterial pressure (Table 1). In the PN group, the BIS was measured every 5 minutes from the start of propofol administration.
Prior to the administration of propofol in PN group, the BIS value was 96.7 ± 2.2, dropping to 91.6 ± 4.5 at 5 minutes and 88.4 ± 5.7 at 10 minutes; the reduction in the measure-ments was significant. In addition, a significant reduction continued to be observed thereafter. There was also a signi-ficant reduction in BIS measurements in the PF group, as the BIS value prior to propofol and fentanyl administration was 97.0 ± 2.2, while the subsequent measurements were 89.3 ± 5.9 at 5 minutes and 87.2 ± 8.5 at 10 minutes. In addition, as in the PN group, a significant reduction in BIS measurements over time continued to be noticed in the PF group (P <
0.0001) (Table 2).
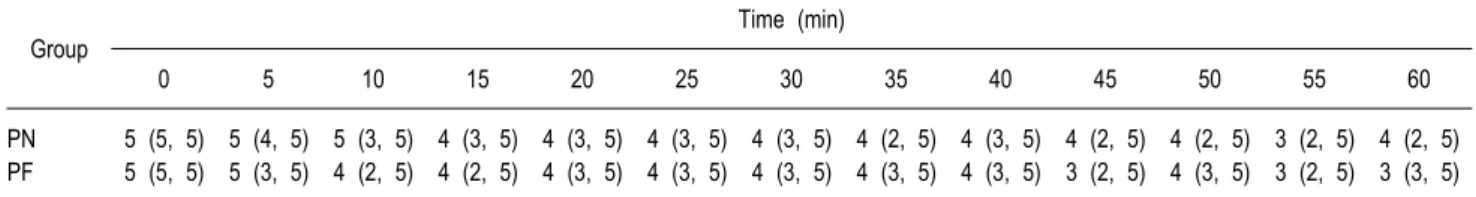
The OAA/S scale score in the PN group was 5 prior to the administration of propofol, and it was measured every 5 minutes thereafter. As time passed, the reduction in the scale scores became significant. In the PF group, the OAA/S scale score was 5 prior to the administration of propofol and fentanyl-identical to the PN group-and a reduction in the measurements was also subsequently observed: As time passed, the reduction in the scale scores became significant (P < 0.0001) (Table 3).
Based on these results, the reduction in the BIS and OAA/S scale scores according to the time frame was significant regardless of the group. However, there were no significant differences in the BIS and OAA/S scale scores between the two groups when the comparison was made at each point in time, and the effect of the two groups with regard to the BIS and OAA/S scale scores was not significant (BIS, P = 0.782 [the difference between the two groups at each point in time], P = 0.464 [the effect of groups]), (OAA/S scale, P = 0.125 [the difference between the two group at each point in time], P = 0.437 [the effect of groups]).
DISCUSSION
Spinal anesthesia, one of the methods of regional anesthesia, is known to have a sedative effect itself [13,14], but this effect is only meaningful for the reduction of the required amount of sedatives; it is necessary to use various medications to induce sedation after spinal anesthesia [15]. Among these, propofol is widely used for the induction of anesthesia and sedation, as it produces gradual sedative effects, induces predictable amnesia, has a low risk of side effects, and provides rapid recovery [1,3]. When propofol is used for sedation in healthy individuals, less than half of the amount
Table 3. OAA/S Score
Group Time (min)
0 5 10 15 20 25 30 35 40 45 50 55 60 PN PF 5 (5, 5) 5 (5, 5) 5 (4, 5) 5 (3, 5) 5 (3, 5) 4 (2, 5) 4 (3, 5) 4 (2, 5) 4 (3, 5) 4 (3, 5) 4 (3, 5) 4 (3, 5) 4 (3, 5) 4 (3, 5) 4 (2, 5) 4 (3, 5) 4 (3, 5) 4 (3, 5) 4 (2, 5) 3 (2, 5) 4 (2, 5) 4 (3, 5) 3 (2, 5) 3 (2, 5) 4 (2, 5) 3 (3, 5) Values are median (range). The changes of OAA/S in the two groups. The OAA/S of propofol-normal saline (PN) group and propofol-fentanyl group (PF) are constantly decreased, but there is no significant difference in OAA/S changes between two groups during sedation. OAA/S: Observer's Assessment of Alertness/Sedation.
required for general anesthesia is needed; if the continuous infusion rate is set to 0.5–4 mg/kg/h, a satisfactory result will be obtained. The use of a loading dose of 0.2–0.7 mg/kg followed by continuous intravenous infusion would induce dose-dependent sedation and loss of consciousness under regional anesthesia [1]. Opioids can also be used for sedation even though their primary uses are as analgesics. As there are various types of opioids, these can be used on an as-needed basis. Among the opioids, fentanyl is frequently used because of the convenience of its bolus administration and its fine effect on pain and sedation. In general, a dose of 1–3 μg/kg is administered intravenously for short-term pain relief [16].
There are a number of ways to measure the level of sedation after its induction in a patient. Most of the measuring tools that have been developed and used are based on the EEG, such as the Narcotrend monitor (MonitorTechnik, Bad Bramstedt, Germany) [17], Patient State Index (PSI; Physio-metrix Inc., N. Billerica, MA, USA) [18], Entropy Module (S/5, Datex-Ohmeda Division, Instrumentarium Corp., Helsinki, Finland) [19], and the BIS [20]. Among these, the BIS-a monitoring tool for the effect of anesthesia on the brain-is the only one approved by the U.S. Food and Drug Administration. The BIS produces each value with statistical processing, using an algorithm invented and developed by Aspect Medical Systems [21]. The BIS expresses a value between 0 and 100, and it can be tracked and traced over time. It reflects sedation or hypnotic state caused by the loss of consciousness and recall, and depending on the value it can be categorized as “awake,” “sedation,” “light anesthesia,” “deep anesthesia,” or “excess anesthesia”; sedation occurs at values between 65 and 85 [22]. Ludbrook et al. [23] performed a study on the relationship between the concentration of propofol in the brain and the measurement of BIS and found that, even with the high chance of individual variation, the concentration of propofol and the measurement of BIS were observed to have a
close relationship. In addition, according to Glass et al. [8], the BIS provides a quantitative index for the possibility of recall and the level of sedation during propofol administration. A high BIS (93 ± 5, n = 106) caused better conservation of memory, and a lower BIS (70 ± 18, n = 214) caused insigni-ficant recall. Hence it presented the high predictability in relationship between BIS and effective propofol concentration, and BIS can be a useful tool to measure the level of sedation [24]. The OAA/S scale is a clinical scoring tool which is used to assess the level of sedation. To perform the assessment, the investigator calls out the patient’s name and observes the patient’s responses in 4 categories: tone of voice, pattern of speech, facial expression, and ocular response. The patient’s responses in these categories are then expressed as a score between 1 and 5, where 1 is the most sedated status [25]. In previous studies conducted to investigate the relationship between the OAA/S scale and the BIS, Lui et al. [7] reported that there is a relationship of 0.744 (Spearman's rho) between the BIS and the OAA/S scale in propofol-induced sedation in regional anesthesia patients. The patient was a non-responder when the OAA/S scale was 1 and the BIS was 75.6 ± 7.5, and when the BIS increased to 94.5 ± 2.9, all of the patients recovered from the sedation and were able to recall what had happened. Kang et al. [26] investigated the level of sedation in spinal anesthesia patients who were administered targeted concentrations of propofol, and reported a close relationship of 0.827 (Spearman’s rho) between the OAA/S scale and the BIS. These studies imply a close relationship between the BIS and the OAA/S scale; a decrease in BIS causes a decrease in the OAA/S scale, which provides evidence that the OAA/S scale can be used as a tool to measure the level of sedation.
To increase the effect of sedation after regional anesthesia, the combination of other intravenous anesthetics on top of propofol, midazolam, ketamine, or dexmedetomidine can induce deeper sedation. Although the combination of propofol and
fentanyl is frequently used for anesthesia and sedation, the relationship between propofol and opioids during the induction of unconsciousness remains controversial. Moffat et al. [11] reported that continuous IV infusion of fentanyl 1 μg/kg or alfentanil 5 μg/kg showed no significant effect on the induc-tion of anesthesia with propofol, but Short et al. [25] reported that the bolus administration of alfentanil led to a reduction in the amount of propofol required for the induction of unconsci-ousness. These results are based on the use of a combination of propofol and opioids to induce general anesthesia, which is not appropriate to apply for the induction of sedation after regional anesthesia. In related research on the BIS and fentanyl, BIS is not affected by the opioid concentration for pain relief (1–3 μg/kg), as opioids cause minimal sedation and amnesia at this concentration. Smith et al. [10] and Vuyk et al. [27] explained the relationship between propofol and fentanyl by placing greater emphasis on the inhibition of the response to skin incision than on the loss of consciousness. No studies had been conducted to determine whether a small dose of fentanyl could increase the sedative effect of propofol, despite the fact that the combination of propofol and fentanyl is frequently used clinically under regional anesthesia. There-fore, this study investigated which caused deeper sedation- propofol monotherapy or propofol combined with fentanyl-after spinal anesthesia with the use of the BIS and the OAA/S scale.
This study had limitations, however, such as the fact that the BIS used is easily affected by the type of anesthesia, the fact that it can be hard to predict desensitization of hemody-namic and exercise responses to detrimental stimulants [22], and the fact that it is hard to judge the patient’s response in an objective way using the OAA/S scale, which can yield different results with different investigators [9]. In addition, it should be considered that different results might be obtained by increasing the dose of propofol or fentanyl within the dose range for sedation, and this warrants further study.
In conclusion, our findings showed that a low dose of fentanyl pretreatment did not result in an additive effect on sedation with propofol after spinal anesthesia.
REFERENCES
1. Smith I, Monk TG, White PF, Ding Y. Propofol infusion during regional anesthesia: sedative, amnestic, and anxiolytic properties. Anesth Analg 1994; 79: 313-9.
2. MacKenzie N, Grant IS. Propofol for intravenous sedation.
Anaes-thesia 1987; 42: 3-6.
3. Smith I, White PF, Nathanson M, Gouldson R. Propofol. An update on its clinical use. Anesthesiology 1994; 81: 1005-43. 4. Mi WD, Sakai T, Singh H, Kudo T, Kudo M, Matsuki A.
Hypnotic endpoints vs. the bispectral index, 95% spectral edge frequency and median frequency during propofol infusion with or without fentanyl. Eur J Anaesthesiol 1999; 16: 47-52.
5. Sigl JC, Chamoun NG. An introduction to Bispectral analysis for the electroencephalogram. J Clin Monit 1994; 10: 392-404. 6. Bonhomme V, Plourde G, Meuret P, Fiset P, Backman SB.
Auditory steady-state response and bispectral index for assessing level of consciousness during propofol sedation and hypnosis. Anesth Analg 2000; 91: 1398-403.
7. Lui J, Singh H, White PF. Electroencephalogram bispectral analysis predicts the depth of midazolam-induced sedation. Anesthesilogy 1996; 84: 64-9.
8. Glass PS, Bloom M, Kearse L, Roscow C, Sebel P, Manberg P. Bispectral analysis measures sedation and memory effects of propofol, midazolam, isoflurane, and alfentanyl in healthy volunteers. Anesthesiology 1997; 86: 836-47.
9. Chernik DA, Gillings D, Laine H, Hendler J, Silver JM, Davidson AB, et al. Validity and reliablity of the observer's assessment of alertness/sedation scale: study with intravenous midazolam. J Clin Psychopharmacol 1990; 10: 244-51.
10. Smith C, McEwan AI, Jhaveri R, Wilkinson M, Goodman D, Smith LR, et al. The interaction of fentanyl on the Cp50 of propofol for loss of consciousness and skin incision. Anesthe-siology 1994; 81: 820-8.
11. Moffat AC, Murray AW, Fitch W. Opioid supplementation during propofol anaesthesia. The effects of fentanyl or alfentanil on propofol anaesthesia in day case surgery. Anaesthesia 1989; 44: 644-7.
12. Iselin-Chaves IA, Flaishon R, Sebel PS, Howell S, Gan TJ, Sigl J, et al. The effect of the interaction of propofol and alfentanil on recall, loss of consciousness, and the Bispectral Index. Anesth Analg 1998; 87: 949-55.
13. Pollock JE, Neal JM, Liu SS, Burkhead D, Polissar N. Sedation during spinal anesthesia. Anesthesiology 2000; 93: 728-34. 14. Gentili M, Huu PC, Enel D, Hollande J, Bonnet F. Sedation
depends on the level of sensory block induced by spinal anesthesia. Br J Anaesth 1998; 81: 970-1.
15. Ozkan-Seyhan T, Sungur MO, Senturk E, Karadeniz M, Basel A, Senturk M, et al. BIS guided sedation with propofol during spinal anesthesia: influence of anesthetic level on sedation requirement. Br J Anaesth 2006; 96: 645-9.
16. Gutstein HB, Akil H. Opioid analgesics. In: Goodman and Gilman's the pharmacologic basis of therapeutics, 10th ed. Edited by Hardman JG, Limbird LE: New York, McGraw-Hill. 2001, pp 569-619.
17. Kreuer S, Bruhn J, Larsen R, Grundmann U, Shafer SL, Wilhelm W. Application of Bispectral Index and Narcotrend Index to the measurement of the electroencephalographic effects of isoflurane with and without burst suppression. Anesthesiology 2004; 101: 847-54.
18. Dressler O, Schneider G, Stockmanns G, Kochs EF. Awareness and the EEG power spectrum: analysis of frequencies. Br J Anaesth 2004; 93: 806-9.
19. Vakkuri A, Yli-Hankala A, Talja P, Mustola S, Tolvanen-Laakso H, Sampson T, et al. Time frequency balanced spectral entropy as a measure of anesthetic drug effect in central nervous system during sevoflurane, propofol, and thiopental anesthesia. Acta Anaesthesiol Scand 2004; 48: 145-53.
20. Rosow C, Manberg PJ. Bispectral index monitoring. Anesthesiol Clin North America 2001; 19: 947-66.
21. Sandler NA. The use of bispectral analysis to monitor outpatient sedation. Anesth Prog 2000; 47: 72-83.
22. Singh H. Bispectral index (BIS) monitoring during propofol- induced sedation and anaesthesia. Eur J Anaesthesiol 1999; 16: 31-6.
23. Ludbrook GL, Visco E, Lam AM. Propofol: relation between brain concentrations, electroencephalogram, middle cerebral artery blood
flow velocity, and cerebral oxygen extraction during induction of anesthesia. Anesthesiology 2002; 97: 1363-70.
24. Lee JM, Lee SI, Lee JH, Lee SC. Effective dose of propofol for anesthetic induction in Korean. Anesth Pain Med 2007; 2: 206-10. 25. Short TG, Plummer JL, Chui PT. Hypnotic and anaesthetic interactions between midazolam, propofol and alfentanil. Br J Anaesth 1992; 69: 162-7.
26. Kang JG, Lee SM, Lim SW, Chung IS, Hahm TS, Kim JK, et al. Correlation of AEP, BIS and OAA/S scores under stepwise sedation using propofol TCI in orthopedic patients undergoing total knee replacement arthroplasty under spinal anesthesia. Korean J Anesthesiol 2004; 46: 284-92.
27. Vuyk J, Lim T, Engbers FH, Burm AG, Vletter AA, Bovill JG. The pharmacodynamic interaction of propofol and alfentanil during lower abdominal surgery in women. Anesthesiology 1995; 83: 8-22.