저작자표시-비영리-변경금지 2.0 대한민국 이용자는 아래의 조건을 따르는 경우에 한하여 자유롭게 l 이 저작물을 복제, 배포, 전송, 전시, 공연 및 방송할 수 있습니다. 다음과 같은 조건을 따라야 합니다: l 귀하는, 이 저작물의 재이용이나 배포의 경우, 이 저작물에 적용된 이용허락조건 을 명확하게 나타내어야 합니다. l 저작권자로부터 별도의 허가를 받으면 이러한 조건들은 적용되지 않습니다. 저작권법에 따른 이용자의 권리는 위의 내용에 의하여 영향을 받지 않습니다. 이것은 이용허락규약(Legal Code)을 이해하기 쉽게 요약한 것입니다. Disclaimer 저작자표시. 귀하는 원저작자를 표시하여야 합니다. 비영리. 귀하는 이 저작물을 영리 목적으로 이용할 수 없습니다. 변경금지. 귀하는 이 저작물을 개작, 변형 또는 가공할 수 없습니다.
碩士學位論文
인산석고가 제주도 화산회토양의
pH,
Calcium,
Sulfur
및
Aluminium에
미치는 영향
濟州大學校 大學院
農 學 科
玄
咏 訓
i
iii
1
-Ⅱ. 재료 및 방법
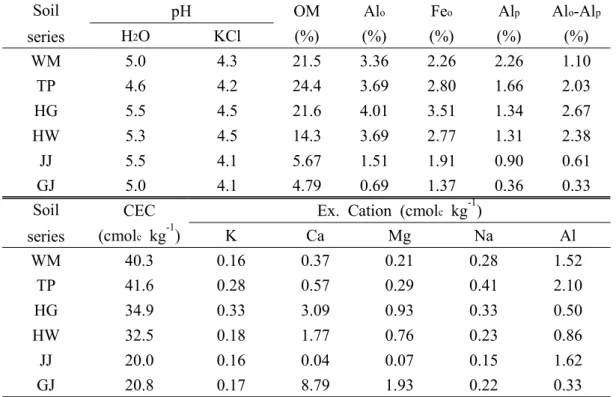
Table 1. Chemical properties of the soil before experiment. Soil series pH OM Alo Feo Alp Alo-Alp H2O KCl (%) (%) (%) (%) (%) WM 5.0 4.3 21.5 3.36 2.26 2.26 1.10 TP 4.6 4.2 24.4 3.69 2.80 1.66 2.03 HG 5.5 4.5 21.6 4.01 3.51 1.34 2.67 HW 5.3 4.5 14.3 3.69 2.77 1.31 2.38 JJ 5.5 4.1 5.67 1.51 1.91 0.90 0.61 GJ 5.0 4.1 4.79 0.69 1.37 0.36 0.33 Soil series
CEC Ex. Cation (cmolc kg-1)
(cmolc kg-1) K Ca Mg Na Al WM 40.3 0.16 0.37 0.21 0.28 1.52 TP 41.6 0.28 0.57 0.29 0.41 2.10 HG 34.9 0.33 3.09 0.93 0.33 0.50 HW 32.5 0.18 1.77 0.76 0.23 0.86 JJ 20.0 0.16 0.04 0.07 0.15 1.62 GJ 20.8 0.17 8.79 1.93 0.22 0.33
5
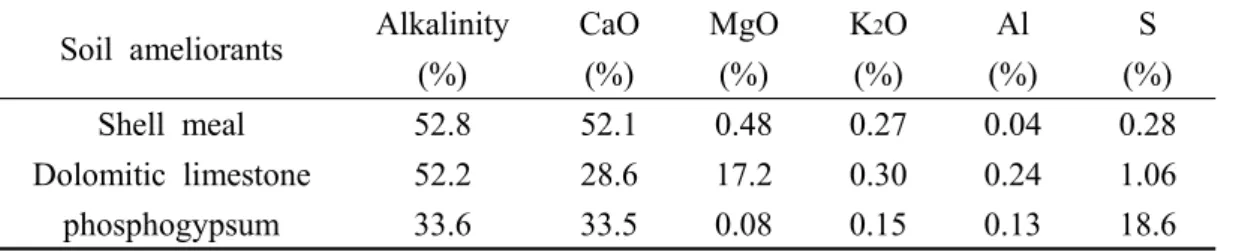
-Table 2. Available chemical components of the soil ameliorants used in this experiments.
Soil ameliorants Alkalinity CaO MgO K2O Al S
(%) (%) (%) (%) (%) (%)
Shell meal 52.8 52.1 0.48 0.27 0.04 0.28 Dolomitic limestone 52.2 28.6 17.2 0.30 0.24 1.06 phosphogypsum 33.6 33.5 0.08 0.15 0.13 18.6
7
WM TP HG HW JJ GJ Wa te r pH 0 2 4 6 8 WM TP HG HW JJ GJ KC l p H 0 2 4 6 8
Fig. 1. Soil pH (H2O and KCl) after soil ameliorant treatment. The results of a
two-way ANOVA showed significant difference in the water pH and KCl pH values both among soil ameliorant treatments and among soils (p<0.01).
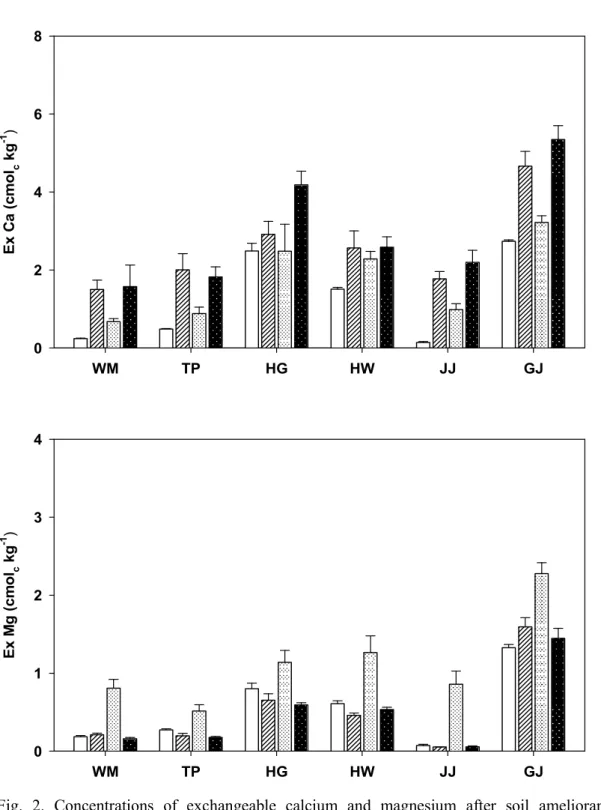
-WM TP HG HW JJ GJ Ex C a (c m o lc kg -1 ) 0 2 4 6 8 WM TP HG HW JJ GJ Ex M g ( c m o lc k g -1 ) 0 1 2 3 4
Fig. 2. Concentrations of exchangeable calcium and magnesium after soil ameliorant treatment. The results of a two-way ANOVA showed significant difference in the concentrations of exchangeable calcium and magnesium values both among soil ameliorant treatments and among soils (p<0.01).
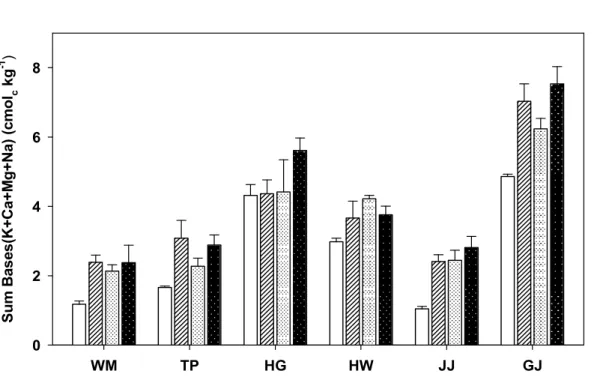
11 -WM TP HG HW JJ GJ S u m Bas es (K+ Ca+ M g+ Na) ( cmol c kg -1 ) 0 2 4 6 8
Fig. 3. Concentration of sum of exchangeable cation after soil ameliorant treatment. The results of a two-way ANOVA showed significant difference in the sum of exchangeable cation values both among soil ameliorant treatments and among soils (p<0.01).
13 -WM TP HG HW JJ GJ E x. A l ( c m o lc kg -1 ) 0.0 0.5 1.0 1.5 2.0 2.5 WM TP HG HW JJ GJ A l Sa tu rat io n ( % ) 0 10 20 30 40 50 60 70
Fig. 4. Concentrations of exchangeable aluminium and aluminium saturation after soil ameliorant treatment. The results of a two-way ANOVA showed significant difference in the concentrations of exchangeable aluminium and aluminium saturation values both among soil ameliorant treatments and among soils (p<0.01).
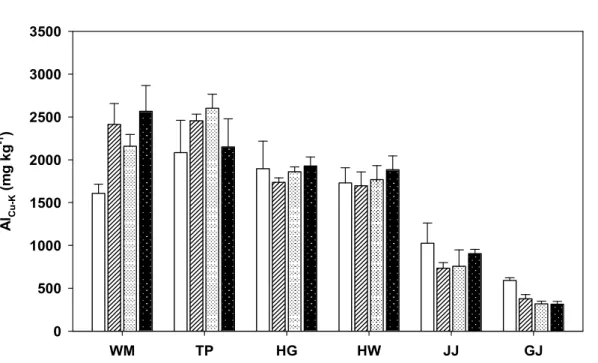
WM TP HG HW JJ GJ AlCu-K ( m g kg -1 ) 0 500 1000 1500 2000 2500 3000 3500
Fig. 5. Concentration of exchangeable aluminium(Cu-K) after soil ameliorant treatment. The results of a two-way ANOVA showed no significant difference in the concentration of exchangeable aluminium(Cu-K) values among soil ameliorant treatments (p<0.01), but there was a significant difference in the concentration of exchangeable aluminium(Cu-K) values among soils (p<0.01).
-WM TP HG HW JJ GJ Exch an g eab le S (m g /k g ) 0 50 100 150 200 250 300 WM TP HG HW JJ GJ Ex tract ab le - Exch an g e ab le S (m g /k g ) 0 100 200 300 400 500
Fig. 6. Concentrations of exchangeable sulfur and absorbed sulfur after soil ameliorant treatment. The results of a two-way ANOVA showed significant difference in the concentrations of exchangeable sulfur and absorbed sulfur values both among soil ameliorant treatments and among soils (p<0.01).
17