Jeong-Hyeon Ko1, Eun-Hee Jang1,2, Chang-Shin Park1, Hyoung-Kwang Kim1, Soon Gu Cho3, Dong Wun Shin4,
Hyeon Gyu Yi5& Ju-Hee Kang1,2
1Department of Pharmacology and Medicinal Toxicology Research Center, Center for Advanced Medical Education, Inha University College of Medicine by BK-21 Project; Jungseok Building 6FL, 3-Ga, Shinheungdong, Jung-Gu, Incheon 400-712, Korea 2Inha University Hospital Clinical Trial Center; Jungseok Building 1FL, 3-Ga, Shinheungdong, Jung-Gu, Incheon 400-712, Korea 3Department of Radiology, Inha University Hospital,
Incheon 400-700, Korea
4Department of Emergency Medicine, Inje University Ilsan Paik Hospital, Gyeonggi-Do 411-706, Korea
5Department of Internal Medicine, Inha University Hospital, Incheon 400-700, Korea
Correspondence and requests for materials should be addressed to J. H. Kang ([email protected])
Accepted 10 November 2009
Abstract
(-)-Epigallocatechin-3-gallate (EGCG), a major
flavo-noid in green tea has multiple health benefits includ-ing chemoprevention, anti-inflammatory, anti-diabetic, and anti-obesity effects. In connection with these ef-fects, EGCG can be a candidate to help the treatment of metabolic diseases. Metformin is a widely used anti-diabetic drug regulating cellular energy homeo-stasis via AMP-activated protein kinase (AMPK) acti-vation. Therefore, the combination of metformin with EGCG may have additive or synergistic effects on treatment of type 2 diabetes. Nevertheless, there is no report for the pharmacokinetic and/or pharmaco-dynamic interaction of EGCG with metformin. Here, we evaluated the pharmacokinetic and pharmacody-namic interaction between metformin and EGCG in rats. Pharmacokinetics parameters of metformin were measured after oral administration of metformin in rats pre-treated with EGCG (10 mg/kg) or saline for 7 days. The results showed that there is no significant difference in pharmacokinetic parameters between saline control and EGCG-treated group. In addition,
the hepatic AMPK activation by metformin in EGCG-treated rats was also similar to the control. The lack of additive effects of EGCG on AMPK activation or intracellular uptake of metformin was also evaluated in cells in the presence or absence of EGCG. Treat-ment of HepG2 cells with EGCG inhibited the metfor-min-induced AMPK activation. Combined results sug-gested that EGCG has no effect on the pharmaco-kinetics of metformin but may contribute to metfor-min action.
Keywords: (-)-Epigallocatechin-3-gallate, Metformin, Pharmacokinetics, AMP-activated protein kinase
Metformin is widely used for the treatment of hyper-glycemia in patients with type 2 diabetes mellitus (T2DM). Metformin ameliorates hyperglycemia by reducing hepatic gluconeogenesis and by improving glucose utilization. The molecular mechanisms under-lying antidiabetic effects of metformin appear to be related to the activation of AMP-activated protein kinase (AMPK), which suppresses glucagon-stimulated glucose production and causes an increase in glucose uptake in muscle and in hepatic cells. Metformin is a substrate of organic cation transporters (OCTs). It has been reported that the OCT1 mediated the intestinal absorption and hepatic distribution of metformin in rats and mice1. OCT1 also is required for the antidia-betic efficacy of metformin2.
Green tea is one of the most widely consumed bev-erages worldwide. (-)-Epigallocatechin-3-gallate (EGCG), the major polyphenolic flavonoid in green tea, accounts for 50-80% of the tea catechins3. Among the many beneficial effects of EGCG4-6, it lowers the incidence of streptozotocin-induced diabetes and reduces body weight, body fat, and blood levels of glucose in fa/fa obese rats7,8. In addition, EGCG pro-tects pancreatic cells, enhances insulin activity, repress-es hepatic glucose production, reducrepress-es food uptake and absorption, stimulates thermogenesis and lipid excretion, and modulates insulin-leptin endocrine sys-tems7,9-13. Epidemiologically, it has been suggested that green tea consumption prevents T2DM14. It was also reported that EGCG possesses pronounced
anti-Pharmacokinetic and Pharmacodynamic Interaction between
diabetic efficacy in preclinical models of T2DM and suppress hepatic gluconeogenesis via AMPK activa-tion15.Thus, the combination of metformin and EGCG may have an additive or synergistic effect. Based on these backgrounds, we evaluated the pharmacokinetic and pharmacodynamic interaction between EGCG and metformin in the present study.
Effect of EGCG Pretreatment on the Oral Pharmacokinetics of Metformin
The plasma concentration-time curves of metformin after oral administration at a dose of 100 mg/kg, with or without EGCG pretreatment, are shown in Figure 1. The estimated pharmacokinetic parameters are
summarized in Table 1. The mean parameters of met-formin pharmacokinetics were very similar between control and EGCG-treated group. There were no sta-tistically significant differences in the plasma phar-macokinetic parameters of AUC, Cmax, Tmax, T1/2, oral CL, and Vdfor metformin (Table 1).
Effect of EGCG on AMPK Activation and OCT1 Expression in vivo
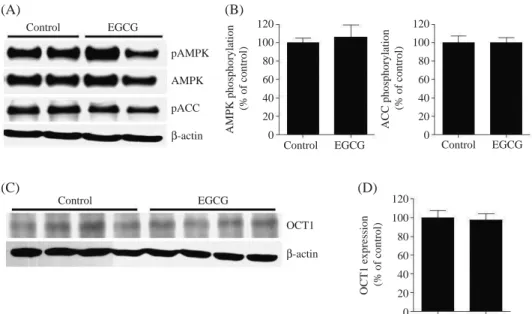
To assess the role of EGCG in metformin action in vivo, we examined the effects of metformin on AMPK activation in EGCG-treated rat liver tissues. Rats were intraperitoneally dosed with EGCG or vehicle (saline) for 7 days. One hour after intravenous administration of metformin, liver tissue was obtained for measure-ment of AMPK activation. After metformin treatmeasure-ment, phosphorylation of AMPK and ACC were not changed
Figure 1. The plasma concentration-time curves of
metfor-min after oral admetfor-ministration (100 mg/kg) in rats receiving EGCG (10 mg/kg, n==8) or saline (control group, n==9) for 7
days.
Table 1. Pharmacokinetic parameters of metformin in rat
plasma after metformin (100 mg/kg) oral administration with and without treatment of EGCG.
Group Parameter Control (n==9) EGCG (n==8) AUC (μg/h/mL) 28.95±5.60 27.28±4.33 Cmax(μg/mL) 5.79±1.65 5.23±0.99 Tmax(h) 2.67±0.97 2.50±0.76 T1/2(h) 3.57±0.81 3.81±0.81 Oral CL (mL/h) 3.56±0.64 3.74±0.56 Vd(L/kg) 18.35±5.61 20.40±4.03
Data are expressed as the mean±S.D. of 8 or 9 rats.
AUC: area under the plasma concentration-time curve, Cmax: maximal
peak plasma concentration, Tmax: time to reach peak concentration, T1/2: half-life, CL: clearance, Vd: volume of distribution.
Figure 2. Effect of EGCG
on the AMPK activation and OCT1 expression in rat liver. Rats were given EGCG (10 mg/kg, n==4) or saline
(con-trol group, n==4) for 7 days.
Rats were sacrificed 1 h after i.v. administration of metfor-min (100 mg/kg). (A) and (C): Representative blot of phos-pho-AMPK (Thr172), AMPK,
phospho-ACC (Ser79), OCT1
expression in rats treated with metformin and EGCG or saline. (B) and (D): Quantita-tion of phospho-AMPK (Thr172), AMPK,
phospho-ACC (Ser79), OCT1
expres-sion presented in (A) and (C).
Plasma metformin concentration
(ng/mL) 10000 1000 100 10 Control (n==9) EGCG (n==8) 0 5 10 15 20 25 Time (h) Control EGCG Control EGCG Control EGCG Control EGCG pAMPK AMPK pACC β-actin OCT1 β-actin Control EGCG AMPK phosphorylation (% of control) ACC phosphorylation (% of control)
OCT1 expression (% of control) 120 100 80 60 40 20 0 120 100 80 60 40 20 0 120 100 80 60 40 20 0 (A) (B) (C) (D)
significantly in EGCG-treated rat liver (Figure 2A and B). In addition, OCT1 expressions in EGCG-treated rat were also similar to those of the control (Figure 2C and D).
Effect of EGCG on Metformin-stimulated AMPK and ACC Phosphorylation in HepG2 Cells
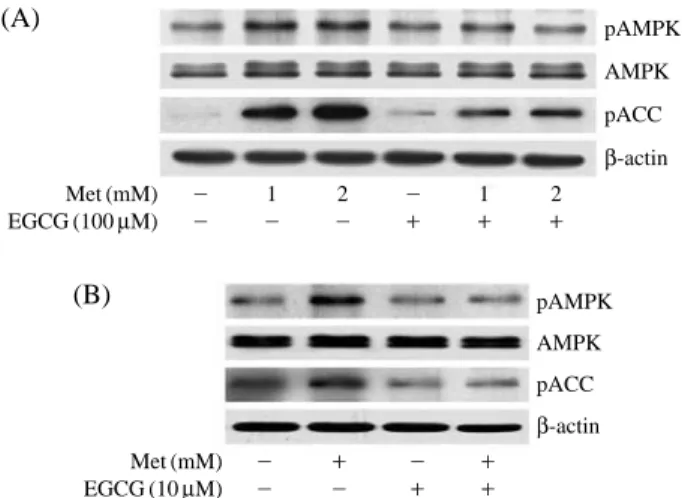
To understand the role of EGCG in metformin’s pharmacological effects, we examined the effect of EGCG on metformin-induced AMPK activation in HepG2 cells. As shown in Figure 3A, metformin (1 mM and 2 mM) stimulated phosphorylation of AMPK and ACC. EGCG (100μM) alone slightly increase the phosphorylation of AMPK and ACC. However, EGCG inhibited the activation of AMPK by metformin. Fur-thermore, we examined the effect of EGCG at lower concentration on AMPK activation. As shown in Fig-ure 3B, EGCG did not stimulate the phosphorylation of AMPK and ACC at 10μM. However, metformin-induced the phosphorylation of AMPK and ACC was also blocked by ECCG at 10μM.
Effect of EGCG Pretreatment on the Metformin Uptake in HT-29 Cells
We investigated the effect of EGCG on metformin uptake by human HT-29 intestinal tumor cells. The expression of OCT1 mRNA in the HT-29cells was confirmed by RT-PCR (data not shown). Triplicate experiments showed that pretreatment of EGCG (10-50μM) slightly decreased the metformin uptake in HT-29 cells. However, the uptake of metformin was slightly increased by the treatment of 100 and 200μM EGCG
(Figure 4). The increase or decrease of metformin up-take into the cells by EGCG did not reach the statisti-cal significance due to the limited number of group (n==3).
Discussion
The green tea flavonoid EGCG is one of several compounds that have been reported to have glucose-lowering properties in mammals7. The increasing popularity of EGCG and the prevalence of T2DM worldwide suggest that there is a strong possibility of the combination of diabetes medications with dietary supplements such as EGCG. Therefore, this study was designed to determine whether the combination of EGCG with metformin could alter pharmacokinetic parameters and therefore affect on the efficacy of met-formin.
Contrary to our expectation, our results show that it appears to be no important pharmacokinetic interaction between EGCG and metformin, although the possi-bility that EGCG may affect the pharmacokinetics of metformin in human still exists. EGCG are rapidly converted to metabolites through glucuronidation, sul-fation, methylation, and ring fission16, thus, the low bioavailability of EGCG may result in the lack of inter-action with metformin in our study.
Metformin, a known AMPK activator, shows its pharmacological effect in the liver. In the present study, the in vitro pharmacodynamic property of met-formin was confirmed by the AMPK activation in human HepG2 hepatocytes. Our results show that EGCG at 100μM slightly activates AMPK compared
Figure 3. Effect of EGCG on the metformin-induced AMPK
activation in HepG2 cells. Cells were treated with metformin (1 and 2 mM), EGCG (10 and 100μM), or metformin plus EGCG for 6 h. The phosphorylation of AMPK and ACC were assessed by western blot analysis.
Figure 4. Effect of EGCG on the metformin uptake in
HT-29 cells. Cells were pretreated with EGCG (10-200μM) for 30 min and then treated with metformin (1 mM) for 1 h. Data represent the mean±S.D. (n==3).
Met (mM) - 1 2 - 1 2 EGCG (100μM) - - - ++ ++ ++ Met (mM) - ++ - ++ EGCG (10μM) - - ++ ++ pAMPK AMPK pACC β-actin pAMPK AMPK pACC β-actin (A) (B) Metformin uptake (%) 160 140 120 100 80 60 40 20 0 0 10 20 50 100 200 EGCG (μM)
with the initial level, but does not activate at 10μM. Moreover, EGCG has an inhibitory effect on the met-formin induced-AMPK activation in HepG2 cells (Fig-ure 3). It was reported previously that EGCG activates AMPK15,19,20, and the activation of AMPK is asso-ciated with the inhibition of adipose differentiation and the apoptosis in colon cancer cells17,18. One of the disparities between our study and the previous stud-ies15,19,20is the different experimental conditions such as the high glucose condition and different cell culture model. Our results showed that metformin-induced activation of AMPK and ACC in livers of EGCG-treated rat was similar to those of control rat (Figure 2A and B). Furthermore, we did not observe a signifi-cant difference in the expression of OCT1 in the liver between control and EGCG-treated rat (Figure 2C and D). OCT1 plays the key role in metformin action2. Because the EGCG treatment was no effect on OCT1 expression, the effect of metformin on AMPK activa-tion may also similar in the liver. Another possible explanation is that EGCG was rapidly metabolized and therefore may not produce a significant effect in vivo in rats.
The absorption of metformin by intestinal epitheli-um may also contribute the metformin action. HT-29 cells express OCT1 that may be responsible for met-formin uptake. Metmet-formin uptake was increased by 100 and 200μM of EGCG (Figure 4), although we only found a trend without statistical significance. EGCG (2 mM) increased the uptake of model organic cation21. On the other hand, in lower concentrations, EGCG decreased the metformin uptake in HT-29 cells. The inhibition of metformin-induced AMPK activation by EGCG (10μM) in HepG2 cells may be a consequ-ence of the decrease of metformin uptake. However, our results showed that 100μM of EGCG also signifi-cantly inhibited activation of AMPK by metformin (Figure 3A), although EGCG (100μM) increased the uptake of metformin (Figure 4). Therefore, the inhibi-tory effect of EGCG on the metformin-induced AMPK activation is not related to the extent of uptake of met-formin via OCT1. Therefore, EGCG appears to inhibit the metformin-induced AMPK activation through other mechanisms distinct from metformin uptake. Further clinical studies are necessary to determine the effect of EGCG on metformin efficacy in healthy individuals or in patients with T2DM.
In conclusion, this study suggested that EGCG does not affect on the pharmacokinetics of metformin and hepatic AMPK activation by metformin in vivo. Al-though, EGCG inhibits the metformin-induced AMPK activation and modulates the intracellular accumula-tion of metformin in vitro, further clinical studies are necessary to conclude the pharmacodynamic
interac-tion between EGCG and metformin.
Materials & Methods
Chemicals and Cell Culture
EGCG and metformin were purchased from Sigma (St Louis, MO, USA). Primary antibodies against phos-pho-AMPK (Thr172), AMPK, phospho-ACC (Ser79) (Cell signaling Technology, Beverly, MA, USA), OCT1 (Santa Cruz Biotechnology, California, USA), and β-actin (Sigma, St Louis, MO, USA) were pur-chased commercially. Cell culture media and reagents were from Gibco-BRL (Grand Island, NY, USA). All other chemicals and solvents were of the highest grade or HPLC grade commercially available. The intestinal epithelial cell line HT-29 and human hepatoma cell line HepG2 were obtained from the American Type Culture Collection (Manassas, VA, USA) and grown in Dulbecco’s modified Eagle’s medium (DMEM) sup-plemented with 10% fetal bovine serum (FBS) and penicillin/streptomycin at 37�C in an atmosphere of 5% CO2.
Measurement of Cellular Metformin Uptake For metformin uptake study, HT-29 cells were seed-ed in 6-well plates at a density of 1×10⁶cells/well. After attachment, cells were pre-incubated for 30 min with EGCG and further exposed to metformin (1 mM) for 1 h. At the end of incubation, the medium was removed and the cells were washed twice in ice-cold PBS. The cells were lysed in PBS by sonication. Then, intracellular levels of metformin were determined by HPLC analysis of cell lysate.
Animals and Treatment
Male Sprague-Dawley rats (Japan SLC Inc., Shizuo-ka, Japan) weighting 250-380 g were used in this study. The animals were housed individually in a tempera-ture (22±2�C) - and humidity (30-40%) - controlled room under a 12 h light/dark cycle with free access to food and water. After acclimation for 1 week, the ani-mals were randomly divided into two groups. For EGCG-treated group (n==8), rats were administered
intraperitoneally with EGCG (10 mg/kg) for 7 days. EGCG dissolved in saline and freshly prepared daily. Control rats (n==9) received saline of same volume
with EGCG group. Rats were fasted overnight before the oral administration of metformin. Blood samples were collected from tail vein at 0.25, 0.5, 1, 1.5, 2, 3, 4, 8, 12, and 24 h after administration of a single dose of metformin (100 mg/kg). Metformin at doses of 100 mg/kg was also administered intravenously via the tail vein of rats treated with EGCG (n==4) or saline (n==4)
for 7 days, and blood samples were collected by car-diac puncture at 1 h after intravenous administration of metformin. Blood samples were centrifuged at 3,000 rpm for 10 min at 4�C. Plasma was stored at -70�C until HPLC analysis. Liver tissues were removed quickly, frozen in liquid nitrogen and kept at -70�C. This study was approved by the Animal Care and Han-dling Committee of Inha University (Incheon, South Korea).
HPLC analysis of Metformin
The concentrations of metformin in the plasma and cell lysate were determined by HPLC. Fifty micro-liters of samples were deproteinized with 100μL of acetonitrile. After vortex-mixing and centrifugation at 16,000×g for 10 min, the supernatant was injected
into a HPLC system (Shiseido Nanospace SI-2 HPLC; Tokyo, Japan). Metformin was separated using a Sho-dex ODP2 HP-2D column (150 mm×2.0 mm i.d.)
maintained at 35�C. The mobile phase was comprised of 10 mM KH2PO4: 10 mM K2HPO4(1 : 1) and ace-tonitrile at the ratio of 47.8 : 52.2 (v/v). The flow rate of the mobile phase was 0.2 mL/min. The mobile phase was filtered through a Millipore 0.45μm filter and degassed prior to use. The UV detector was set at 235 nm and connected to an S-MicroChrom chromato-graphic data system (Scientific Software, Shiseido, Tokyo, Japan). The sensitivity for the detection of metfromin (limit of quantification) was 50 ng/mL and there was linearity in range between 50-25,000 ng/mL. Determination of Pharmacokinetic
Parameters
The pharmacokinetic parameters were calculated using the BA Calc 2007 program22. The plasma con-centration-time curves were analyzed using Prims® Version 4.0 (GraphPad Software Inc., San Diego, CA, USA).
Western Blot Analysis
For the preparation of whole cell lysates, cells were washed with cold PBS and then scraped into ice-cold lysis buffer (10 mM sodium phosphate with pH 7.2, 1% Triton X-100, 1 mM NaF, 150 mM NaCl, 1 mM EDTA, 1 mM Na3VO4, 0.1% SDS, and protease inhibitors). Frozen liver tissues were homogenized in lysis buffer. Total protein extracts were obtained by centrifugation at 1,000×g for 10 min after sonication.
Protein contents were quantified using the BCA micro-protein assay kit (Pierce, Rockford, IL, USA). Fifteen micrograms of total protein were separated by 10% SDS-PAGE. After electrophoresis, proteins were trans-ferred electronically to PVDF membranes (Immobilon-P, Millipore). The membrane were blocked with 5%
bovine serum albumin in Tris-buffered saline (TBS) containing 0.1% Tween 20 (TBS-T) for 1 h at room temperature and incubated with specific primary anti-bodies overnight at 4�C. Unbound primary antibody was removed by washing with TBS-T and the mem-brane was incubated for 2 h at room temperature with the appropriate secondary antibodies conjugated with horseradish peroxidase (1 : 5,000-10,000). After wash-ing, the membrane were briefly incubated with a Pico-signal ECL system (Pierce, Rockford, IL, USA) and exposed to an X-ray film. Results were analyzed using Bio-Profil Bio1D software (Vilber Lourmat, Paris, France).
Statistical Analysis
Statistical analysis was performed using Prism version 4.0. Data are presented as means±standard
deviations (S.D.). Two-tailed Mann-Whitney U test was used to test a significant difference.
Acknowledgements
This work was supported by an Intramural Grant from Inha University.
References
1. Wang, D. S. et al. Involvement of organic cation trans-porter 1 in hepatic and intestinal distribution of met-formin. J Pharmacol Exp Ther302:510-515 (2002).
2. Shu, Y. et al. Effect of genetic variation in the organic cation transporter 1 (OCT1) on metformin action. J Clin Invest 117:1422-1431 (2007).
3. Graham, H. N. Green tea composition, consumption, and polyphenol chemistry. Prev Med 21:334-350 (1992).
4. Raederstorff, D. G., Schlachter, M. F., Elste, V. & Weber, P. Effect of EGCG on lipid absorption and plasma lipid levels in rats. J Nutr Biochem 14:326-332 (2003).
5. Choi, Y. B., Kim, Y. I., Lee, K. S., Kim, B. S. & Kim, D. J. Protective effect of epigallocatechin gallate on brain damage after transient middle cerebral artery occlusion in rats. Brain Res 1019:47-54 (2004). 6. Qanungo, S., Das, M., Haldar, S. & Basu, A.
Epigal-locatechin-3-gallate induces mitochondrial membrane depolarization and caspase-dependent apoptosis in pancreatic cancer cells. Carcinogenesis 26:958-967 (2005).
7. Kao, Y. H., Hiipakka, R. A. & Liao, S. Modulation of endocrine systems and food intake by green tea epigal-locatechin gallate. Endocrinology 141:980-987 (2000). 8. Kao, Y. H., Hiipakka, R. A. & Liao, S. Modulation of
1232-1234 (2000).
9. Dulloo, A. G. et al. Efficacy of a green tea extract rich in catechin polyphenols and caffeine in increasing 24-h energy expenditure and fat oxidation in 24-humans. Am
J Clin Nutr 70:1040-1045 (1999).
10. Liao, S., Kao, Y. H. & Hiipakka, R. A. Green tea: bio-chemical and biological basis for health benefits.
Vitam Horm 62:1-94 (2001).
11. Song, E. K., Hur, H. & Han, M. K. Epigallocatechin gallate prevents autoimmune diabetes induced by mul-tiple low doses of streptozotocin in mice. Arch Pharm
Res 26:559-563 (2003).
12. Anderson, R. A. & Polansky, M. M. Tea enhances insulin activity. J Agric Food Chem 50:7182-7186 (2002).
13. Waltner-Law, M. E. et al. Epigallocatechin gallate, a constituent of green tea, represses hepatic glucose pro-duction. J Biol Chem 277:34933-34940 (2002). 14. Iso, H. et al. The relationship between green tea and
total caffeine intake and risk for self-reported type 2 diabetes among Japanese adults. Ann Intern Med 144: 554-562 (2006).
15. Collins, Q. F. et al. Epigallocatechin-3-gallate (EGCG), a green tea polyphenol, suppresses hepatic gluconeo-genesis through 5′-AMP-activated protein kinase. J
Biol Chem 282:30143-30149 (2007).
16. Lambert, J. D. & Yang, C. S. Mechanisms of cancer prevention by tea constituents. J Nutr 133:3262S-3267S (2003).
17. Hwang, J. T. et al. Genistein, EGCG, and capsaicin inhibit adipocyte differentiation process via activating AMP-activated protein kinase. Biochem Biophys Res
Commun 338:694-699 (2005).
18. Hwang, J. T. et al. Apoptotic effect of EGCG in HT-29 colon cancer cells via AMPK signal pathway.
Can-cer Lett 247:115-121 (2007).
19. Lin, C. L. & Lin, J. K. Epigallocatechin gallate (EGCG) attenuates high glucose-induced insulin signaling blockade in human hepG2 hepatoma cells. Mol Nutr
Food Res 52:930-939 (2008).
20. Lin, C. L., Huang, H. C. & Lin, J. K. Theaflavins atten-uate hepatic lipid accumulation through activating AMPK in human HepG2 cells. J Lipid Res 48:2334-2343 (2007).
21. Monteiro, R. et al. Modulation of MPP++uptake by tea and some of its components in Caco-2 cells. Naunyn
Schmiedebergs Arch Pharmacol 372:147-152 (2005).
22. Lee, Y. J. et al. Analysis of bioequivalence study using log-transformed model. Yakhakhoeji 44:308-314 (2000).