Comparison of Surrogate Markers as
Measures of Uncomplicated Insulin
Resistance in Korean Adults
Tae Jong Kim
1, Hye Jung Kim
1, Young Bae Kim
2, Jee Yon Lee
1, Hye Sun Lee
3, Jung Hwa Hong
3, Ji Won Lee
1,*
1Department of Family Medicine, Severance Hospital, Yonsei University College of Medicine, Seoul, Korea2Department of Family Medicine, Seoul Red Cross Hospital, Seoul, Korea
3Biostatistics Collaboration Unit, Department of Research Affairs, Yonsei University College of Medicine, Seoul, Korea
Background:
Metabolic syndrome (MS) is known to increase the risk of various cardiometabolic diseases and
in-sulin resistance (IR) has known to have central role in the development of MS. Many surrogate indices of IR have
been proposed and the detection of MS might be a suitable model for assessing the accuracy of surrogate indices.
The aims of our study are to invest the most appropriate index by assessment of the diagnostic capacity of IR among
each surrogate index and identifying cut-off values for discriminating uncomplicated MS in Korean adults.
Methods:
A cross-sectional study was performed, assessing 294 Korean adults, 85 of whom were diagnosed with
uncomplicated MS. The sensitivities and specificities of five surrogate IR indices were compared to discriminate
MS from healthy subjects; these included fasting serum insulin, homeostasis model assessment–insulin resistance
index, quantitative insulin sensitivity check index, McAuley index, and Disse index. Correlations between each
in-dex value were assessed using Pearson’s and Spearman’s correlation methods.
Results:
The McAuley index showed the highest area under the curve (0.85), specificity (86.12%), accuracy
(82.31%), positive predictive value (68.13%), and negative predictive value (88.67%) to distinguish MS, with a cut-off
point of 5.3 defined. Correlation coefficients of the five indices showed that the McAuley index had the strongest
correlation with IR.
Conclusion:
The McAuley index showed the best accuracy in the detection of MS as a surrogate marker of IR. To
establish more effective and accurate standards of measuring IR, comprehensive and multi-scaled studies are
re-quired.
Keywords:
Metabolic Syndrome; Insulin Resistance; McAuley Index; Koreans
Received: August 31, 2014, Revised: January 8, 2016, Accepted: January 11, 2016
*Corresponding Author: Ji Won Lee Tel: +82-2-2228-2338, Fax: +82-2-362-2473, E-mail: [email protected]
Original Article
INTRODUCTION
Metabolic syndrome (MS) is clinically identified as a cluster of cardio-vascular risk factors and metabolic imbalances such as central obesity, dyslipidemia, impaired glucose tolerance and dysregulation of blood pressure.1) MS increases the risk of cardiometabolic diseases,
includ-ing type II diabetes and cardiovascular disease.2) Furthermore, the
prevalence of MS is increasing steadily in several Asian countries3)
ow-ing to the influence of socioeconomic westernization, resultow-ing in problems such as increasing obesity4,5) and reduced physical activity.6)
According to data from the Korean National Health and Nutrition Ex-amination Survey (1998–2007), the age-adjusted prevalence of MS in Korean adults has rapidly increased in recent years, from 24.9% in 1998 to 31.3% in 2007.5) Although the precise mechanism of MS
patho-genesis is still unknown, many studies have revealed that insulin resis-tance (IR) and related factors have a central role in the development of metabolic dysfunction.7) As IR is a central factor in the development of
MS, the detection of MS may provide a suitable model to assess the risk factors of IR, allowing preventative management of diseases such as diabetes.
The hyperinsulinemic euglycemic clamp technique (HIEG) is gen-erally accepted as the best available direct method to assess insulin sensitivity.8) However, this method has many clinical limitations,
in-cluding higher cost and the requirement for invasive procedures. Sev-eral investigators have therefore proposed various indirect indices of IR (or insulin sensitivity) based on the measurement of biochemical values such as fasting blood glucose, fasting serum insulin, and lipid subtypes. The previously validated homeostasis model assessment-in-sulin resistance index (HOMA-IR)9,10) and the quantitative insulin
sen-sitivity check index (QUICKI)11) are the most widely used surrogate
measures of IR. However, these indices only reflect the feedback be-tween fasting serum insulin and glucose. Recently, other studies have shown that insulin sensitivity can additionally be influenced by other factors such as excess adiposity and dyslipidemia.12) Based on these
factors, alternative surrogate markers have been developed to measure IR, which better reflect lipid profiles such as triglyceride (TG) (McAuley index)13) or free fatty acid (FFA) (Disse index).14) Several recent
investi-gations have provided evidence that these indices better correlate with IR.
There have been a number of studies reporting the influence of ra-cial and environmental factors in insulin secretory capacity and insu-lin sensitivity.15) The most common type of dyslipidemia in Korea has
been reported to be hypertriglyceridemia,16) which is a considerable
differentiating factor from western countries. Previously published comparative studies have assessed HOMA-IR, QUICKI, and fasting se-rum insulin to measure IR using MS criteria among the Korean popu-lation.17,18) However, there have been no studies reported to date that
have investigated the efficacy of alternative indices for the detection of MS as a marker of IR among the Asian population.
We therefore investigated the diagnostic capacity of several surro-gate markers of insulin sensitivity including HOMA-IR, QUICKI,
McAuley index, and Disse index to discriminate uncomplicated MS from normal controls. The ability of these indices to detect increased metabolic risks among Korean adults was assessed.
METHODS
1. Participants
A total of 492 participants were recruited for this study (79.7% female). Participants were recruited from those undergoing a medical check-up at the division of family medicine in Gangnam Severance Hospital, between October 2005 and January 2008. Each participant was indi-vidually asked to complete a simple questionnaire to evaluate the risk of metabolic or cardiovascular disease, including questions regarding past medical history, current medication, and smoking or alcohol con-sumption. Smokers were defined as participants who currently or pre-viously smoked cigarettes daily and those who had smoked ≥5 packs (100 cigarettes) of cigarettes during their lifetime before the study date.18) Non-smokers were defined as participants who had smoked <5
packs of cigarettes during their lifetime or participants who had not smoked at all.19) Current drinkers were defined as participants who
currently or previously drank alcohol less than once a month, but at least once a year, while non-drinkers were defined as participants who had not drank any alcohol for the last 12 months or had never drank throughout their lifetime.20)
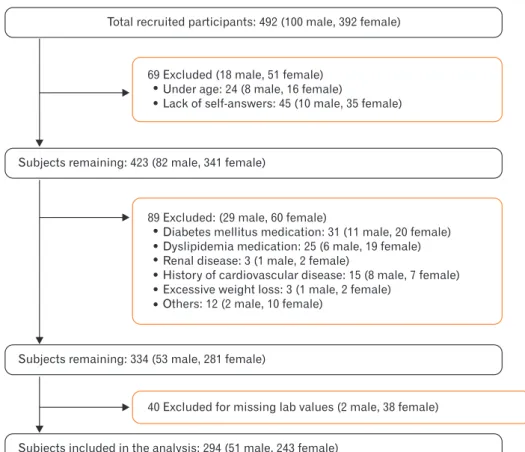
Subjects whose biochemical values or clinical information was not appropriate for the study were excluded, resulting in 198 subjects be-ing excluded (Figure 1). Furthermore, 69 subjects were also excluded because they were under 18 years of age or provided insufficient self-reported information during completion of the questionnaire. From the remaining 423 subjects, 89 were excluded owing to a current medi-cal history of diabetes mellitus (DM), cardiovascular disease, renal disease, any cancer, or severe weight loss, defined as greater than 10% loss over the past 6 months. An additional 40 subjects were excluded owing to incomplete laboratory results, required to calculate insulin sensitivity indices. A total of 294 subjects (male 51 and female 243) were included in the study.
2. Measurements
Blood pressure was measured with a standardized mercury sphygmo-manometer using the patient’s right arm after they had been in a sit-ting position for at least 5 minutes. Blood pressure was measured in duplicate for each patient, and the average value was recorded. An-thropometric measurements were performed by a single, well-trained examiner, with patients wearing light clothing without shoes. Body mass index (BMI) was calculated and waist circumference was mea-sured horizontally at the umbilicus while the subject was standing. Following 12 hours of overnight fasting, blood samples were ob-tained from the antecubital vein of each subject. Biomarkers of MS such as fasting glucose, total cholesterol, TG, high density lipoprotein cholesterol (HDLC), low density lipoprotein (LDL) cholesterol, and se-rum FFA were measured using an ADVIA 1650 chemistry system
(Sie-mens Medical Solutions, Tarrytown, NY, USA). White blood cell counts were quantified using an automated blood cell counter (ADVIA 120, Bayer, NY, USA). Serum fasting insulin levels were measured using a chemiluminescence immunoassay system (Roche, Indianapolis, IN, USA).
3. Definitions of Variables
MS was defined as fulfilling more than 3 of the following criteria based on the modified National Cholesterol Education Program Adult Treat-ment Panel III definition and the Korean Society for the Study of Obe-sity: (1) abdominal obeObe-sity: waist circumference ≥90 cm in men and ≥85 cm in women; (2) TG ≥150 mg/dL; (3) low HDLC: <40 mg/dL in men and <50 mg/dL in women; (4) increased blood pressure: systolic blood pressure ≥130 mm Hg, diastolic blood pressure ≥85 mm Hg, or use of anti-hypertensive medications; and (5) impaired fasting glu-cose: fasting glucose ≥100 mg/dL or the use of insulin or hypoglycemic medication.
Five independent IR indices were assessed: HOMA-IR, QUICKI, McAuley index, Disse index, and fasting serum insulin levels. HOMA-IR was calculated from the equation HOMA-HOMA-IR=[fasting serum glucose (mmol/L)×fasting serum insulin (lU/mL)]/22.5]. For both fasting se-rum insulin and HOMA-IR, increasing values corresponded to in-creased IR. QUICKI was calculated from the equation QUICKI=1/{log [fasting serum insulin (IU/mL)]+log [fasting serum glucose (mg/dL)]}. The McAuley index was calculated from the equation McAuley=exp
{2.63-0.28 ln [fasting serum insulin (IU/mL)]-0.31 ln [serum TG (mmol/L)]}. For both QUICKI and the McAuley index, increased val-ues corresponded to decreased IR. The Disse index was calculated from the equation Disse=12×(2.5×{[serum HDLC/total cholesterol (mmol/L)]-[serum FFA (mmol/L)]})-fasting serum insulin (IU/mL). As the Disse index value is always calculated below zero, increase of the value corresponds to decrease in IR.
4. Statistical Analysis
All data were analyzed using SAS ver. 9.1 (SAS Institute Inc., Cary, NC, USA). Values are described as the mean±standard deviation for nor-mally distributed data. Values for serum FFA were logarithmically transformed to eliminate the skewness of distribution. The clinical characteristics of the total study population and each subgroup were compared using an independent samples t-test and Mann-Whitney U-test for continuous variables or a chi-square test for categorical vari-ables. P-values <0.05 were considered statistically significant.
As all of the five IR indices showed statistically significant differences between the MS and non-MS subgroups, the accuracy of each index in the discriminating MS was further assessed using receiver-operating characteristic (ROC) analysis to obtain the area under the ROC curve (AUC). Comparison of AUCs was performed using DeLong method. Youden’s method was used to find an optimal cut-off point on the ROC curves to maximize the sensitivity and the specificity of each of IR indi-ces.
Figure 1. The flowchart for subject selection.
Total recruited participants: 492 (100 male, 392 female) 69 Excluded (18 male, 51 female)
Under age: 24 (8 male, 16 female)
Lack of self-answers: 45 (10 male, 35 female) Subjects remaining: 423 (82 male, 341 female)
89 Excluded: (29 male, 60 female)
Diabetes mellitus medication: 31 (11 male, 20 female) Dyslipidemia medication: 25 (6 male, 19 female) Renal disease: 3 (1 male, 2 female)
History of cardiovascular disease: 15 (8 male, 7 female) Excessive weight loss: 3 (1 male, 2 female)
Others: 12 (2 male, 10 female) Subjects remaining: 334 (53 male, 281 female)
40 Excluded for missing lab values (2 male, 38 female) Subjects included in the analysis: 294 (51 male, 243 female)
The correlations of IR to each index were also assessed. According to a previously published study, the number of MS criteria was used to define IR severity,21) and correlation coefficients between each IR
in-dex and the number of MS criteria were assessed using both Pearson’s and Spearman’s tests. Values approaching 1 were indicative of a stron-ger correlation.
RESULTS
A total of 294 participants (51 male and 243 female) were included in the study, with an age of 36.86±11.84 years and an average BMI of 26.69±4.08 kg/m2. The MS group had higher BMI, waist circumference,
higher incidence of smoking, current alcohol use, hypertension, and
Table 1. Demographic characteristics of patients with or without metabolic syndrome
Characteristic Total (N=294) Metabolic syndrome (N=85) Nonmetabolic syndrome (N=209) Pvalue
Age (y) 36.86±11.84 40.05±12.96 35.57±11.01
Sex
Male 51 33 18
Female 243 52 191
Weight (kg) 70.62±14.18 80.97±15.17 66.416±11.32 <0.001
Body mass index (kg/m2) 26.69±4.08 29.62±3.95 25.503±3.49 <0.001
Waist circumference (cm) 89.65±10.18 97.32±8.90 86.528±8.93 <0.001 Smoking Current smoking 33 25 8 <0.001* Nonsmoking 261 60 201 Drinking Current drinking 45 28 17 <0.001* Nondrinking 249 57 192 Hypertension Current medication 39 39 0 <0.001* Nonmedication 255 46 209 DM No DM history 290 81 209 <0.05* Newly diagnosed 4 4 0
Values are presented as mean±standard deviation assessed by independent two sample ttest or number. DM, diabetes mellitus.
*Assessed by chisquare test.
Table 2. Clinical characteristics and insulin resistance indices of the participants based on the presence of metabolic syndrome
Measurements Total (N=294) Metabolic syndrome (N=85) Nonmetabolic syndrome (N=209) Pvalue* Clinical characteristics
Systolic blood pressure (mm Hg) 120.69±14.02 132.34±15.63 115.96±9.97 <0.001
Diastolic blood pressure (mm Hg) 72.74±10.63 78.68±13.32 70.33±8.15 <0.001
Serum white blood cell (103/mm3) 6.43±1.66 7.02±1.67 6.19±1.60 <0.001
Serum hemoglobin (g/dL) 13.74±2.15 14.35±1.71 13.48±2.26 <0.001
Serum hematocrit (%) 40.53±4.46 42.70±4.58 39.65±4.09 <0.001
Serum aspartate aminotransferase (IU/L) 21.79±12.27 26.84±18.28 19.74±7.83 <0.001
Serum alanine aminotransferase (IU/L) 24.92±29.72 39.48±46.06 19.19±16.35 <0.001
Fasting serum glucose (mg/dL) 91.18±12.48 97.29±15.68 88.70±9.88 <0.001
Serum cholesterol (mg/dL) 183.76±31.92 191.77±37.74 180.50±28.59 <0.05
Serum triglyceride (mg/dL) 113.21±84.41 178.24±110.92 86.76±50.99 <0.001
Serum high density lipoprotein (mg/dL) 52.57±12.82 44.51±11.22 55.84±11.958 <0.001
Serum FFA (µEq/L) 566.17±243.78 532.34±245.31 579.93±241.81 0.06†
Fasting serum insulin (µU/mL) 9.54±9.15 14.63±12.02 7.48±6.65 <0.001
Insulin resistance indices
Homeostasis model assessmentinsulin resistance 3.57±3.072 1.68±1.602 <0.001
Quantitative insulin sensitivity check index 0.58±0.108 0.71±0.147 <0.001
McAuley 3.9±2.78 7.8±2.43 <0.001
Disse index 13.84±12.02 4.93±7.138 <0.001
Values are presented as mean±standard deviation, except for serum FFA for which the geometric mean is presented. FFA, free fatty acid.
DM. Comparison of the patient demographic characteristics between MS and non-MS groups is shown in Table 1.
Clinical laboratory characteristics were found to significantly differ across MS and non-MS groups (Table 2). Systolic and diastolic blood pressure, fasting glucose, total cholesterol, TG, fasting insulin, hemo-globin, hematocrit, aspartate aminotransferase level, and alanine ami-notransferase level were all significantly higher in MS group, while HDL cholesterol levels were significantly lower in MS group. The as-sessment of IR indices revealed that HOMA-IR levels were significantly higher in the MS group, while QUICKI, McAuley, and Disse indices were significantly higher in non-MS group.
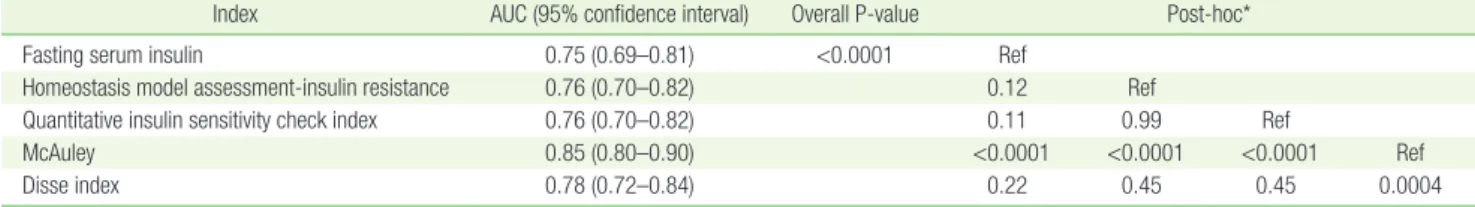
ROC curves were generated for each index after adjustment with sex, age, BMI, smoking, and drinking habit (Figure 2). The AUC for all indices were larger than 0.75. The AUC for the McAuley index was sig-nificantly greater (AUC=0.8538) than the AUCs for other indices. The second greatest AUC value was obtained using the Disse index (AUC=0.7771). However, post-hoc analyses revealed there were no statistical differences among each of the IR indices, except with the McAuley index (Table 3).
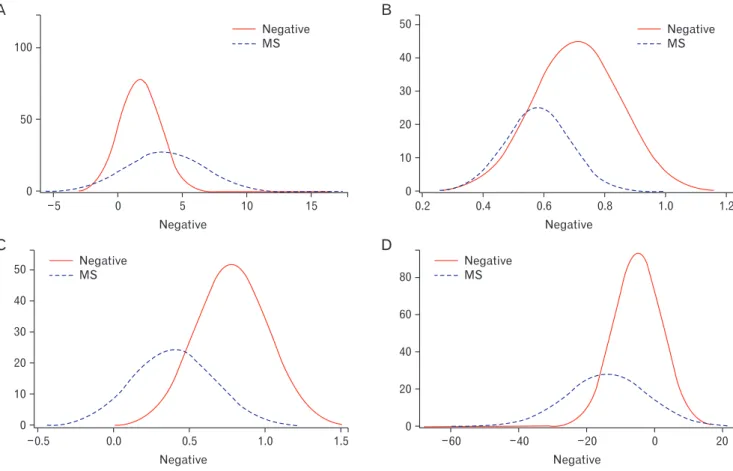
Sensitivity, specificity, accuracy, positive predictive value (PPV), and negative predictive value (NPV) of each IR index for discriminating MS are shown in Table 4. Youden’s method was used to determine optimal cut-off values, maximizing the sum of sensitivity and specificity. The highest values of any index for specificity, accuracy, PPV and NPV were observed using the McAuley index with a cut-off value of 5.3, and these were found to be significantly greater when compared with the other indices. The distributions of index values calculated from the MS group and non-MS group are shown in Figure 3.
Assessment of the correlations between IR and each of the indices
revealed that the McAuley index had the strongest correlation (the highest slope) across all groups (R=-0.6590) (Figure 3). The second strongest correlation was observed using the Disse index (R=-0.4816). The correlation comparison by Wolfe’s test confirmed there was sig-nificant statistical difference between the McAuley and Disse coeffi-cients (Figure 4F).
Table 3. Posthoc analyses of the AUC of each insulin index
Index AUC (95% confidence interval) Overall Pvalue Posthoc*
Fasting serum insulin 0.75 (0.69–0.81) <0.0001 Ref
Homeostasis model assessmentinsulin resistance 0.76 (0.70–0.82) 0.12 Ref
Quantitative insulin sensitivity check index 0.76 (0.70–0.82) 0.11 0.99 Ref
McAuley 0.85 (0.80–0.90) <0.0001 <0.0001 <0.0001 Ref
Disse index 0.78 (0.72–0.84) 0.22 0.45 0.45 0.0004
AUC, area under curve; Ref, standard reference. *Posthoc analyses were conducted using DeLong method.
Table 4. The diagnostic performance of four insulin resistance indices
Index Cutoff value* Sensitivity % (95% CI) Specificity % (95% CI) Accuracy % (95% CI) Positive predictive value % (95% CI) Negative predictive value % (95% CI) Homeostasis model
assessmentinsulin resistance >1.87 67.06 (57.07–77.05) 72.25 (66.18–78.32) 70.75 (65.55–75.95) 49.57 (40.43–58.70) 84.36 (79.04–89.68) Quantitative insulin sensitivity
check index
≤0.61 67.06 (57.07–77.05) 72.73 (66.69–78.77) 71.09 (65.91–76.27) 50.00 (40.82–59.18) 84.44 (79.15–89.74) McAuley ≤5.3 72.94 (63.50–82.39) 86.12 (81.44–90.81) 82.31 (77.95–86.67) 68.13 (58.56–77.71) 88.67 (84.31–93.03) Disse index ≤5.79 77.64 (68.79–86.50) 64.59 (58.11–71.08) 68.37 (63.05–73.68) 47.14 (38.87–55.41) 87.66 (82.47–92.86) CI, confidence interval.
*Youden’s method was used to determine the optimal cutoff value.
Figure 2. ROC curves for the detection of metabolic syndrome. ROC, receiver operating characteristic; HOMAIR, homeostasis model assessmentinsulin resistance; QUICKI, quantitative insulin sensitivity check index.
0 0.25 0.50 0.75 1.00 1.00 0.75 0.50 0.25 Sensitivity 1-Specificity 0
ROC curves for comparisons
ROC curve (area)
Insulin (0.7524) QUICKI (0.7625) Disse index (0.7771)
HOMA-IR (0.7626) McAuley (0.8538)
DISCUSSION
Using the diagnosis of MS as a marker of IR, our cross-sectional study showed that the McAuley index has the best accuracy for screening uncomplicated IR in Korean adults. Appropriate cut-off values for each index for were also identified in discriminating MS from non-MS sub-jects.
The prevalence of cardiometabolic diseases has been rapidly in-creasing worldwide, and the detection of IR is considered important owing to its central role in the pathogenesis of metabolic disturbance. Therefore, tests to reliably measure IR will provide the first step in ef-fective preventive management of individuals at high cardiovascular risk.22) Although HIEG is considered the gold standard for measuring
IR directly, many other methods have been developed to overcome the clinical limitations of HIEG, such as technical demands, invasive procedure, and high costs. Among them, surrogate indirect indices that are calculated based on serum glucose and insulin level have been the most widely used. These include indices such as insulin to glucose ratio, HOMA-IR, and QUICKI. Several studies have previously reported a correlation between HIEG and HOMA-IR or QUICKI. How-ever the correlation coefficients of these indices were reported to fall in the range from 0.5 to 0.6.23,24) Furthermore, these indices have several
limitations in representing the whole range of IR. Firstly, the relation-ship between fasting serum glucose and insulin mainly reflects hepatic glucose sensitivity, whereas HIEG mainly assesses peripheral glucose sensitivity.25) Secondly, it is debated that the secretory function of
pan-creatic beta cells may affect the value of HOMA-IR, although most of these studies did not discriminate DM patients.18,25) Many recent
inves-tigations have suggested additional adjusted surrogate indices that showed better correlations with HIEG. The McAuley index was devel-oped by McAuley et al.13) in 2001 to identify the status of IR in the
gen-eral population, and comprised fasting serum insulin levels and serum TG. Furthermore, some studies have reported that the TG/HDL ratio correlates well with IR in the normal population or in patients with early stage MS.26) These findings support the notion that hepatic
regu-lation of glucose metabolism is also important in the development of IR in the non-DM population. Another study by Disse et al.14)
suggest-ed that the substitutive index using serum FFA (Disse index) providsuggest-ed the best accuracy to identify IR. Currently, many experts insist, howev-er, that the suitable surrogate index should be ‘selected’ with consider-ation of the individual aspects of the study being performed.25,27) In this
study, we focused on the ability of newly suggested markers to screen for uncomplicated IR in individuals, and compared these with tradi-tional IR markers.
Figure 3. Distribution curves for insulin resistance indices. Red curves (negative) represent nonMS groups, while dotted blue curves (MS) represent the MS groups. The horizontal axes show index value and vertical axes show the number of subjects. (A) Distribution of homeostasis model assessmentinsulin resistance. (B) Distribution of quantitative insulin sensitivity check index. (C) Distribution of the McAuley index. (D) Distribution of the Disse index. MS, metabolic syndrome.
5 0 5 10 15 100 50 Negative 0
A
Negative MS 0.2 0.4 0.6 0.8 1.0 1.2 50 40 30 20 10 Negative 0B
60 40 20 0 20 80 60 40 20 Negative 0D
0.5 0.0 0.5 1.0 1.5 50 40 30 20 10 Negative 0C
Negative MS Negative MS Negative MSSeveral other studies have also identified the McAuley index to be a more accurate detection method for IR compared with other indices. The outcomes of our study are consistent with these previous investi-gations. Ascaso et al.28) found that the McAuley index was more
specif-ic and sensitive in the assessment of IR compared to QUICKI. Another
study assessing the non-diabetic offspring of diabetic individuals re-ported the highest AUC for MS detection using the McAuley index.29)
In a study of newly diagnosed subjects with type II DM, comparison of fasting serum insulin and the McAuley index to identify IR showed that both tests had high specificity but relatively low sensitivity, in Figure 4. Comparison of correlation coefficients between indices. Each index: Pearson’s correlation coefficient/Spearman’s correlation coefficient. (A) Insulin: 0.3718 (<0.0001)/0.4460 (<0.0001). (B) HOMAIR: 0.4061 (<0.0001)/0.4715 (<0.0001). (C) QUICKI: 0.4649 (<0.0001)/0.4684 (<0.0001). (D) McAuley: 0.6590 (<0.0001)/0.6514 (<0.0001). (E) 0.4816 (<0.0001)/0.5592 (<0.0001). (F) Wolfe’s test. MS, metabolic syndrome; HOMAIR, homeostasis model assessmentinsulin resistance; QUICKI, quantitative insulin sensitivity check index; Ref, reference.
0 1 2 3 4 5 80 70 60 50 40 30 20 10 Insulin No. of MS 0
A
0 1 2 3 4 5 18 16 14 12 10 8 6 4 2 HOMA-IR No. of MS 0B
0 1 2 3 4 5 0.50 0.45 0.40 0.35 0.30 0.25 0.20 0.15 0.10 0.05 QUICKI No. of MS 0C
0 1 2 3 4 5 1.4 1.2 1.0 0.8 0.6 0.4 0.2 0.0 0.2 McAuley No. of MS 0.4D
0 1 2 3 4 5 20 10 0 10 20 30 40 50 60 70 Disse No. of MS 80E
F
Spearman correlation comparison Insulin HOMA-IR QUICKI McAuley Disse Ref 0.0046 <0.0001 <0.0001 <0.0001 Ref <0.0001 <0.0001 <0.0001 Ref <0.0001 0.7001 Ref <0.0001
agreement with the results of our study.30) Although many previous
studies have compared the power of MS detection among IR indices, relatively few studies have assessed an Asian population. To our knowledge, this is the first study that investigates the efficacy of alter-native indices including the McAuley and Disse indices in an Asian population.
The identification of the McAuley index as the most effective in de-tecting IR additionally provide insights into the pathophysiology of both IR and MS. Our results provide evidence that dysregulation of se-rum lipid metabolism, especially TG, may be the main factor of early stage IR. When the quantity of glucose entering the liver exceeds the hepatocyte glycogen storing capacity, insulin promotes the conversion of all excess glucose into fatty acids that are subsequently packaged as TG.31) Many previous studies have demonstrated that IR and the
ac-companying hyperinsulinemia can directly affect lipoprotein metabo-lism.32) Increased TG levels, as the result of hyperinsulinemia, also
di-rectly cause pancreatic beta-cell dysfunction, due to the accumulation of TG inside the cells. Consequently, these cascades may establish a cycle driving aggravating insulin dysregulation. The postprandial hy-perlipidemia (higher TG, lower HDL, and lower LDL) characteristic of type II DM patients is a good example. Based on these facts and our results, measuring dyslipidemia is likely to be a good reflection of early uncomplicated, metabolic dysfunction, even in those still able to pre-serve hepatic glucose uptake.
Our study has several limitations. Firstly, HIEG was not performed in our study, and thus, IR could not be directly confirmed. Secondly, the cross-sectional design of our study limited the ability to determine disease causality. As we studied a small population who visited a hos-pital for a health check-up, including for management obesity man-agement, our results cannot be generalized to the entire population. Thirdly, women accounted for a larger proportion of participants than men. Further prospective large-scaled studies should be performed to determine the precise role of IR indices in detecting MS in the future. In conclusion, the McAuley index is the most reliable and accurate tool to detect MS as a marker of uncomplicated IR in Korean adults. Although we could not determine disease causality, our results collec-tively suggest that the assessment of hepatic lipid metabolism, includ-ing TG, may be useful in the detection of IR prevalence. Further studies are required to understand the clinical and pathophysiological signifi-cance of our findings.
CONFLICT OF INTEREST
No potential conflict of interest relevant to this article was reported.
ACKNOWLEDGMENTS
This study was supported by a faculty research grant of Yonsei University College of Medicine for 2013 (6-2013-0021). This research was support-ed by the Bio & Msupport-edical Technology Development Program of the Na-tional Research Foundation (NRF) funded by the Ministry of Science,
ICT & Future Planning, Republic of Korea (NRF-2013M3A9B6046416).
REFERENCES
1. Expert Panel on Detection, Evaluation, and Treatment of High Blood Cholesterol in Adults. Executive summary of the third report of the National Cholesterol Education Program (NCEP) Expert Panel on De-tection, Evaluation, and Treatment of High Blood Cholesterol in Adults (Adult Treatment Panel III). JAMA 2001;285:2486-97.
2. Mottillo S, Filion KB, Genest J, Joseph L, Pilote L, Poirier P, et al. The metabolic syndrome and cardiovascular risk a systematic review and meta-analysis. J Am Coll Cardiol 2010;56:1113-32.
3. Nestel P, Lyu R, Low LP, Sheu WH, Nitiyanant W, Saito I, et al. Meta-bolic syndrome: recent prevalence in East and Southeast Asian popu-lations. Asia Pac J Clin Nutr 2007;16:362-7.
4. Despres JP, Lemieux I. Abdominal obesity and metabolic syndrome. Nature 2006;444:881-7.
5. Lim S, Shin H, Song JH, Kwak SH, Kang SM, Won Yoon J, et al. Increas-ing prevalence of metabolic syndrome in Korea: the Korean National Health and Nutrition Examination Survey for 1998-2007. Diabetes Care 2011;34:1323-8.
6. Pan Y, Pratt CA. Metabolic syndrome and its association with diet and physical activity in US adolescents. J Am Diet Assoc 2008;108:276-86. 7. Grundy SM, Cleeman JI, Daniels SR, Donato KA, Eckel RH, Franklin
BA, et al. Diagnosis and management of the metabolic syndrome: an American Heart Association/National Heart, Lung, and Blood Insti-tute Scientific Statement. Circulation 2005;112:2735-52.
8. DeFronzo RA, Tobin JD, Andres R. Glucose clamp technique: a meth-od for quantifying insulin secretion and resistance. Am J Physiol 1979; 237:E214-23.
9. Matthews DR, Hosker JP, Rudenski AS, Naylor BA, Treacher DF, Turner RC. Homeostasis model assessment: insulin resistance and beta-cell function from fasting plasma glucose and insulin concentrations in man. Diabetologia 1985;28:412-9.
10. Bonora E, Targher G, Alberiche M, Bonadonna RC, Saggiani F, Zenere MB, et al. Homeostasis model assessment closely mirrors the glucose clamp technique in the assessment of insulin sensitivity: studies in subjects with various degrees of glucose tolerance and insulin sensi-tivity. Diabetes Care 2000;23:57-63.
11. Katz A, Nambi SS, Mather K, Baron AD, Follmann DA, Sullivan G, et al. Quantitative insulin sensitivity check index: a simple, accurate meth-od for assessing insulin sensitivity in humans. J Clin Endocrinol Metab 2000;85:2402-10.
12. McLaughlin T, Reaven G, Abbasi F, Lamendola C, Saad M, Waters D, et al. Is there a simple way to identify insulresistant individuals at in-creased risk of cardiovascular disease? Am J Cardiol 2005;96:399-404. 13. McAuley KA, Williams SM, Mann JI, Walker RJ, Lewis-Barned NJ,
Temple LA, et al. Diagnosing insulin resistance in the general popula-tion. Diabetes Care 2001;24:460-4.
14. Disse E, Bastard JP, Bonnet F, Maitrepierre C, Peyrat J, Louche-Pelissier C, et al. A lipid-parameter-based index for estimating insulin sensitivi-ty and identifying insulin resistance in a healthy population. Diabetes Metab 2008;34:457-63.
15. Gower BA, Fernandez JR, Beasley TM, Shriver MD, Goran MI. Using genetic admixture to explain racial differences in insulin-related
phe-notypes. Diabetes 2003;52:1047-51.
16. Committee for Establishing Treatment Instruction for Dyslipidemia of the Korean Society of Lipidology and Atherosclerosis. Guidelines for management of dyslipidemia. 2nd ed. Seoul: Korean Society of Lipi-dology and Atherosclerosis; 2009.
17. Ryu S, Sung KC, Chang Y, Lee WY, Rhee EJ. Spectrum of insulin sensi-tivity in the Korean population. Metabolism 2005;54:1644-51. 18. Lee S, Choi S, Kim HJ, Chung YS, Lee KW, Lee HC, et al. Cutoff values
of surrogate measures of insulin resistance for metabolic syndrome in Korean non-diabetic adults. J Korean Med Sci 2006;21:695-700. 19. Agaku IT, King BA, Dube SR; Centers for Disease Control and
Preven-tion (CDC). Current cigarette smoking among adults - United States, 2005-2012. MMWR Morb Mortal Wkly Rep 2014;63:29-34.
20. World Health Organization, Department of Mental Health and Sub-stance Dependence. International guide for monitoring alcohol con-sumption and related harm. Geneva: World Health Organization; 2000.
21. Confavreux CB, Szulc P, Casey R, Varennes A, Goudable J, Chapurlat RD. Lower serum osteocalcin is associated with more severe metabol-ic syndrome in elderly men from the MINOS cohort. Eur J Endocrinol 2014;171:275-83.
22. Ginsberg HN. Insulin resistance and cardiovascular disease. J Clin In-vest 2000;106:453-8.
23. Yokoyama H, Emoto M, Fujiwara S, Motoyama K, Morioka T, Komatsu M, et al. Quantitative insulin sensitivity check index and the reciprocal index of homeostasis model assessment in normal range weight and moderately obese type 2 diabetic patients. Diabetes Care 2003;26:2426-32.
24. Sarafidis PA, Lasaridis AN, Nilsson PM, Pikilidou MI, Stafilas PC,
Kanaki A, et al. Validity and reproducibility of HOMA-IR, 1/HOMA-IR, QUICKI and McAuley’s indices in patients with hypertension and type II diabetes. J Hum Hypertens 2007;21:709-16.
25. Pisprasert V, Ingram KH, Lopez-Davila MF, Munoz AJ, Garvey WT. Limitations in the use of indices using glucose and insulin levels to predict insulin sensitivity: impact of race and gender and superiority of the indices derived from oral glucose tolerance test in African Americans. Diabetes Care 2013;36:845-53.
26. Bovet P, Faeh D, Gabriel A, Tappy L. The prediction of insulin resis-tance with serum triglyceride and high-density lipoprotein cholesterol levels in an East African population. Arch Intern Med 2006;166:1236-7. 27. Matsuda M. Measuring and estimating insulin resistance in clinical
and research settings. Nutr Metab Cardiovasc Dis 2010;20:79-86. 28. Ascaso JF, Pardo S, Real JT, Lorente RI, Priego A, Carmena R.
Diagnos-ing insulin resistance by simple quantitative methods in subjects with normal glucose metabolism. Diabetes Care 2003;26:3320-5.
29. Hettihewa LM, Weerarathna TP. Comparison of McAuley/fasting insu-lin indices with ATP III cinsu-linical criteria for the diagnosis of insuinsu-lin re-sistance in type 2 diabetes mellitus. J Pharmacol Pharmacother 2011;2:165-9.
30. Choukem SP, Gautier JF. How to measure hepatic insulin resistance? Diabetes Metab 2008;34(6 Pt 2):664-73.
31. Lewis GF, Uffelman KD, Szeto LW, Steiner G. Effects of acute hyperin-sulinemia on VLDL triglyceride and VLDL apoB production in normal weight and obese individuals. Diabetes 1993;42:833-42.
32. Laws A, Reaven GM. Evidence for an independent relationship be-tween insulin resistance and fasting plasma HDL-cholesterol, triglyc-eride and insulin concentrations. J Intern Med 1992;231:25-30.