저작자표시-비영리-변경금지 2.0 대한민국 이용자는 아래의 조건을 따르는 경우에 한하여 자유롭게 l 이 저작물을 복제, 배포, 전송, 전시, 공연 및 방송할 수 있습니다. 다음과 같은 조건을 따라야 합니다: l 귀하는, 이 저작물의 재이용이나 배포의 경우, 이 저작물에 적용된 이용허락조건 을 명확하게 나타내어야 합니다. l 저작권자로부터 별도의 허가를 받으면 이러한 조건들은 적용되지 않습니다. 저작권법에 따른 이용자의 권리는 위의 내용에 의하여 영향을 받지 않습니다. 이것은 이용허락규약(Legal Code)을 이해하기 쉽게 요약한 것입니다. Disclaimer 저작자표시. 귀하는 원저작자를 표시하여야 합니다. 비영리. 귀하는 이 저작물을 영리 목적으로 이용할 수 없습니다. 변경금지. 귀하는 이 저작물을 개작, 변형 또는 가공할 수 없습니다.
Molecular Classification of
Basal Cell Carcinoma of Skin
by Gene Expression Profiling
by
Hyoseob Lim
Major in Medicine
Department of Medical Sciences
The Graduate School, Ajou University
Molecular Classification of
Basal Cell Carcinoma of Skin
by Gene Expression Profiling
by
Hyoseob Lim
A Dissertation Submitted to The Graduate School of
Ajou University in Partial Fulfillment of the Requirements
for the Degree of
Master of Medicine
Supervised by
Myong Chul Park, M.D., Ph.D.
Major in Medicine
Department of Medical Sciences
The Graduate School, Ajou University
-ABSTRACT-
Molecular Classification of Basal Cell Carcinoma of Skin
by Gene Expression Profiling
Non-melanoma skin cancers (NMSC) including basal cell carcinoma (BCC) and
squamous cell carcinoma (SCC) are more common kinds of skin cancer. Although these
tumors share common pathological and clinical features, their similarity and heterogeneity at
molecular levels are not fully elaborated yet. Here, by performing comparative analysis of
gene expression profiling of BCC, SCC, and normal skin tissues, we could classify the BCC
into three subtypes of classical, SCC-like, and normal-like BCCs. Functional enrichment and
pathway analyses revealed the molecular characteristics of each subtype. The classical BCC
showed the enriched expression and transcription signature with the activation of Wnt and
Hedgehog signaling pathways, which were well known key features of BCC. By contrast,
the SCC-like BCC was enriched with immune-response genes and oxidative stress-related
genes. Network analysis revealed the PLAU/PLAUR as a key regulator of SCC-like BCC.
The normal-like BCC showed prominent activation of metabolic processes particularly the
fatty acid metabolism. The existence of these molecular subtypes could be validated in an
independent dataset, which demonstrated the three subgroups of BCC with distinct
functional enrichment. In conclusion, we suggest a novel molecular classification of BCC
providing insights on the heterogeneous progression of BCC.
Keywords: non-melanoma skin cancer, basal cell carcinoma, squamous cell carcinoma, gene
TABLE OF CONTENTS
ABSTRACT ··· i
TABLE OF CONTENTS ··· ii
LIST OF FIGURES ··· iii
LIST OF TABLES ··· iv
ABBREVIATION ··· v
I. INTRODUCTION ··· 1
II. MATERIALS AND METHODS ··· 4
A. Clinical samples ··· 4
B. Gene expression profiling ··· 4
C. Analysis of microarray data ··· 5
D. Immunohistochemistry ··· 5
III. RESULTS ··· 7
A. Comparison of gene expression profiles of SCC and BCC ··· 7
B. The functional characteristics of molecular subtypes ··· 10
C. External validation of the gene expression profiling analysis ··· 18
D. PLAU is a putative key regulator of SCC-like BCC ··· 28
IV. DISCUSSION ··· 30
REFERENCES ··· 32
LIST OF FIGURES
Fig. 1. Unsupervised clustering of gene expression profiles of NMSCs ··· 8
Fig. 2. The gene expression classifiers of the three groups ··· 11
Fig. 3. The enriched pathways Classical BCC subgroup ··· 12
Fig. 4. Gene expression profiles of the integrated data set ··· 19
Fig. 5. Comparison of the gene expression modules in independent data sets ··· 22
LIST OF TABLES
Table 1. Clinicopathological Features of the Molecular Subtypes ··· 9
Table 2. Enrichment of gene functions in each group classifiers ··· 13
Table 3. Common transcription factor binding sites identified in each group ··· 17
ABBREVIATION
NMSC: non-melanoma skin cancer;
BCC: basal cell carcinoma;
I. INTRODUCTION
Skin cancer is the most common type of cancer in Caucasian population. The incidence of
both skin cancers of melanoma and that of non-melanoma are increasing over the past
decades (Leiter and Garbe, 2008; Rogers et al., 2010). Non-melanoma skin cancers (NMSCs)
are developed commonly in the Caucasian populations (Leiter and Garbe, 2008). The
incidence in Asian countries is increasing continuously as well (Kim et al., 2009). The
NMSCs are comprised with major two types, which are basal cell carcinoma (BCC) and
squamous cell carcinoma (SCC). These two types of NMSCs showed similar clinical and
pathological features. Common risk factors including sun exposure, ultraviolet radiation or
ionizing radiation, human papilloma virus, albinism, xeroderma pigmentosum,
immunosuppression, and chemical carcinogens (e.g., arsenic and coal tar) are known to
involve in both NMSC development (Alam and Ratner, 2001; Armstrong and Kricker, 2001;
Rubin et al., 2005). Signaling pathways including PPAR-γ, TGF-β, NF-κB, Ras, EGF
receptor/MAPKK/MAPK/AP-1, SHH/Wnt have been dysregulated in NMSCs (Serewko et
al., 2002; Lind et al., 2004; Heller et al., 2013). Moreover, recent genome-wide gene
expression profiling studies have successfully demonstrated the systematic aberration of
multiple signaling pathways in NMCSs. For example, Hedgehog, Wnt, and MAPK signaling
pathways have been shown to activate in BCC and SCC (Haider et al., 2006; Nindl et al.,
2006; Asplund et al., 2008; Heller et al., 2013). However, huge heterogeneity of pathological
and clinical features of NMSCs have been noticed (Backvall et al., 2005). Morphologically,
BCC, which grows slowly, is locally invasive neoplasm that do not metastasizes, while SCC,
derived from flat shaped squamous cell in the skin surface, is aggressive, grows faster, and
has higher rates of recurrence, metastasis, and mortality, compared to those of BCC (Ulrich
et al., 2008; Quintana et al., 2013). In addition, based on the clinical and histopathological
features, BCC has been classified into several subtypes of nodular, superficial, micronodular,
infiltrative, and morpheaform (Crowson, 2006). The SCCs have been classified into three
subtypes, which are adenoid (acantholytic), adenosquamous, or desmoplastic SCC.
Furthermore, a recent study has shown that SCC can be further stratified into 10 subtypes
(Yanofsky et al., 2011). These studies imply the huge heterogeneity of BCC and SCC,
requiring further elaboration. Therefore, novel classification based on molecular profiles is
urgently needed to address the mechanistic and molecular backgrounds of the heterogeneous
progression of the NMSC.
Previously, gene expression profiling studies have successfully demonstrated the
heterogeneity of tumors at molecular level and have provided new clues for the underlying
mechanistic alteration in cancer genome (Kwon et al., 2012). Thus, we performed an
oncogenomic comparison of the gene expression profiling of SCC and BCC tumors to
delineate their molecular similarity and heterogeneity of NMSCs at molecular level.
Previously, our team had performed a similar approach to compare the gene expression
profiles of different tumor types. It could have provided not only the expression similarity
among those tissues but also the functional characteristics of the expression profiles,
identifying a new intermediate subtype between the two tumor types derived from similar
some of the BCC and SCC might share common genomic traits because both tumors are
derived from the resembling developmental origin cells. As expected, our gene expression
profiling analysis could reveal novel subtypes of BCC. This will provide a new mechanistic
II. MATERIALS AND METHODS
A. Clinical Samples
A total of 21 cases of NMSCs and five normal skin tissue specimens were used for this
study. All the tumor and normal samples were obtained with patients’ consent, and ethical
approval obtained from the Institutional Review Board of Ajou University. Freshly collected
samples were snap-frozen liquid-nitrogen and stored at -70℃ before using.
B. Gene Expression Profiling
Total RNA was extracted from tumor and normal samples using the mirVana total RNA
extraction kit (Ambion, Austin, TX) according to manufacturer’s instruction. RNA
concentrations and purity were determined using the NanoDrop ND-100 spectrometer
(NanoDrop, Rockland, DE). In order to check the RNA integrity of the samples, the Agilent
2100 Bioanalyzer (Agilent Techologies, Santa Clara, CA) was used. Also, mRNAs samples,
given an RNA integrity number (RIN) value exceeding 7, were used in this experiment.
RNA prepared for microarray hybridization was amplified and purified using the Ambion
Illumina RNA amplification kit (Ambion) to yield biotinylated complementary RNA (cRNA)
according to the manufacturer’s suggested instructions. Briefly, total RNA was reverse
transcribed to synthesize first-strand cDNA using a T7 Oligo (dT) primer. The
single-stranded cDNA was converted into a double single-stranded DNA template using DNApolymerase
and RNase H. After purification, the cDNA quantity was assessed using the ND-100
and labelled with biotin-NTP. The biotinylated cRNA samples were hybridized to
HumanHT-12 v4 expression beadchip array containing over 47,000 probes at 58℃ for 16–
18 h, and then washed, stained streptavidin-Cy3 according to the manufacturer’s protocol
(Illumina, Inc., San Diego, CA). The arrays were scanned with an Illumina bead array
Reader confocal scanner according to the manufacturer’s guidelines. Raw data were obtained
using the software, GenomeStudio.
C. Analysis of Microarray Data
The gene expression profiles of raw data were processed by log2 transformation and
quantile normalization. Then, gene and array centering was applied. All the data processing
was performed using R/Bioconductor packages. The cluster analysis was performed using
cluster 3.0 program (Eisen et al., 1998) and centroid linkage method was applied. In addition,
the functional profiling of biological function and signaling pathways were performed using
DAVID software (Dennis et al., 2003). Validation of the gene expression profile analysis
was performed by using a public gene expression profile, which was obtained from Gene
Expression Omnibus database (accession number, GSE7553) (Riker et al., 2008). Data
integration with the public data was performed by using the official gene symbol as a
common identifier to connect the two different platform data sets.
D. Immunohistochemistry
Ki67 immunostaining was performed on formalin fixed and paraffin-embedded tissues.
graded ethanol. Endogeneous peroxidases were blocked with 3% hydrogen peroxide. After
antigen retrieval step with 10 mmol/L citrate buffer (pH 6.0), non-specific protein binding
was prevented by blocking with normal goat serum. The slides were then incubated with
monoclonal mouse anti-ki67 (clone MIB-1, DAKO) at a dilution of 1:100 for 30 min at room
temperature. After rinsing, sections were incubated with biotinylated secondary antibody and
avidin-biotin complex. After rinsing, sections were stained with 3,3'-diaminobenzidine and
III. RESULTS
A. Comparison of Gene Expression Profiles of SCC and BCC
Gene expression profiling was performed using 16 cases of BCC, five cases of SCC, and
five cases of normal skin tissues. First, to evaluate the overall expression patterns, we
performed an unsupervised clustering analysis using the most variable gene sets with
standard deviation greater than 0.4 (n=7153). This revealed three cluster groups of G1, G2,
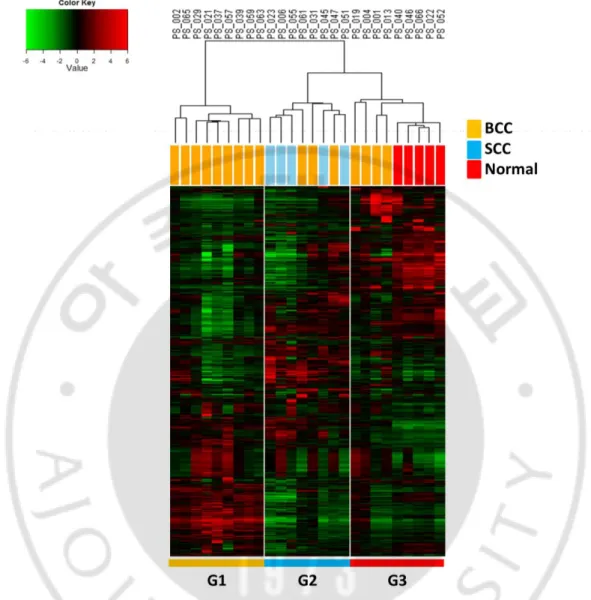
and G3, which have distinct gene expression patterns (Fig. 1). The G1 was comprised with
the BCC samples while the G2 was comprised with three cases of BCC and five cases of
SCC samples. The G3 was comprised with four cases of BCC and five normal tissues. This
result showed heterogeneous gene expressions of the BCCs. Based on the clustering results,
the BCCs in G1 can be designated as “classical BCC” and the BCCs in G2 as “SCC-like
BCC.” The BCCs in G3 were classified as the “normal-like BCC.” Clinical features including sex, age, tumor size, and stage showed no significant difference among the
Fig. 1. Unsupervised clustering of gene expression profiles of NMSCs. Unsupervised
clustering of the gene expression profiles of NMSCs were performed, which reveals three
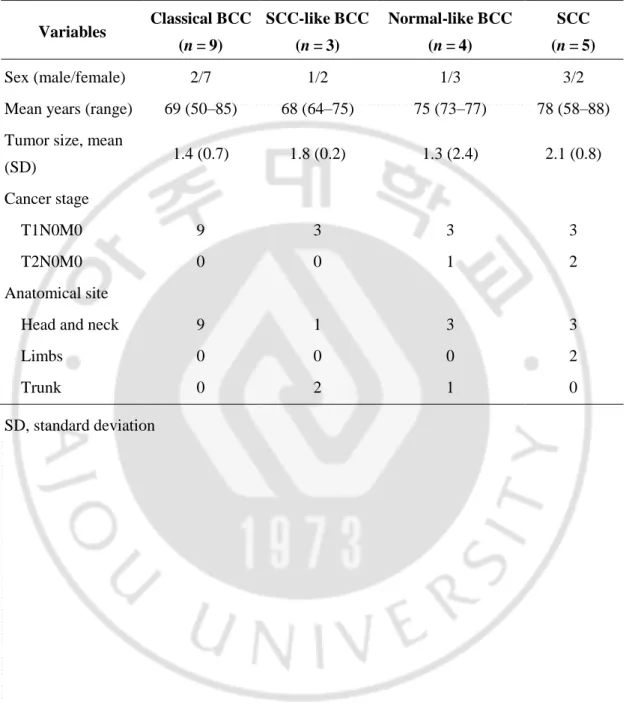
Table 1. Clinicopathological Features of the Molecular Subtypes Variables Classical BCC (n = 9) SCC-like BCC (n = 3) Normal-like BCC (n = 4) SCC (n = 5) Sex (male/female) 2/7 1/2 1/3 3/2
Mean years (range) 69 (50–85) 68 (64–75) 75 (73–77) 78 (58–88) Tumor size, mean
(SD) 1.4 (0.7) 1.8 (0.2) 1.3 (2.4) 2.1 (0.8)
Cancer stage
T1N0M0 9 3 3 3
T2N0M0 0 0 1 2
Anatomical site
Head and neck 9 1 3 3
Limbs 0 0 0 2
Trunk 0 2 1 0
B. The Functional Characteristics of Molecular Subtypes
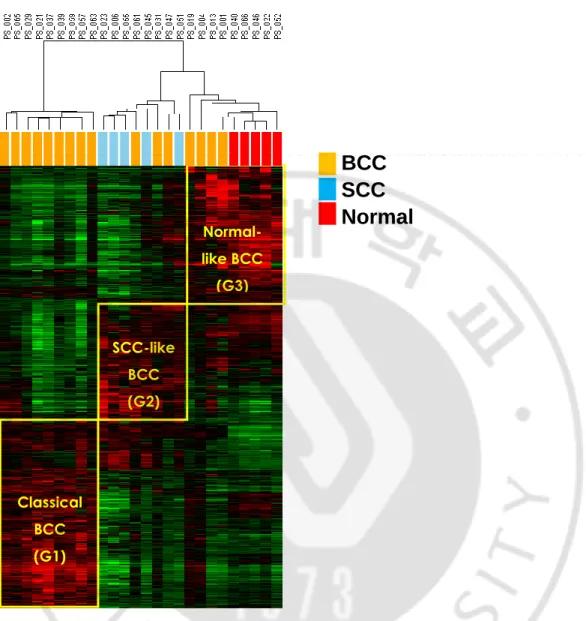
Next, to identify the differentially expressed genes as classifiers for the subtypes, we
applied an ANOVA test with P<0.01, which yielded a total of 3234 genes as classifiers
including 1347 genes for G1, 913 genes for G2, and 974 genes for G3 (Fig. 2). The
functional characteristics of the each classifier were analyzed by performing gene ontology
analysis using DAVID software. The genes up-regulated in the G1 (i.e., classical BCC) but
not in G2 and G3 were enriched with the genes encoding the cell cycle, regulation of
transcription, and epidermis development. Wnt and Hedgehog signaling pathways were
activated only in the G1, which have previously known to activate in the BCCs (Yamazaki et
al., 2001). Consistently, pathway analysis using KEGG database also identified BCC
pathway, suggesting that the gene expression profile reflects the BCC characteristics (Fig. 3).
The genes up-regulated in the G2 (i.e., SCC-like BCC) were enriched with the functions of
defense and inflammatory response. By contrast, the genes up-regulated in the G3 were
Fig. 2. The gene expression classifiers of the three groups. The three group classifiers are
identified by ANOVA test (P< 0.01) against the three subgroups of classical BCC, SCC-like
BCC, and normal-like BCC groups. Classical BCC (G1) SCC-like BCC (G2) Normal-like BCC (G3)
BCC
SCC
Normal
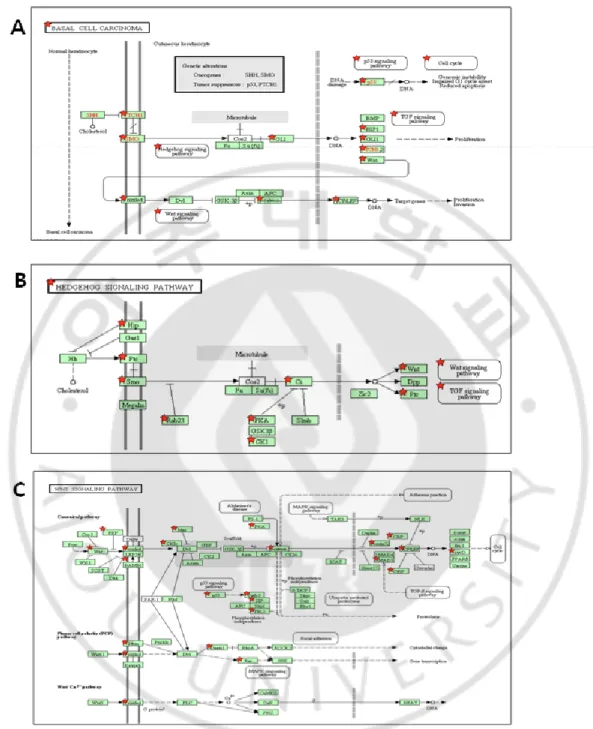
Fig. 3. The enriched pathways Classical BCC subgroup. Pathway analysis using KEGG
database shows enrichment of (A) basal cell carcinoma signaling, (B) Hedgehog signaling, and (C) WNT signaling pathways in the classical BCC subgroup. The classifiers identified in the classical BCC are indicated with red star.
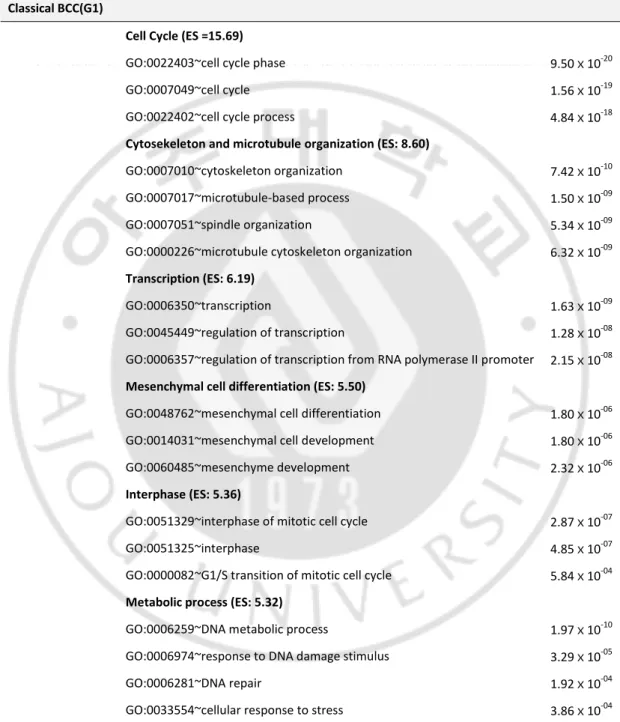
Table 2. Enrichment of gene functions in each group classifiers
BCC subtypes Functions P-value
Classical BCC(G1)
Cell Cycle (ES =15.69)
GO:0022403~cell cycle phase 9.50ⅹ10-20
GO:0007049~cell cycle 1.56ⅹ10-19
GO:0022402~cell cycle process 4.84ⅹ10-18
Cytosekeleton and microtubule organization (ES: 8.60)
GO:0007010~cytoskeleton organization 7.42ⅹ10-10
GO:0007017~microtubule-based process 1.50ⅹ10-09
GO:0007051~spindle organization 5.34ⅹ10-09
GO:0000226~microtubule cytoskeleton organization 6.32ⅹ10-09 Transcription (ES: 6.19)
GO:0006350~transcription 1.63ⅹ10-09
GO:0045449~regulation of transcription 1.28ⅹ10-08
GO:0006357~regulation of transcription from RNA polymerase II promoter 2.15ⅹ10-08 Mesenchymal cell differentiation (ES: 5.50)
GO:0048762~mesenchymal cell differentiation 1.80ⅹ10-06
GO:0014031~mesenchymal cell development 1.80ⅹ10-06
GO:0060485~mesenchyme development 2.32ⅹ10-06
Interphase (ES: 5.36)
GO:0051329~interphase of mitotic cell cycle 2.87ⅹ10-07
GO:0051325~interphase 4.85ⅹ10-07
GO:0000082~G1/S transition of mitotic cell cycle 5.84ⅹ10-04 Metabolic process (ES: 5.32)
GO:0006259~DNA metabolic process 1.97ⅹ10-10
GO:0006974~response to DNA damage stimulus 3.29ⅹ10-05
GO:0006281~DNA repair 1.92ⅹ10-04
Table 2. (Continued)
Hair and epidermis development (ES: 4.01)
GO:0001942~hair follicle development 3.74ⅹ10-05
GO:0022405~hair cycle process 3.74ⅹ10-05
GO:0022404~molting cycle process 3.74ⅹ10-05
GO:0042303~molting cycle 4.74ⅹ10-05
GO:0042633~hair cycle 4.74ⅹ10-05
GO:0007398~ectoderm development 6.45ⅹ10-04
GO:0008544~epidermis development 1.11ⅹ10-03
KEGG PATHWAY hsa05200:Pathways in cancer 4.12ⅹ10-15
hsa04110:Cell cycle 2.21ⅹ10-14
hsa04310:Wnt signaling pathway 2.39ⅹ10-07
hsa04115:p53 signaling pathway 3.41ⅹ10-07
hsa05217:Basal cell carcinoma 5.03ⅹ10-07
hsa04340:Hedgehog signaling pathway 1.68ⅹ10-03
SCC-like BCC(G2)
Defense response (ES: 2.72)
GO:0006952~defense response 3.63ⅹ10-05
GO:0009611~response to wounding 6.13ⅹ10-03
GO:0006954~inflammatory response 2.91ⅹ10-02
Epidermal development (ES: 2.51)
GO:0008544~epidermis development 4.63ⅹ10-04
GO:0007398~ectoderm development 4.71ⅹ10-04
GO:0009913~epidermal cell differentiation 1.12ⅹ10-03
GO:0030216~keratinocyte differentiation 2.23ⅹ10-03
GO:0030855~epithelial cell differentiation 2.74ⅹ10-03
GO:0031424~keratinization 3.88ⅹ10-02
GO:0060429~epithelium development 4.20ⅹ10-02
Cell adhesion (ES: 2.47)
GO:0022610~biological adhesion 1.39ⅹ10-03
GO:0007155~cell adhesion 1.39ⅹ10-03
Table 2. (Continued)
KEGG PATHWAY hsa04666:Fc gamma R-mediated phagocytosis 8.99ⅹ10-04
hsa04514:Cell adhesion molecules (CAMs) 3.27ⅹ10-03
hsa03010:Ribosome 2.58ⅹ10-02
hsa04670:Leukocyte transendothelial migration 3.63ⅹ10-02
Normal-like BCC(G3)
Fatty acid metabolism (ES: 8.06)
GO:0006631~fatty acid metabolic process 1.30ⅹ10-17
GO:0008610~lipid biosynthetic process 9.95ⅹ10-12
GO:0006633~fatty acid biosynthetic process 9.47ⅹ10-06
Steroid metabolism (ES: 6.65)
GO:0008202~steroid metabolic process 2.03ⅹ10-11
GO:0008203~cholesterol metabolic process 7.07ⅹ10-11
GO:0016125~sterol metabolic process 7.59ⅹ10-11
GO:0006694~steroid biosynthetic process 1.75ⅹ10-07
Catabolic process (ES: 4.05)
GO:0016054~organic acid catabolic process 1.77ⅹ10-08
GO:0046395~carboxylic acid catabolic process 1.77ⅹ10-08
GO:0009063~cellular amino acid catabolic process 4.27ⅹ10-05
KEGG PATHWAY hsa03320:PPAR signaling pathway 2.13ⅹ10-10
hsa00280:Valine, leucine and isoleucine degradation 3.19ⅹ10-08
hsa00900:Terpenoid backbone biosynthesis 7.52ⅹ10-05
hsa00620:Pyruvate metabolism 2.04ⅹ10-04
hsa00071:Fatty acid metabolism 2.04ⅹ10-04
hsa01040:Biosynthesis of unsaturated fatty acids 8.15ⅹ10-04
hsa00640:Propanoate metabolism 1.25ⅹ10-03
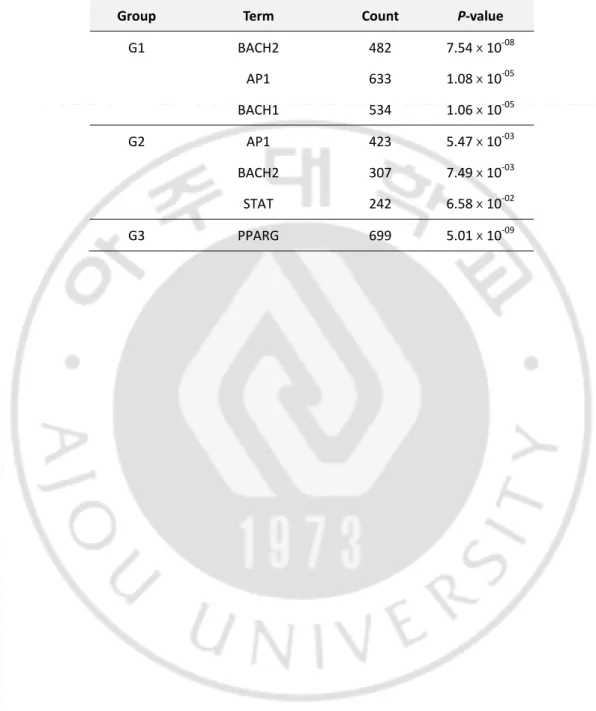
To predict the key regulatory molecules, we next sought the common transcription binding
sites (TFBS) in the gene classifiers of each subtype. Transcription factors including BACH1,
BACH2, and AP-1 were identified as the common regulators for the differential expression
of G1 with statistical significance (P<1.06 x10⁻⁵) (Table 3). Similarly, the gene classifiers for G2 (i.e., SCC-like BCC) were also commonly bound to AP-1, BACH2, and STAT. These
transcription factors have been known to play important roles in cell differentiation,
proliferation, angiogenesis, malignant transformation, and survival in many cancer types.
Consistent with the previous reports, our findings from gene expression profile analyses
imply the aggressive behaviors of SCC-like BCC compared to those of the classical BCC
(Bowman et al., 2000; Vieira et al., 2001; Calo et al., 2003; Hoeben et al., 2004; Liang et al.,
2012). By contrast, the gene classifiers for the G3 (i.e., Normal-like BCC) were commonly
bound to PPARG, which might associated with the active lipid metabolism of the G3
Table 3. Common transcription factor binding sites identified in each group
Group Term Count P-value
G1 BACH2 482 7.54ⅹ10-08 AP1 633 1.08ⅹ10-05 BACH1 534 1.06ⅹ10-05 G2 AP1 423 5.47ⅹ10-03 BACH2 307 7.49ⅹ10-03 STAT 242 6.58ⅹ10-02 G3 PPARG 699 5.01ⅹ10-09
C. External Validation of the Gene Expression Profiling Analysis.
To validate our analysis, we further performed a validation analysis by using a public gene
expression profile of NMSCs including 15 cases of BCC and 11 cases of SCC samples,
which were obtained from GEO database (GSE7553). To avoid possible effect of the
cross-platform difference, we applied an integrated analysis of the two data sets. We normalized
and integrated the data sets of ours (Set A) and the public data (Set B) together as described
in Materials and Methods Section. Then unsupervised clustering analysis was applied to the
integrated data set, which could reveal distinct three subtypes comprised with 24, 19, and 13
cases of samples, respectively (Fig. 4). The subgroups of Set A could be re-observed in the
integrated clustering analysis. This result may suggest that our classification of the tumors
with the three subtypes can be applied to the external dataset of Set B regardless of the
difference of platform.
In addition, unsupervised clustering analysis was separately performed on the Set A and Set
B, to evaluate the consistency of clustering result in individual data set. As expected, the
clustering of individual data sets also revealed same clustering results with that of the
integrated dataset (Fig. 5B). To address the uncertainty the clustering results, we applied
pvclust algorithm, which calculates the significance of the clustering results by applying
bootstrap resampling method (Suzuki and Shimodaira, 2006). The statistical significance of
the clustering results of Set A and B was evaluated by approximately unbiased (AU) P-value,
>0.88 and >0.67, respectively, which indicate the robustness of the clustering results in both
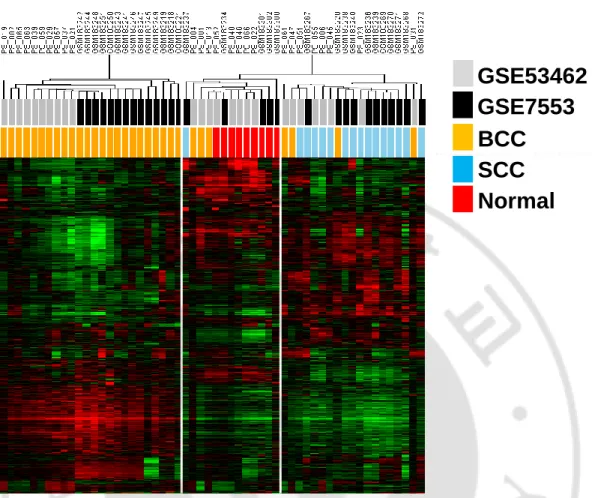
Fig. 4. Gene expression profiles of the integrated data set.The data sets of ours and an independent dataset are integrated together as described in Materials and Methods. The
patients’ samples are stratified into three subgroups based on the gene expression similarity, which are independent of data platforms. Data platforms are indicated by black and grey bars.
BCC
SCC
Normal
GSE53462
GSE7553
gene expression profiling could be observed in both Set A and Set B with consistency and
robustness regardless of cross-platform and cohort differences.
Next, we tried to compare the gene sets expressed in the subgroups of Set A and Set B. The
Set B classifiers for the three subtypes were determined by applying ANOVA test with the
same cutoff P<0.01, which yielded 3249 gene sets. Of these, only the 943 genes (29%) were
overlapped with the Set A classifiers for Set A, revealing substantial differences between the
classifiers of Set A and Set B. Indeed, when we applied the gene set classifiers identified in
the Set A to the Set B directly, the classifiers could not identify subgroups in Set B (data not
shown). This might be due to cross platform difference of the data sets. However, as like the
set A classifiers, the set B classifiers also showed five distinct modular expression patterns
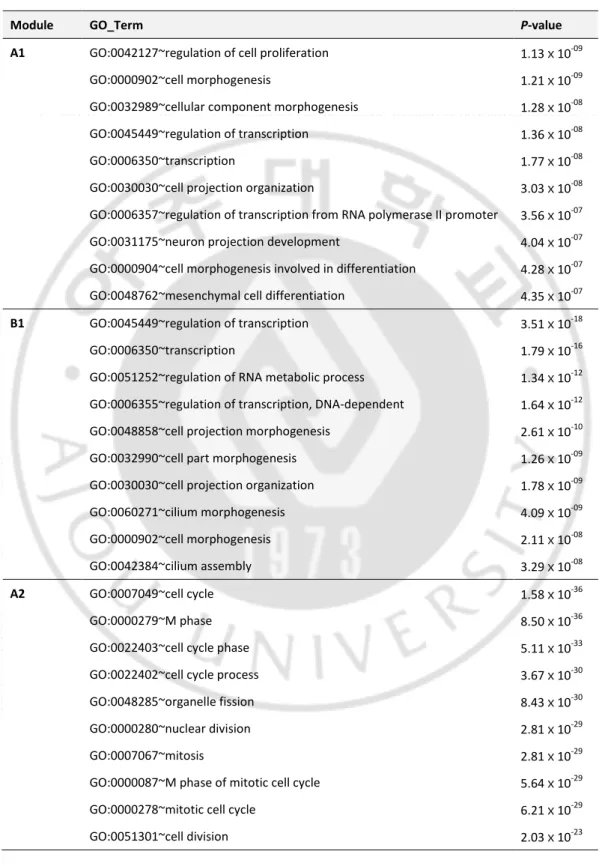
across the subtypes (Fig. 5A). Remarkably, when we compared the functional enrichment of
the classifiers of Set A and Set B, the classifiers showed the shared functional enrichment in
both data sets. The modules of A1–A5 of Set A showed matched functional enrichment in
the modules of B1–B5 of Set B, respectively (Fig. 5A and Table 4). The module 1 (i.e., A1
and B1) expressed in the subtype G1 showed shared functions of transcription-related genes.
The module 2 (i.e., A2 and B2) was enriched with the cell cycle and DNA replication-related
genes, indicating the active proliferation of G1 and G2 tumors compared to the normal like
BCC,G3. The module 3 (i.e., A3 and B3), which was expressed in the G2 and G3 but not in
G1, was associated with oxidative stress and metabolism-related genes. This indicates the
decreased oxidative stress is one of key features in subtype G1. The module 4 (i.e., A4 and
B4) was expressed only in the subtype of SCC like BCC (G1), and was enriched with
characterized with the active immune response. Interestingly, the proliferation module 2 (A2
and B2) was activated in the classical BCC and the SCC like BCC. By contrast, the
normal-like BCC and normal tissues in both data sets shared the expression of module 5 (i.e., A5 and
B5), which were featured with the enriched fatty acid metabolic process. To confirm this
observation, we analyzed the cell proliferation properties of the specimen by performing
immunohistochemistry analysis for ki67. As expected, the classical and the SCC-like BCCs
demonstrated more intense and higher number of positive cells for ki67, while the
normal-like BCC showed less positive cells (Fig. 5C). However, the statistical significance of the
group difference was not assessed due to limited availability of the sample specimens. Taken
together, our integrative analysis could reveal robust subgroups independent of data sets, and
each subtype could be characterized by the functionally enriched expression modules. This
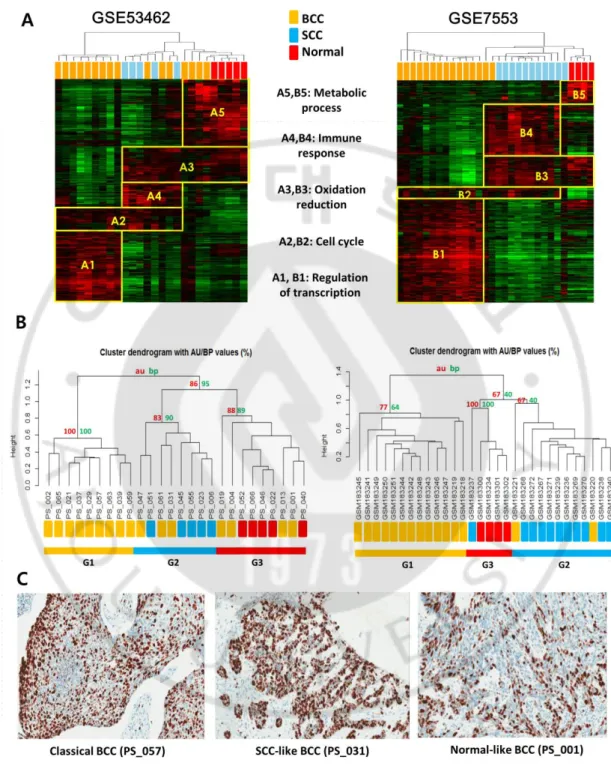
Fig. 5. Comparison of the gene expression modules in independent data sets. (A) The
identified from the integrated independent data sets of GSE53462 and GSE7553,
respectively. Each data set shows five modules with the matched functional enrichment, that
is, A1–B1 (regulation of transcription), A2–B2 (cell cycle), A3–B3 (oxidation reduction),
A4–B4 (Immune response), and A5–B5 (metabolic process). (B) Unsupervised clustering
analysis was performed on the gene expression profiles of Set A (A) and Set B (B),
separately. BCC, SCC, and normal tissues are indicated with different colors. Using the
pvcluster algorithm implemented in R package, the uncertainty of the clustering results was
estimated. The approximately unbiased (AU) P-values and (bootstrap probability (BP)
values for each cluster are indicated with red and green colored numbers, respectively. (C)
All samples were immunohistochemically stained by antibody against ki67 antigen. The
final reaction product has a reddish brown color. The classical BCC and SCC-like BCC
illustrated more intense and higher number of positive cells for ki67 compared to the
Table 4. The list of functional modules identified from two independent data sets
Module GO_Term P-value
A1 GO:0042127~regulation of cell proliferation 1.13ⅹ10-09
GO:0000902~cell morphogenesis 1.21ⅹ10-09
GO:0032989~cellular component morphogenesis 1.28ⅹ10-08
GO:0045449~regulation of transcription 1.36ⅹ10-08
GO:0006350~transcription 1.77ⅹ10-08
GO:0030030~cell projection organization 3.03ⅹ10-08
GO:0006357~regulation of transcription from RNA polymerase II promoter 3.56ⅹ10-07
GO:0031175~neuron projection development 4.04ⅹ10-07
GO:0000904~cell morphogenesis involved in differentiation 4.28ⅹ10-07
GO:0048762~mesenchymal cell differentiation 4.35ⅹ10-07
B1 GO:0045449~regulation of transcription 3.51ⅹ10-18
GO:0006350~transcription 1.79ⅹ10-16
GO:0051252~regulation of RNA metabolic process 1.34ⅹ10-12 GO:0006355~regulation of transcription, DNA-dependent 1.64ⅹ10-12
GO:0048858~cell projection morphogenesis 2.61ⅹ10-10
GO:0032990~cell part morphogenesis 1.26ⅹ10-09
GO:0030030~cell projection organization 1.78ⅹ10-09
GO:0060271~cilium morphogenesis 4.09ⅹ10-09
GO:0000902~cell morphogenesis 2.11ⅹ10-08
GO:0042384~cilium assembly 3.29ⅹ10-08
A2 GO:0007049~cell cycle 1.58ⅹ10-36
GO:0000279~M phase 8.50ⅹ10-36
GO:0022403~cell cycle phase 5.11ⅹ10-33
GO:0022402~cell cycle process 3.67ⅹ10-30
GO:0048285~organelle fission 8.43ⅹ10-30
GO:0000280~nuclear division 2.81ⅹ10-29
GO:0007067~mitosis 2.81ⅹ10-29
GO:0000087~M phase of mitotic cell cycle 5.64ⅹ10-29
GO:0000278~mitotic cell cycle 6.21ⅹ10-29
Table 4. (Continued)
B2 GO:0022403~cell cycle phase 3.14ⅹ10-39
GO:0000279~M phase 4.76ⅹ10-39
GO:0007049~cell cycle 4.33ⅹ10-38
GO:0022402~cell cycle process 1.08ⅹ10-34
GO:0000278~mitotic cell cycle 3.77ⅹ10-34
GO:0000280~nuclear division 7.05ⅹ10-32
GO:0007067~mitosis 7.05ⅹ10-32
GO:0000087~M phase of mitotic cell cycle 1.38ⅹ10-31
GO:0048285~organelle fission 3.13ⅹ10-31
GO:0051301~cell division 1.96ⅹ10-28
A3 GO:0055114~oxidation reduction 5.17ⅹ10-04
GO:0032689~negative regulation of interferon-gamma production 6.19ⅹ10-04
GO:0006690~icosanoid metabolic process 1.51ⅹ10-03
GO:0046638~positive regulation of alpha-beta T cell differentiation 1.75ⅹ10-03
GO:0015721~bile acid and bile salt transport 1.99ⅹ10-03
GO:0033559~unsaturated fatty acid metabolic process 2.32ⅹ10-03 GO:0046637~regulation of alpha-beta T cell differentiation 4.12ⅹ10-03
GO:0007242~intracellular signaling cascade 4.73ⅹ10-03
GO:0046635~positive regulation of alpha-beta T cell activation 4.77ⅹ10-03
GO:0008219~cell death 6.23ⅹ10-03
B3 GO:0055114~oxidation reduction 2.91ⅹ10-07
GO:0006631~fatty acid metabolic process 3.86ⅹ10-06
GO:0008202~steroid metabolic process 5.05ⅹ10-06
GO:0008610~lipid biosynthetic process 6.93ⅹ10-06
GO:0033559~unsaturated fatty acid metabolic process 2.11ⅹ10-05
GO:0010033~response to organic substance 3.06ⅹ10-05
GO:0006690~icosanoid metabolic process 9.81ⅹ10-05
GO:0006979~response to oxidative stress 1.21ⅹ10-04
GO:0016126~sterol biosynthetic process 1.40ⅹ10-04
Table 4. (Continued)
A4 GO:0006955~immune response 3.72ⅹ10-15
GO:0006952~defense response 5.43ⅹ10-08
GO:0006968~cellular defense response 7.01ⅹ10-08
GO:0009615~response to virus 9.91ⅹ10-05
GO:0009611~response to wounding 2.78ⅹ10-04
GO:0006414~translational elongation 3.21ⅹ10-04
GO:0019882~antigen processing and presentation 5.20ⅹ10-04
GO:0042554~superoxide anion generation 1.22ⅹ10-03
GO:0050778~positive regulation of immune response 3.35ⅹ10-03
GO:0006954~inflammatory response 3.75ⅹ10-03
B4 GO:0006955~immune response 2.26ⅹ10-07
GO:0007264~small GTPase mediated signal transduction 2.97ⅹ10-05
GO:0016192~vesicle-mediated transport 1.49ⅹ10-04
GO:0009617~response to bacterium 1.60ⅹ10-04
GO:0044093~positive regulation of molecular function 2.15ⅹ10-04 GO:0002237~response to molecule of bacterial origin 2.20ⅹ10-04
GO:0007242~intracellular signaling cascade 3.23ⅹ10-04
GO:0006915~apoptosis 3.81ⅹ10-04
GO:0006916~anti-apoptosis 3.81ⅹ10-04
GO:0034097~response to cytokine stimulus 4.07ⅹ10-04
A5 GO:0055114~oxidation reduction 5.53ⅹ10-18
GO:0006631~fatty acid metabolic process 1.30ⅹ10-17
GO:0008610~lipid biosynthetic process 9.95ⅹ10-12
GO:0008202~steroid metabolic process 2.03ⅹ10-11
GO:0008203~cholesterol metabolic process 7.07ⅹ10-11
GO:0016125~sterol metabolic process 7.59ⅹ10-11
GO:0016054~organic acid catabolic process 1.77ⅹ10-08
GO:0046395~carboxylic acid catabolic process 1.77ⅹ10-08
GO:0006694~steroid biosynthetic process 1.75ⅹ10-07
Table 4. (Continued)
B5 GO:0006631~fatty acid metabolic process 6.61ⅹ10-10
GO:0043434~response to peptide hormone stimulus 9.49ⅹ10-07 GO:0019216~regulation of lipid metabolic process 1.01ⅹ10-06
GO:0040008~regulation of growth 1.36ⅹ10-06
GO:0050873~brown fat cell differentiation 3.73ⅹ10-06
GO:0009725~response to hormone stimulus 4.33ⅹ10-06
GO:0009719~response to endogenous stimulus 5.88ⅹ10-06
GO:0010565~regulation of cellular ketone metabolic process 8.93ⅹ10-06
GO:0016042~lipid catabolic process 1.89ⅹ10-05
D. PLAU is a Putative Key Regulator of SCC-like BCC
Our analysis could reveal novel subtypes of BCC based on its similarity of gene expression.
That is SCC like BCC and normal-like BCC. Noticeably, we observed the prominent
expression of the module 4 in the SCC-like BCC, which represented the activation of
immune-related genes. This indicates the activated immune reaction might be associated
with the distinct progression of the subtype SCC-like BCC. In order to predict key regulators
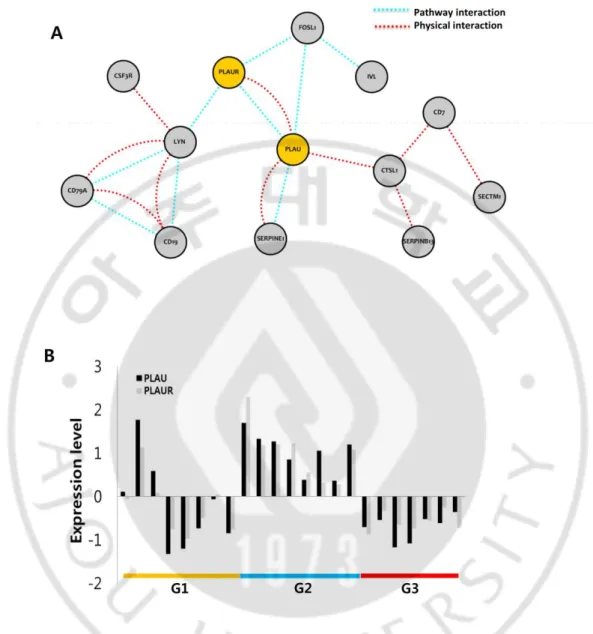
for the module 4 expression, we performed network analysis of the module 4 genes by using
protein and genetic interaction and pathway networks implemented in GeneMANIA
software (Warde-Farley et al., 2010). The analysis revealed the most prominent and core
interaction of PLAU and PLAUR with multiple interaction partners of the module 4 genes
(Fig. 6A). Substantial difference of the PLAU and PLAUR gene expressions among the
subtypes could be observed (Fig. 6B). Consistent with our result, a previous study has shown
the differential expression of urokinase-type plasminogen activator (u-PA) in SCC but not in
BCC (Romer et al., 2001). Thus, we could suggest that the PLAU/PLAUR plays a pivotal
role in the development of the novel subtype SCC-like BCC. Also, the expression of
PLAU/PLAUR can be an indicative biomarker for predicting the aggressive subtype of
Fig. 6. PLAU and PLAUR network from the immune response module. (A) The
SCC-like BCC-specific expression of module A4 with the 368 genes shows common interaction
partner with PLAU and PLAUR. The network is constructed by using GeneMANIA software
with protein-protein interactions and pathway interactions. (B) The expression of PLAU and
PLAUR show the specific expression in the G2 (SCC-like) groups compared to those in G1
IV. DISCUSSION
In the present study, we performed a gene expression profiling analysis of NMSCs and
identified novel subtypes of BCC that is SCC-like BCC and normal-like BCC. Our findings
could be validated by demonstrating the existence of the same gene expression patterns in an
independent data set. Moreover, the distinct expression modules showed same functional
enrichment in the both independent data sets. We, thus, conclude that our molecular
classification of BCCs into three subgroups of SCC-like, normal-like, and classical-BCC is
robust and consistent regardless of platform and cohort difference of data set.
Our molecular classification also provides novel insight into the heterogeneity of BCCs.
Functional enrichment and pathway analyses revealed the molecular characteristics of each
subtype. The classical BCC showed the enriched expression of transcription signature with
the activation of Wnt and Hedgehog signaling pathways, which were well known key
features of BCC. The SCC-like BCC was characterized by the activation of
immune-response genes and oxidative stress-related genes. Previously, the functional relationship
between inflammation and cancer has been studied extensively (see details in review
(Coussens and Werb, 2002)). It has been suggested that inflammatory signals including the
release of chemokines and cytokines play regulatory roles in cancer progression. In addition,
network analysis showed the PLAU/PLAUR as a key regulator of SCC-like BCC. Congruent
with our results, PLAU, encoding a serine protease, has been known to degrade extracellular
matrix, promoting tumor cell development and metastasis in SCC and other cancer types
et al., 2006). Indeed, PLAU degrades the extracellular matrix and regulates intracellular
signal pathways for cancer cell survival (Santibanez, 2013). Thus, we could suggest that the
aberrant activation of immune response particularly the PLAU/PLAUR signaling might have
a pivotal role in the development of the aggressive subtype of SCC-like BCC. On the other
hand, the normal-like BCC showed the distinct expression of lipid metabolism-related genes
compared to those of classical and SCC-like BCCs. As an altered energy resource, lipid
metabolism has been known to play a critical role in caner development and progression
(Santos and Schulze, 2012). This could be confirmed by the expression of B2 module in an
independent data set (see Fig. 5A and Table 4). These altered expressions of metabolism
related genes were opposite to the expression of cell cycle-related genes in both classical and
SCC-like BCCs. This may indicate the imbalanced regulation of cell cycle regulators on the
cell cycle and lipid metabolism pathways as described previously (Fajas, 2013).
Like BCC, SCCs also have been noticed to have heterogeneous progression, but we could
not define the molecular heterogeneity of SCC, because only the five cases of SCC samples
were included in our present study. Large scaled study might be required for further
elaboration of the SCC heterogeneity. In conclusion, by comparing the gene expression
profiling of NMSCs, we could stratify BCC into three distinct molecular subtypes providing
REFERENCES
1. Alam M, Ratner D: Cutaneous squamous-cell carcinoma. N Engl J Med 344:
975-983, 2001
2. Andreasen PA, Kjoller L, Christensen L, Duffy MJ: The urokinase-type
plasminogen activator system in cancer metastasis: a review. Int J Cancer 72: 1-22,
1997
3. Armstrong BK, Kricker A: The epidemiology of UV induced skin cancer. J
Photochem Photobiol B 63: 8-18, 2001
4. Asplund A, Gry Bjorklund M, Sundquist C, Stromberg S, Edlund K, Ostman A,
Nilsson P, Ponten F, Lundeberg J: Expression profiling of microdissected cell
populations selected from basal cells in normal epidermis and basal cell carcinoma.
Br J Dermatol 158: 527-538, 2008
5. Backvall H, Asplund A, Gustafsson A, Sivertsson A, Lundeberg J, Ponten F:
Genetic tumor archeology: microdissection and genetic heterogeneity in squamous
and basal cell carcinoma. Mutat Res 571: 65-79, 2005
6. Bowman T, Garcia R, Turkson J, Jove R: STATs in oncogenesis. Oncogene 19:
2474-2488, 2000
7. Calo V, Migliavacca M, Bazan V, Macaluso M, Buscemi M, Gebbia N, Russo A:
STAT proteins: from normal control of cellular events to tumorigenesis. J Cell
Physiol 197: 157-168, 2003
9. Crowson AN: Basal cell carcinoma: biology, morphology and clinical implications.
Mod Pathol 19 Suppl 2: S127-147, 2006
10. Dennis G, Jr., Sherman BT, Hosack DA, Yang J, Gao W, Lane HC, Lempicki RA:
DAVID: Database for Annotation, Visualization, and Integrated Discovery. Genome
Biol 4: P3, 2003
11. Eisen MB, Spellman PT, Brown PO, Botstein D: Cluster analysis and display of
genome-wide expression patterns. Proc Natl Acad Sci U S A 95: 14863-14868, 1998
12. Fajas L: Re-thinking cell cycle regulators: the cross-talk with metabolism. Front
Oncol 3: 4, 2013
13. Haider AS, Peters SB, Kaporis H, Cardinale I, Fei J, Ott J, Blumenberg M, Bowcock
AM, Krueger JG, Carucci JA: Genomic analysis defines a cancer-specific gene
expression signature for human squamous cell carcinoma and distinguishes
malignant hyperproliferation from benign hyperplasia. J Invest Dermatol 126:
869-881, 2006
14. Harbeck N, Kates RE, Gauger K, Willems A, Kiechle M, Magdolen V, Schmitt M:
Urokinase-type plasminogen activator (uPA) and its inhibitor PAI-I: novel
tumor-derived factors with a high prognostic and predictive impact in breast cancer.
Thromb Haemost 91: 450-456, 2004
15. Heller ER, Gor A, Wang D, Hu Q, Lucchese A, Kanduc D, Katdare M, Liu S, Sinha
AA: Molecular signatures of basal cell carcinoma susceptibility and pathogenesis: a
16. Hoeben A, Landuyt B, Highley MS, Wildiers H, Van Oosterom AT, De Bruijn EA:
Vascular endothelial growth factor and angiogenesis. Pharmacol Rev 56: 549-580,
2004
17. Kim GK, Del Rosso JQ, Bellew S: Skin cancer in asians: part 1: nonmelanoma skin
cancer. J Clin Aesthet Dermatol 2: 39-42, 2009
18. Kwon SM, Cho H, Choi JH, Jee BA, Jo Y, Woo HG: Perspectives of integrative
cancer genomics in next generation sequencing era. Genomics Inform 10: 69-73,
2012
19. Lee CH, Olson P, Evans RM: Minireview: lipid metabolism, metabolic diseases, and
peroxisome proliferator-activated receptors. Endocrinology 144: 2201-2207, 2003
20. Leiter U, Garbe C: Epidemiology of melanoma and nonmelanoma skin cancer--the
role of sunlight. Adv Exp Med Biol 624: 89-103, 2008
21. Liang Y, Wu H, Lei R, Chong RA, Wei Y, Lu X, Tagkopoulos I, Kung SY, Yang Q,
Hu G, Kang Y: Transcriptional network analysis identifies BACH1 as a master
regulator of breast cancer bone metastasis. J Biol Chem 287: 33533-33544, 2012
22. Lind MH, Rozell B, Wallin RP, van Hogerlinden M, Ljunggren HG, Toftgard R, Sur
I: Tumor necrosis factor receptor 1-mediated signaling is required for skin cancer
development induced by NF-kappaB inhibition. Proc Natl Acad Sci U S A 101:
4972-4977, 2004
23. Nindl I, Dang C, Forschner T, Kuban RJ, Meyer T, Sterry W, Stockfleth E:
Identification of differentially expressed genes in cutaneous squamous cell
24. Quintana RM, Dupuy AJ, Bravo A, Casanova ML, Alameda JP, Page A,
Sanchez-Viera M, Ramirez A, Navarro M: A transposon-based analysis of gene mutations
related to skin cancer development. J Invest Dermatol 133: 239-248, 2013
25. Riker AI, Enkemann SA, Fodstad O, Liu S, Ren S, Morris C, Xi Y, Howell P, Metge
B, Samant RS, Shevde LA, Li W, Eschrich S, Daud A, Ju J, Matta J: The gene
expression profiles of primary and metastatic melanoma yields a transition point of
tumor progression and metastasis. BMC Med Genomics 1: 13, 2008
26. Rogers HW, Weinstock MA, Harris AR, Hinckley MR, Feldman SR, Fleischer AB,
Coldiron BM: Incidence estimate of nonmelanoma skin cancer in the United States,
2006. Arch Dermatol 146: 283-287, 2010
27. Romer J, Pyke C, Lund LR, Ralfkiaer E, Dano K: Cancer cell expression of
urokinase-type plasminogen activator receptor mRNA in squamous cell carcinomas
of the skin. J Invest Dermatol 116: 353-358, 2001
28. Rubin AI, Chen EH, Ratner D: Basal-cell carcinoma. N Engl J Med 353: 2262-2269,
2005
29. Santibanez JF: Transforming growth factor-Beta and urokinase-type plasminogen
activator: dangerous partners in tumorigenesis-implications in skin cancer. ISRN
Dermatol 2013: 597927, 2013
30. Santos CR, Schulze A: Lipid metabolism in cancer. Febs j 279: 2610-2623, 2012
31. Serewko MM, Popa C, Dahler AL, Smith L, Strutton GM, Coman W, Dicker AJ,
Saunders NA: Alterations in gene expression and activity during squamous cell
32. Skelly MM, Troy A, Duffy MJ, Mulcahy HE, Duggan C, Connell TG, O'Donoghue
DP, Sheahan K: Urokinase-type plasminogen activator in colorectal cancer:
relationship with clinicopathological features and patient outcome. Clin Cancer Res
3: 1837-1840, 1997
33. Suzuki R, Shimodaira H: Pvclust: an R package for assessing the uncertainty in
hierarchical clustering. Bioinformatics 22: 1540-1542, 2006
34. Ulrich C, Kanitakis J, Stockfleth E, Euvrard S: Skin cancer in organ transplant
recipients--where do we stand today? Am J Transplant 8: 2192-2198, 2008
35. Urban P, Vuaroqueaux V, Labuhn M, Delorenzi M, Wirapati P, Wight E, Senn HJ,
Benz C, Eppenberger U, Eppenberger-Castori S: Increased expression of
urokinase-type plasminogen activator mRNA determines adverse prognosis in ErbB2-positive
primary breast cancer. J Clin Oncol 24: 4245-4253, 2006
36. Vieira SA, Deininger MW, Sorour A, Sinclair P, Foroni L, Goldman JM, Melo JV:
Transcription factor BACH2 is transcriptionally regulated by the BCR/ABL
oncogene. Genes Chromosomes Cancer 32: 353-363, 2001
37. Warde-Farley D, Donaldson SL, Comes O, Zuberi K, Badrawi R, Chao P, Franz M,
Grouios C, Kazi F, Lopes CT, Maitland A, Mostafavi S, Montojo J, Shao Q, Wright
G, Bader GD, Morris Q: The GeneMANIA prediction server: biological network
integration for gene prioritization and predicting gene function. Nucleic Acids Res 38:
38. Woo HG, Lee JH, Yoon JH, Kim CY, Lee HS, Jang JJ, Yi NJ, Suh KS, Lee KU,
Park ES, Thorgeirsson SS, Kim YJ: Identification of a cholangiocarcinoma-like gene
expression trait in hepatocellular carcinoma. Cancer Res 70: 3034-3041, 2010
39. Yamazaki F, Aragane Y, Kawada A, Tezuka T: Immunohistochemical detection for
nuclear beta-catenin in sporadic basal cell carcinoma. Br J Dermatol 145: 771-777,
2001
40. Yanofsky VR, Mercer SE, Phelps RG: Histopathological variants of cutaneous
-국문요약-
유전자발현 프로파일링을 통한 피부 기저세포암의
분자학적 분류
아주대학교 대학원 의학과 임 효 섭 (지도교수: 박 명 철) 기저세포암과 편평세포암 등의 비흑색종피부암은 피부암 중에 가장 흔하다. 이 피부암이 병리학적으로 임상적으로 많은 공통점을 가지고 있음에도 불구하고, 분자 수준에서의 유사성과 이질성은 충분히 밝혀져 있지 않고 있다. 이에 기저세포암과 편평세포암 그리고 정상 피부조직을 유전자발현 프로파일링을 통하여 비교 분석 하였고, 이로부터 기저세포암을 classical, SCC-like, normal-like BCC 세 subtype으로 분류할 수 있었다. 실험 분석에서 Functional enrichmentanalysis와 functional pathway analysis을 통해 각 subtype에서 분자학적 특성을
확인하였다. Classical BCC는 기저세포암에서 잘 표현되는 Wnt와 Hedgehog signaling pathway를 통한 활성화 산물을 잘 발현한 반면에 SCC-like BCC는
면역반응 유전자와 oxidative stress 관련 유전자가 잘 발현하였다. Network analysis를 통해 PLAU/PLAUR가 SCC-like BCC의 핵심유전자임을 알 수 있었다.
실험 분석에서 독립적인 자료로부터 이러한 분자학적 subtype이 있다는 것을 확인할 수 있었고, 명확한 functional enrichment로 입증할 수 있었다. 우리는 이 실험을 통해 기저세포암의 비균질적인 진행을 예측하는데 도움이 될 수 있는 분자학적인 분류를 제안하는 바이다. 핵심어: 비흑색종피부암, 기저세포암종, 편평세포암종, 유전자발현 프로파일링, 비균질성