저작자표시-비영리-변경금지 2.0 대한민국 이용자는 아래의 조건을 따르는 경우에 한하여 자유롭게 l 이 저작물을 복제, 배포, 전송, 전시, 공연 및 방송할 수 있습니다. 다음과 같은 조건을 따라야 합니다: l 귀하는, 이 저작물의 재이용이나 배포의 경우, 이 저작물에 적용된 이용허락조건 을 명확하게 나타내어야 합니다. l 저작권자로부터 별도의 허가를 받으면 이러한 조건들은 적용되지 않습니다. 저작권법에 따른 이용자의 권리는 위의 내용에 의하여 영향을 받지 않습니다. 이것은 이용허락규약(Legal Code)을 이해하기 쉽게 요약한 것입니다. Disclaimer 저작자표시. 귀하는 원저작자를 표시하여야 합니다. 비영리. 귀하는 이 저작물을 영리 목적으로 이용할 수 없습니다. 변경금지. 귀하는 이 저작물을 개작, 변형 또는 가공할 수 없습니다.
Master’s Thesis in Biomedical Sciences
Gender difference in the skeletal muscle
ageing and regulation of myosin heavy
chain expression by TIS21 gene in the
C57BL/6J mice
Ajou University Graduate School
Major in Molecular Medicine
Gender difference in the skeletal muscle
ageing and regulation of myosin heavy
chain expression by TIS21 gene in the
C57BL/6J mice
In Kyoung Lim, Advisor
I submit this thesis as the
Master’s thesis in Biomedical Sciences
February, 2019
Ajou University Graduate School
Major in Molecular Medicine
This certifies that the dissertation of
Mst Reshma Khatun is approved.
SUPERVISORY COMMITTEE
Ajou University Graduate School
December 24
th, 2018
i -ABSTRACT-
Gender difference in the skeletal muscle ageing and
regulation of myosin heavy chain expression by
TIS21 gene in the C57BL/6J mice
There are evidences TIS21/BTG2/PC3, an antiproliferative gene, is essential for multiple biological functions such as cell proliferation, growth, differentiation, senescence and cell death. However, no study has been found that examined its role in muscle function and maintenance. In this study, we investigated whether TIS21 has any role in the regulation of muscle protein, myosin heavy chain (MyHCs), expression in gastrocnemius (GA) skeletal muscle of male and female mice along with their ageing process. Firstly, we measured specific changes of GA muscle and body weight and their ratio at different age of C57BL/6J male and female mice. The absolute muscle and body weight were significantly higher in the TIS21-knock out (KO) young (12 wk) and mid-old (38 wk) male mice as compared with TIS21-wild type (WT). However, there was no significant change in the muscle and body weight and their ratio between the TIS21 WT and TIS21 KO female mice. Secondly, our immunoblot data revealed that KO of TIS21 gene results significant reduction of MyHCs protein expression in GA of mid-old (34 wk-38 wk) female mice. The reduction was also significant in the old female mice (19 months). However, TIS21 KO male mice did not show that kind of significant decline in MyHCs protein expression compared to its WT in ageing response. Furthermore, analysis of mRNA expression by Real-time PCR showed that the transcription of MyHC2a and MyHC2b (type II fiber isoforms) significantly downregulated in the old TIS21 KO-female mice (19 months) rather than old male mice (24 months) compared to its WT. Finally, transient transfection including TIS21 overexpression into C2C12 cells following luciferase assay demonstrates that TIS21 might regulate
ii
the expression of MyHCs from their promoter level. Overall, our data implicate a potential role of TIS21 in MyHCs expression, where TIS21 controls the transcriptional level in female mice.
iii
TABLE OF CONTENTS
ABSTRACT... i
TABLE OF CONTENTS... iii
LIST OF FIGURES... v
LIST OF TABLES... vi
ABBREVIATIONS... vii
I. INTRODUCTION... 1
II. MATERIALS AND METHODS... 5
2.1. Ethical statement... 5
2.2. Animals and tissue sample collection... 5
2.3. Cell culture... 5
2.4. Genomic DNA isolation and genotyping of TIS21 WT & TIS21 KO mice... 6
2.5. Muscle homogenization for western blotting... 7
2.6. Western blotting analysis... 7
2.7. RNA isolation and quality control... 8
2.8. cDNA synthesis and Quantitative Real -Time PCR analysis... 9
2.9. Luciferase reporter vector construct preparation... 9
2.10. Transfection and Luciferase assay... 10
iv III. RESULTS
3.1. Genotyping of TIS21 Wild type (TIS21 WT) and TIS21 Knockout (TIS21
KO) mice... 14
3.2. Changes in body weight, GA muscle mass and GA muscle mass vs body weight ratio in TIS21 WT and TIS21 KO male and female mice... 17
3.3. Effect of TIS21 in myosin heavy chain (MyHCs) protein expression in gastrocnemius skeletal muscle of male and female mice... 22
3.4. Integrity checking of total RNA isolated from gastrocnemius muscle of TIS21 WT and TIS21 KO male and female mice... 31
3.5. Effect of TIS21 in mRNA expression of myosin heavy chain (MyHC) isoforms in gastrocnemius skeletal muscle of male and female mice... 34
3.6. Molecular function of TIS21 in the regulation of MyHCs expression... 37
IV. DISCUSSION... 40
REFERENCES... 43
v
LIST OF FIGURES
Figure 1: PCR based genotyping gels... 15 Figure 2: Comparative body weight, GA wet weight and ratio of GA wet weight vs
BW in various age groups of TIS21WT and TIS21KO male and female mice... 20
Figure 3: Myosin heavy chain (MyHCs) protein expression in gastrocnemius
muscle of TIS21 WT and TIS21 KO male mice... 23
Figure 4: Myosin heavy chain (MyHCs) protein expression in gastrocnemius
muscle of TIS21 WT and TIS21 KO female mice... 25
Figure 3.3.S1: Age dependent myosin heavy chain (MyHCs) protein expression in gastrocnemius muscle of male mice... 27
Figure 3.3.S2: Age dependent myosin heavy chain (MyHCs) protein expression in gastrocnemius muscle of female mice... 29
Figure 5: Integrity checking of total RNA isolated from gastrocnemius muscle...32 Figure 6: mRNA expression of MyHC isoforms in the gastrocnemius skeletal
muscle... 35
vi
LIST OF TABLES
Table 1. Primer sequences for PCR based mouse genotyping... 12 Table 2. Primer sequences used in Real-Time PCR... 13 Table 3. Average body weight (BW) reported in gram (g), average GA wet weight
reported in milligram (mg), and average GA wet weight divided by average BW reported in mg / g for TIS21 WT and TIS21 KO male mice in different age group ... 18
Table 4. Average body weight (BW) reported in gram (g), average GA wet weight
reported in milligram (mg), and average GA wet weight divided by average BW reported in mg / g for TIS21 WT and TIS21 KO female mice in different age group ... 19
vii
ABBREVIATIONS
MyHC: Myosin Heavy Chain TIS21: TPA-inducible sequence 21
TPA: 12-O-tetradecanoyl phorbol-13-acetate BTG2: B cell translocation gene 2
PC3: Pheochromocytoma cell 3 WT: Wild type
KO: Knockout GA: Gastrocnemius
cDNA: Complementary deoxyribonucleic acid
RT-PCR: Reverse transcription polymerase chain reaction qPCR: Quantitative polymerase chain reaction
1
I. INTRODUCTION
Skeletal muscle is one of the most abundant and heterogeneous tissue comprises approximately 40% of total human body weight (Rolfe and Brown et al., 1997). It is composed of various types of myofibers expressing structural and contractile protein, myosin heavy chain (MyHC). MyHC generates the force for cellular movements ranging from cytokinesis to muscle contraction (Cheney et al., 1993).
To date, up to 11 myosin heavy chain (MyHC) genes have been identifiedto be expressed in muscle fibers in mammals (Schiaffino Sand Reggiani et al., 2011). Four of these MyHCs express in adult mammalian skeletal muscle in majority: MYH1 2x), MYH2 2a), MYH4 2b), and MYH7 (MyHC-β/I). MyHC-β is expressed in both cardiac and skeletal muscle and the other three MyHC-2a, MyHC-2d/x and MyHC-2b are known as skeletal-specific isoforms (Weiss A et al. 1999a; Weiss A, Schiaffino S and Leinwand LA, et al., 1999b). In addition to that, individual muscle fibers can be classified by its MyHC isoform expression such as type-I (MyHC-I/β; slow oxidative), type-IIA (MyHC-2a; fast oxidative), type-IIB (MyHC-2b; fast glycolytic) and type-IIX/D (MyHC-2x/d; intermediate) (Pette D and Staron RS et al., 2000). The expression of MyHC isoforms in different muscle fibers shows different physiological, functional or enzymatic characteristics. Studies of underlying mechanism including transcription and translation regulation are important not only for normal physiological process but also disease association characterization. Indeed, recently it has been established that the heterogeneity of these MyHCs are controlled by several intrinsic factors such age, sex, and the location of their expression. For example, MyHC-2b is highly expressed at both the messenger RNA (mRNA) and protein level in murine skeletal muscle (smaller mammals). On the contrary, human skeletal muscle does not express MyHC-2b protein due to a reduction in the activity of the human MyHC-2b promoter region (Harrison BCet al., 2011). Several studies
2
report that, this isoform is effectively only expressed at the mRNA level in a very small subset of specialized muscles in the adult human (Pereira Sant et al., 1997; Wu YZ et al., 2000 and Horton MJ et al., 2001). However, Smerdu V and colleagues first demonstrate not only the expression of MyHC-2b transcripts but also its corresponding protein, i.e. the MyHC-2b isoform, in some human laryngeal muscles (Smerdu V et al., 2013). In murine muscle, the overall abundance of MyHC expression is 2b > 2x > 2a > I/β while in human skeletal muscles, it is I/β > 2a > 2x, even though there are some regional and muscle specific variation persist in MyHC isoform expression (Haizlip KMet al., 2015).
Although there are many other factors to be considered for better health, the maintenance of muscle mass and strength during elderly is critically important (Francesco Landi et al., 2017). There are evidences as both male and female experience strength loss with ageing at differing rates (Bouchard DRet.al, 2011; Brady AOet. al., 2014; Gómez-Cabello A et. al., 2014 and Phillips SK et. al., 1993). Indeed, female are vulnerable to strength loss than male of similar age as they experience menopause (Phillips SK et. al., 1993), where female sex hormone estradiol is depleted markedly. Past studies showed that, hormone replacement therapy (HRT) improves muscle strength of postmenopausal women (Phillips SK et. al., 1993; Skelton DAet. al., 1993 and Qaisar Ret. al., 2013). However, muscle loss occurs mainly in fast-twitch (type II) myosin heavy chain (MyHC) fibers in fact, type II fiber isoforms are susceptible to decline in function along the aging process (Larsson L et. al., 1978; Short KRet. al., 1985; Lexell Jet. al., 1995, Trappe S et.al., 2003; Thompson LV et. al., 2006 and Russ DW et. al., 2011). It has been reported that, the proportion of fast-twitch MyHC fibers (type II isoform rich muscle) are positively associated with muscle strength (Short KRet. al., 2005 and and Aagaard P et. al., 1998). MyHC-2a isoform has been found as associated with muscle strength in both men and women, but no significant correlation has been found for
3
MyHC-2x isoform (Short KR et. al., 2005). Therefore, it is important and significant as well to uncover gender specific type II MyHC isoforms expression along with ageing.
TIS21/BTG2/PC3 (12-O-tetradecanoyl phorbol-13-acetate-inducible sequence 21/B-cell translocation gene 2/pheochromocytoma 3) belongs to antiproliferative genes family (APRO) and are orthologs isolated from mouse (B.S. Fletcher et al., 1991), human (Rouault JP et al., 1996) and rat (A Bradbury et al., 1991) respectively. There are many reports indicating BTG2 has a variety of biological functions. These include: cell cycle arrest at G2/M (Ryu MS et al., 2004) and G1/S phases (Guardavaccaro D et al. 2004; Lim IK et al., 1998), enhancement of doxorubicin-induced cancer cell death via disturbing ROS balance (Lim YBet al., 2008), antitumor activity in human bladder and breast cancers through inhibitions of muscle invasion (Devanand P et al.,2014) and invadopodia formation (J.A. Choi et al., 2016). BTG2 has also been shown to suppress the deadenylase activity of CAF1 in vitro (Yang X et al., 2008) and formation of vertebral patterning (Park et al. 2004), embryo development (Sakaguchi Tet al., 2001; Sugimoto K et al.,2005), differentiation of neural precursors (Micheli L et al., 2015) and DNA repair (Tirone F et al., 2001; Choi KS et al., 2012). In addition to that, a recent study reports that
Btg2 negatively regulates cardiomyocyte hypertrophy through a decrease in
cytosolic RNA (Yuki Masumura et al., 2016).
However, it is unknown whether TIS21/BTG2/PC3 has any role in age-associated changes in skeletal muscle mass, muscle quality or muscle function. In the present study, we examined age and sex-associated alteration in MyHC expression in gastrocnemius (predominant in type II fibers) skeletal muscle. To test our hypothesis, we performed a comparative study on body weight, muscle (GA) weight and its ratio, relative mRNA and protein expression of MyHC isoforms
4
between young, mid-old and old TIS21WT and TIS21KO mice on gender basis. Finally, by overexpressing TIS21 in C2C12 cells we performed promoter analysis of MyHCs through luciferase assay. Data from our study may allow an understanding that TIS21 gene may regulate myosin heavy chain isoforms (fast-twitch; type II) expression in female rather than male and which may subsequently contribute in the development of interventions to reduce physical disability.
5
II. MATERIALS & METHODS
2.1. Ethical statement
All animals, used in this study, were maintained according to Ajou University Animal Care Center under constant temperature and humidity with light/dark cycle 12/12 h, starting at 7 o’clock in the morning. All animal procedures were performed according to the Ajou University Institutional Review Board.
2.2. Animals and tissue sample collection
TIS21 WT and TIS21 KO mice, generated previously in the C57BL/6 background (Park, Lee et al., 2004),were used in this study. 12 wk to 24 months old male and female mice were obtained from our animal house maintained at Ajou University Animal Care Center. Mice were euthanized via cervical dislocation. Skeletal muscles including gastrocnemius (GA), soleus (sol), extensor digitorum longus (EDL), tibialis anterior (TA) and other organs such as liver, heart and adipose tissues were rapidly dissected, trimmed of visible fat and connective tissues, measured the weight and immediately frozen in liquid nitrogen. Than tissues were stored in -80°C until analysis.
2.3. Cell culture
Mouse C2C12 myoblasts were cultured in Dulbecco's modified Eagle's medium, high glucose (DMEM-H) (Gibco, Grand Island, NY, USA) supplemented with 10% heat-inactivated fetal bovine serum (FBS) (Gibco, Grand Island, NY, USA) and 1% penicillin and streptomycin in a 37° C incubator under 5% CO2 in air. Cells were split every 2-3 days at 60% confluency to avoid partial differentiation upon cell-cell contact.
6
2.4. Genomic DNA isolation and genotyping of TIS21 WT & TIS21 KO mice
Genomic DNA was extracted from the liver for genotyping of mice. Briefly, a small portion of frozen mice liver was taken into an eppendorf containing 445 μl of STE buffer, 2 μl of proteinase K (20 ug / ul) and 20 μl of 10% SDS. Then it was incubated in water bath with a temperature of 55°C for 5 h. After incubation in water bath, 1 μl RNase (10 μg / μl) was added into it and incubated for 1 h at 37° C in a heat block. Extraction of DNA was performed by adding equal volume of phenol/chloroform/IAA mixture which formed a white precipitation and then centrifuged at 12,000 rpm for 10 min. Supernatant was collected in another eppendorf and 2 volume of 100% ethanol and 1/10 volume of 3 M sodium acetate buffer (pH 5.2) were added into it and mixed gently for precipitation of gDNA thread. Next, the genomic thread was collected to another eppendorf containing 70% ethanol for washing and centrifuged at 12,000 rpm for 10 min. Supernatant was removed and gDNA pellet was air dried. Finally TE buffer was added to dissolve the gDNA pellet. After fully dissolving, the quantity and quality of gDNA were measured using spectrophotometry (EONTM Microplate Spectrophotometer, BioTek, USA) at A260, and A280 where A260/A280 ratio showed purity and the integrity was examined by 0.8% gel electrophoresis.
For genotyping, PCR analysis was performed in a 20 μl of total reaction volume. The master mix was prepared using HellxAmp Ready-2xGo (Taq-plus with dye) (Nanohelix, korea) and TIS21 WT or TIS21 mutant primers (Primer sequences are listed in Table1). The master mix was briefly vortexed and 18 μl of that was transferred to each 200 μl thin walled reaction tube kept on ice. Next, 2 μl of ~100 ng gDNA was added into reaction tube and PCR was performed using the following thermal conditions: initial cycle at 94° C for 10 min, followed by 30 cycles each of 94° C for 30 s, 58° C for 30 s and 72° C for 40 s. The final cycle was followed by incubation at 72° C for 10 min. All PCR products were run on 1.6% agarose gel with SafeView classic (abm, Korea) covered with 1 x TAE buffer at
7
100 volt for 60 min. 100 kb DNA step ladder was used in the agarose gel electrophoresis. Finally, the images were visualized by UV transillumination and stored for record.
2.5. Muscle homogenization for western blotting
Frozen muscles were grinded in mortar & pastel using liquid nitrogen. About 100 mg of muscle powder were homogenized using a Dounce homogenizer under cold conditions (4°C) in RIPA buffer (50 mM Tris HCl pH8, 150 mM NaCl, 1% NP-40, 0.5% sodium deoxycholate and 0.1% SDS). Protease and phosphatase inhibitors (1 mM PMSF, 1 μg / ml Leupeptin, 1 μg / ml pepstatin) were added to the buffer before homogenization. The homogenate was sonicated and centrifuged at 10,000 x g for 20 min at 4°C. The supernatant was collected in another EP tube and protein concentration was determined by Bradford dye, a protein assay kit (Bio-Rad, USA), using BSA as standard. The samples were adjusted to protein concentration of 2 μg / μl with 2x sample buffer (1.0% v/v ß-mercaptoethanol (ß-ME) or 100 mM DTT, 4.0% w/v SDS, 0.16 M Tris–HCl pH 6.8, 43% v/v glycerol, and 0.2% w/v bromophenol blue) and boiled for 3 min at 100° C. Proteins were stored at -80° C
for further analysis.
2.6. Western blotting analysis
10% SDS-PAGE was used to analyze MyHC protein expression. 40 μg of homogenized protein was loaded into each well and run at 60 volt. Resolved proteins were transferred on nitrocellulose membrane (GE Healthcare Life Sciences, Germany) at 200 mA. During transfer the temperature was maintained at 4°C. After transfer, membrane was stained with ponceau s solution (Sigma-Aldrich, St. Louis, MO, USA) to check for equal loading. Next, membrane was blocked for 1 h in 5% milk in TBST solution at room temperature with shaking. Primary antibody was applied at a dilution of 1: 10000 in 5% milk- TBST and incubated overnight at
8
4° C. The primary antibodies used were: MYH (H-300): Sc-20641(Santa Cruz Biotechnology, Inc); Monoclonal Anti-Myosin (Skeletal, Slow): M8421 (Sigma-Aldrich, St. Louis, MO, USA); Monoclonal Anti-Myosin (Skeletal, Fast): M4276 (Sigma-Aldrich, St. Louis, MO, USA); and α-Tubulin (DM1A): Sc-32293 (Santa Cruz Biotechnology, Inc; dilution 1:1000 in 5% milk-TBST). After overnight incubation in primary antibody, membrane was washed for 3 times in 10 minutes interval with 1x TBST solution. Membrane was incubated with horseradish peroxidase-conjugated secondary antibody (anti-mouse IgG or anti-rabbit IgG; Santa Cruz Biotechnology) at a dilution of 1: 2000 in 5% milk TBST for 1 h at room temperature with shaking. After secondary antibody incubation, membrane was washed again for 3 times in 10 minutes interval with 1x TBST. The blot was visualized with ECLTM (GE Healthcare UK Limited) using medical X-ray film blue (Agfa Healthcare NV, Belgium) and ChemiDoc Touch Imaging System (Bio-Rad). α-tubulin was used as protein loading control and blot images were quantified using ImageJ imaging software (National Institutes of Health, Bethesda, MD, USA).
2.7. RNA isolation and quality control
Total RNA from C2C12 cells and gastrocnemius skeletal muscle was isolated using RNAiso Plus solution (Cat. No. 9109, TaKaRa, Seoul Korea) according to the manufacturer’s instructions. Gastrocnemius muscle was homogenized using
RNAse-free bead beater system, FastPrep-24 5G Instrument (MP Biomedicals, Korea) for 40 s at 5 M/s. The Quality and quantity of RNA was estimated by
EONTMMicroplate Spectrophotometer (BioTek, USA) using A260:A280 ratio. The integrity of RNA was evaluated following bleach gel electrophoresis protocol described by Patrick S. Aranda et al. (Patrick S. Aranda et al., 2012), where 28S:18S ribosomal band (for eukaryotes) intensity was the indicator of the isolated RNA integrity.
9
2.8. cDNA synthesis and Quantitative Real-Time PCR analysis
1 μg of the purified RNA was subjected to reverse transcription for cDNA preparation using oligo-dT18 primer and reverse transcriptase (TaKaRa, Japan) in a
20 μl of total volume. The following thermal cycler condition was used for this reaction: 42° C for 60 min and 70° C for 15 min. The prepared cDNAs were diluted 10 fold with distilled water before PCR analysis. The cDNAs were amplified using specific primer sets (Sequences of primers are listed in Table 2) with 2x qPCR master mix including SYBR Green (Nanohelix, Korea) where L32 served as an internal control. CFX96 TouchTM Real-Time PCR Detection System (Bio-Rad) was used for qPCR reactions.
2.9. Luciferase reporter vector construct preparation
MyHC-I and MyHC-IIa promoters were cloned by PCR amplification method in our laboratory. Mouse genomic DNA was used as the template which was isolated from MEF cells. Than a forward and a reverse primer was used to perform PCR. The pGL3 basic vector was used as a backbone for all constructs. Plasmids contained MyHC-I sequences from -607 to +33 bp (MyHC-I-Luc), MyHC-IIa sequences from -670 to +7 bp (MyHC-IIa-Luc). PCR amplification was performed using pfu polymerase (Nanohelix, Korea) according to the protocol; Denaturation at 95° C for 30 s, annealing at 60° C for 30 s, and elongation at 72° C for 60 s. The amplified PCR products were digested with XhoI and HindIII, and then subcloned into pGL3 basic luciferase reporter vector purchased from Promega (Madison, WI) using the same sites. The recombinant DNA sequences were confirmed by nucleotide sequencing (Cosmo genetech, Korea). The primer sequences are as following:
10
I-P-F-XhoI GGC TCG AGG AAT TCC TGT GTC CAA ACT C I-P-R-HindIII CCA AGC TTG TAG CAA GTA AGG AAA CAG C IIa-P-F-XhoI GGC TCG AGA AAA TCA CCT TTT ACA ACT A IIa-P-R-HindIII CCA AGC TTG GCC AGT GTC CAG CTC CCA C
2.10. Transfection and Luciferase assay: Transient Transfection in C2C12 cells
C2C12 myoblast cells (at ~60% confluence) were transiently transfected with total 1 μg of pPGL3 basic-MyHC promotor- reporter plasmid and pCDNA3-TIS21-HA plasmid construct using Lipofectamine 2000 transfection reagent (Invitrogen, Grand Island, NY, USA) at a ratio of 1:2 (Lipofectamine:DNA) based on manufacturer’s instruction. Each 6 well was co-transfected with 20 ng of thymidine kinase Renilla-luciferase expression construct (Promega) as an internal control. After 6 h incubation, the transfection medium was removed and replaced with fresh complete medium and cultured for 12 h more. After 18 h of post transfection the cell monolayers were washed twice with ice cold 1x phosphate buffer (pH7.4) and harvested for luciferase assay
Luciferase assay
Luciferase activity was determined using a Dual-Luciferase Reporter Assay system according to the manufacturer's instructions (Cat. No. E1910, Promega). The supplied reagents were 5 x passive lysis buffer, luciferase assay reagent II (LAR II) (prepared by suspending lyophilized luciferase assay substrate in 10 ml of the luciferase assay buffer II and stored in -80° C in 1 ml aliquots in opaque tube until analysis) and 50 x Stop and Glo substrate (On the day of analysis 1 volume of 50 x Stop and Go substrate was added to 50 volume of Stop and Glo buffer for use). To measure promoter luciferase activity, transfected cells were lysed with 200 μl of 1 x Passive lysis buffer for 15 min on a rocker. After complete lysis, lysates were
11
cleared for 30 s centrifugation on high speed and protein concentration was measured. 10 μg of the cell lysate was placed in multi-well plate and volume was adjusted to 20 μl by 1 x passive lysis buffer. 100 μl LARII was added to cell lysate and was mixed twice by pipette. Than firefly luciferase luminescence was measured by luminometer (Synergy-2, BioTek, USA). Luciferase activity was quenched with the addition of 100 μl Stop and Glo reagent and placed back in the luminometer to measure Renilla luciferase activity. Background level was also determined using non transfected cell lysate in the same way. All data were recorded. Background data was subtracted from the experimental data. The ratio of firefly luciferase and Renilla luciferase activity was expressed as relative luciferase units (RLU) reflecting the promotor activity.
2.11. Statistical analysis
Data are presented as mean ± SD. Statistical comparisons between 2 groups were performed by independent student's t-tests. Comparisons between more than 2 groups were performed with one-way ANOVA, followed by Tukey’s multiple-comparison test (vs. control). OriginPro 8 was used for statistical data presentation. Statistical significance was set at p<0.05. p values have been provided in figure legends.
12
Table 1. Primer sequences for PCR based mouse genotyping
Target Gene Primer Primer Sequences (5'→ 3') Amplicon size (bp) TIS21 WT TISF2 GTAGGGCTGCCATGAAGAGTC 489 TISR2 GTTGTAGGCCACAGCTCTCAG TIS21 Mutant TISEx2r TGGAACTGGCTGCAGAGTGTGCAG 564 NeoP3 CGGTGCTGTCCATCTGCACGAGAC
13
Table 2. Primer sequences used in Real-Time PCR
Target
Gene Primer Primer Sequence (5'→ 3')
Amplico n size (bp) Myh7 (Type I) Forward ACAAGCTGCAGCTGAAGGTG 196 Reverse TCATTCAGGCCCTTGGCAC Myh2 (Type IIa) Forward CCAGCTGCACCTTCTCGTTTGCCA 289 Reverse CATGGGGAAGATCTGGTCTTCTT Myh1 (Type IIx) Forward TGCAACAGTTCTTCAACCAC 100 Reverse GCCAGGTCCATCCCAAAGT Myh4 (Type IIb) Forward CCTGGAACAGACAGAGAGGAGCAGGAGAG 480 Reverse GTGAGTTCCTTCACTCTGCGCTCGTGC TIS21 Forward ATGAGCCACGGGAAGAGAAC 142 Reverse CGGTCAGTGCGTCCTGGAGC L32 Forward GGCCTCTGGTGAAGCCCAAGATCG 106 Reverse CCTCTGGGTTTCCGCCAGTTTCGC
14
III. RESULTS
3.1. Genotyping of TIS21 Wild type (TIS21 WT) and TIS21 Knockout (TIS21 KO) mice
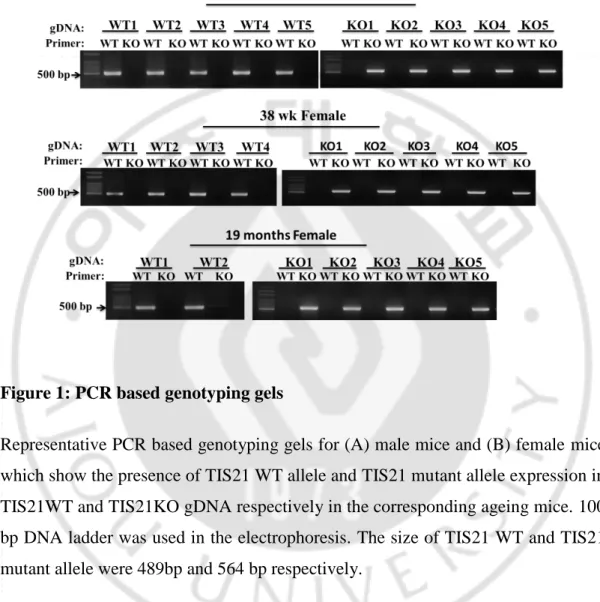
TIS21 WT and TIS21 KO mice model, generated previously in the C57BL/6J strain (Park, Lee et al., 2004), were used in this study. We started our study upon confirmation of the genotype of selected mice and those were used for further experiments. To determine the genotype, we extracted genomic DNA from liver tissue of TIS2 WT and TIS21 KO male and female mice as per our laboratory protocol. Then, we analyzed the TIS21 WT allele and mutant allele sequence by PCR. We observed that, TIS21 WT allele expression was present only in TIS21 WT mice rather than TIS21 KO, while TIS21 mutant allele expression was found only in TIS21 KO mice (Figure 1A & 1B). These results confirmed the accuracy of genotyping of our experimental mice.
16
Figure 1: PCR based genotyping gels
Representative PCR based genotyping gels for (A) male mice and (B) female mice which show the presence of TIS21 WT allele and TIS21 mutant allele expression in TIS21WT and TIS21KO gDNA respectively in the corresponding ageing mice. 100 bp DNA ladder was used in the electrophoresis. The size of TIS21 WT and TIS21 mutant allele were 489bp and 564 bp respectively.
17
3.2. Changes in body weight, GA muscle mass and GA muscle mass vs body weight ratio in TIS21 WT and TIS21 KO male and female mice
To determine the changes between TIS21WT and TIS21KO gastrocnemius (GA) muscle based on gender and ageing first of all we observed the morphological appearance. We found there was no difference in morphological appearance with respect of gender and ageing (Figure 2A). When we measured specific changes in body weight and gastrocnemius (GA) wet weight at different age of male and female mice, the young (12 wk) and mid-old (38 wk) TIS21-knock out (KO) male mice showed significantly higher body weight as well as GA muscle weight as compared to the TIS21-wild type (WT) (Figure 2B & 2C), while in old (24 months) male mice there was no change upon ageing (Figure 2B & 2C) (Table 3). In contrast, young (12 wk) and mid-old (38 wk) WT and KO female mice did not show any significant difference in their body and GA muscle weight, whereas old (19 months) TIS21 KO female showed a noticeable decrease (p=0.08) in GA muscle weight rather than body weight (p=0.14) compared to those of WT (Figure 2B & 2C), (Table 4). Likewise, we measured the gender-specific ratio of gastrocnemius wet weight versus body weight in those mice where the ratio was found significantly lower only in mid-old (38 wk) TIS21KO male mice (p˂0.001) (Figure 2D). All together it may suggest that, except young and mid-old male mice, there was no significant difference in body and muscle weight in TIS21 WT and TIS21KO old male and female mice along with ageing process.
18
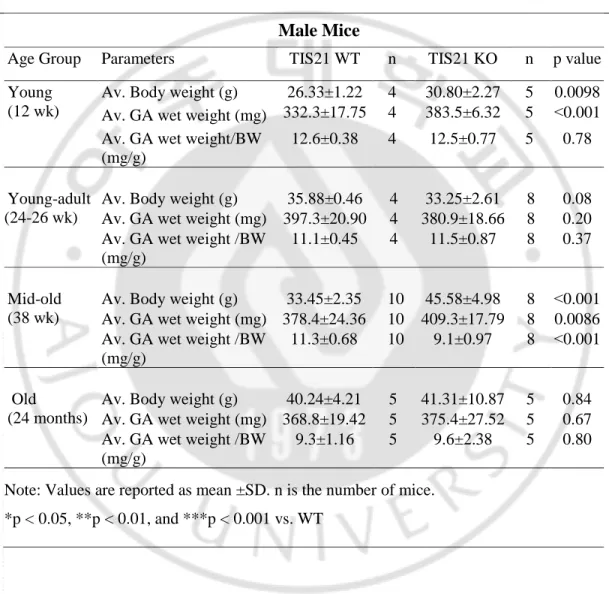
Table 3. Average body weight (BW) reported in gram (g), average GA wet
weights reported in milligram (mg), and average GA wet weight divided by average BW reported in mg / g for TIS21 WT and TIS21 KO male mice at different age group
Male Mice
Age Group Parameters TIS21 WT n TIS21 KO n p value
Young (12 wk)
Av. Body weight (g) 26.33±1.22 4 30.80±2.27 5 0.0098
Av. GA wet weight (mg) 332.3±17.75 4 383.5±6.32 5 ˂0.001
Av. GA wet weight/BW (mg/g)
12.6±0.38 4 12.5±0.77 5 0.78
Young-adult (24-26 wk)
Av. Body weight (g) 35.88±0.46 4 33.25±2.61 8 0.08
Av. GA wet weight (mg) 397.3±20.90 4 380.9±18.66 8 0.20
Av. GA wet weight /BW (mg/g)
11.1±0.45 4 11.5±0.87 8 0.37
Mid-old (38 wk)
Av. Body weight (g) 33.45±2.35 10 45.58±4.98 8 ˂0.001
Av. GA wet weight (mg) 378.4±24.36 10 409.3±17.79 8 0.0086
Av. GA wet weight /BW (mg/g)
11.3±0.68 10 9.1±0.97 8 ˂0.001
Old
(24 months)
Av. Body weight (g) 40.24±4.21 5 41.31±10.87 5 0.84
Av. GA wet weight (mg) 368.8±19.42 5 375.4±27.52 5 0.67
Av. GA wet weight /BW (mg/g)
9.3±1.16 5 9.6±2.38 5 0.80
Note: Values are reported as mean ±SD. n is the number of mice. *p < 0.05, **p < 0.01, and ***p < 0.001 vs. WT
19
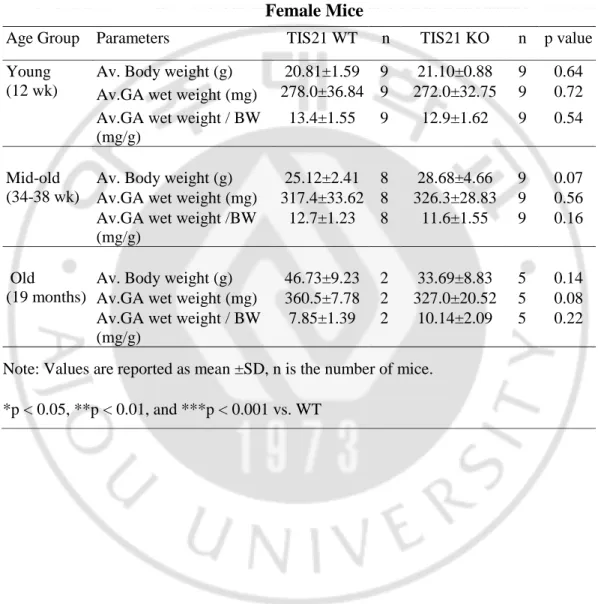
Table 4. Average body weight (BW) reported in gram (g), average GA wet weight
reported in milligram (mg), and average GA wet weight divided by average BW reported in mg / g for TIS21 WT and TIS21 KO female mice in different age group
Female Mice
Age Group Parameters TIS21 WT n TIS21 KO n p value
Young (12 wk)
Av. Body weight (g) 20.81±1.59 9 21.10±0.88 9 0.64
Av.GA wet weight (mg) 278.0±36.84 9 272.0±32.75 9 0.72
Av.GA wet weight / BW (mg/g)
13.4±1.55 9 12.9±1.62 9 0.54
Mid-old (34-38 wk)
Av. Body weight (g) 25.12±2.41 8 28.68±4.66 9 0.07
Av.GA wet weight (mg) 317.4±33.62 8 326.3±28.83 9 0.56
Av.GA wet weight /BW (mg/g)
12.7±1.23 8 11.6±1.55 9 0.16
Old
(19 months)
Av. Body weight (g) 46.73±9.23 2 33.69±8.83 5 0.14
Av.GA wet weight (mg) 360.5±7.78 2 327.0±20.52 5 0.08
Av.GA wet weight / BW (mg/g)
7.85±1.39 2 10.14±2.09 5 0.22
Note: Values are reported as mean ±SD, n is the number of mice. *p < 0.05, **p < 0.01, and ***p < 0.001 vs. WT
21
Figure 2: Comparative body weight, GA wet weight and ratio of GA wet weight vs BW in various age groups of TIS21WT and TIS21KO male and female mice
(A) Representative gender specific morphological images of gastrocnemius (GA) muscle (B) Average body weight (C) Average wet weight of gastrocnemius (GA) muscle and (D) Ratio of gastrocnemius and body weight of TIS21WT and TIS21KO male and female mice. Data are presented as mean±SD. Statistical comparisons were performed by independent student's t-tests. *p < 0.05, **p < 0.01, and ***p < 0.001 vs. WT
22
3.3. Effect of TIS21 in myosin heavy chain (MyHCs) protein expression in gastrocnemius skeletal muscle of male and female mice
Myosin heavy chain (MyHC) isoforms are the primarily regulator of the skeletal
muscle function (J.M. Potau et al., 2012) therefore we checked protein expression
of MyHC isoforms in our target samples by immunoblot analysis. We found, there
was not any significant alterations in protein expression of MyHC isoforms in
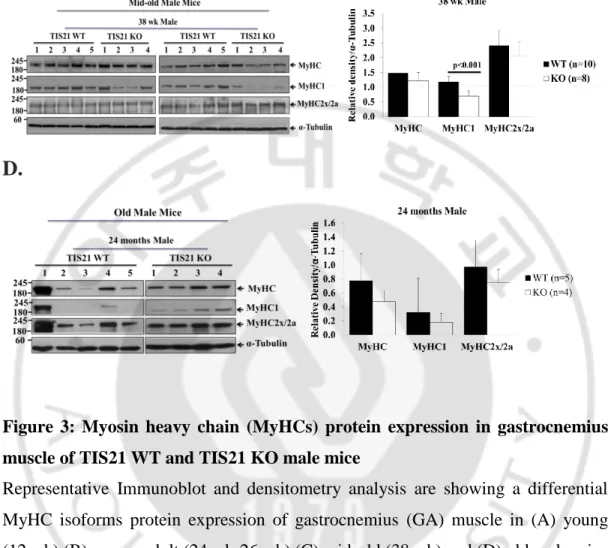
young (12 wk) and young-adult (24~26 wk) TIS21KO male compared to the WT (Figure 3A & 3B). Young female (12 wk) mice also revealed the same results (Figure 4A). Furthermore, we observed a significant downregulation in MyHC1 (type1) (***p=0.001) expression in mid-old (38 wk) TIS21 KO male mice (Figure 3C). In contrast, mid old (34 wk-38 wk) TIS21 KO female mice showed a significant downregulation in MyHC (type II) (*p=0.016) and MyHC2x/2a (type IIX/IIA) (*p=0.044) protein expression than that of WT (Figure 4B) and interestingly the reduction was significant in the old female mice (19 months) revealing translational downregulation upon ageing (Figure 4C). However, the change was not significant in old (24 months) KO male mice (Figure 3D) compared to its WT suggesting that, KO of TIS21 gene reduce MyHC isoform protein expression level, mostly type II , from the mid old and the reduction continue to old age in female mice rather than male.
In addition to that, we checked age dependent MyHC expression in TIS21 WT and KO gastrocnemius of male and female. We noted that, there was not age dependent MyHC expression alteration in WT and KO male (Figure 3.3.S1B). In contrast to male, there was a substantial and significant age dependent upregulation of MyHC and MyHC1 in TIS21 WT female (Figure 3.3.S2A). However, a noticeable upregulation in MyHC2x/2a expression was also revealed between 12 wk vs 34 wk-38 wk (Figure 3.3.S2A). Furthermore, in TIS21KO female, there was age
23
dependent MyHCs downregulation where MyHC1 decrease was significant between 12 wk vs 34 wk-38 wk (p=0.014) (Figure 3.3.S2B). Taken together, these data suggest that TIS21 may play a significant role in differential regulation of MyHCs protein expression and contribute in muscle function as well upon gender and age dependent manner.
A.
24
C.
D.
Figure 3: Myosin heavy chain (MyHCs) protein expression in gastrocnemius muscle of TIS21 WT and TIS21 KO male mice
Representative Immunoblot and densitometry analysis are showing a differential MyHC isoforms protein expression of gastrocnemius (GA) muscle in (A) young (12 wk) (B) young-adult (24 wk-26 wk) (C) mid-old (38 wk) and (D) old male mice. α-tubulin was used as loading control. Densitometry analysis was performed using ImageJ imaging software (USA) software where proteins of interest were normalized with α-tubulin. Data are presented as mean ± SD. Statistical comparisons were performed by independent student's t-tests. *p < 0.05, **p < 0.01, and ***p < 0.001 compared with its control group.
25
A.
B.
C.
Figure 4: Myosin heavy chain (MyHCs) protein expression in gastrocnemius muscle of TIS21 WT and TIS21 KO female mice
26
Figure 4: Myosin heavy chain (MyHCs) protein expression in gastrocnemius muscle of TIS21 WT and TIS21 KO female mice
Representative immunoblot and densitometry analysis are showing a differential MyHC isoforms protein expression of gastrocnemius (GA) muscle in (A) young (12 wk) (B) mid-old (34 wk-38 wk) and (C) old (19 months) female mice. α-tubulin was used as loading control. Densitometry analysis was performed using ImageJ imaging software (USA) software where proteins of interest were normalized with α-tubulin. Data are presented as mean ± SD. Statistical comparisons were performed by independent student's t-tests. *p < 0.05, **p < 0.01, and ***p < 0.001 compared with its control group.
27
A.
B.
Figure 3.3.S1: Age dependent myosin heavy chain (MyHCs) protein expression in gastrocnemius muscle of male mice
28
Figure 3.3.S1: Age dependent myosin heavy chain (MyHCs) protein expression in gastrocnemius muscle of male mice
Representative Immunoblot and densitometry analysis are showing age dependent MyHC isoform protein expression in GA muscle of (A) TIS21WT and (B) TIS21 KO male mice. α-tubulin was used as loading control. Statistical comparisons were performed with one-way ANOVA, followed by Tukey’s multiple-comparison test (vs. control) between the age groups. *p < 0.05, **p < 0.01, and ***p < 0.001.
29
A.
B.
Figure 3.3.S2: Age dependent myosin heavy chain (MyHCs) protein expression in gastrocnemius muscle of female mice
30
Figure 3.3.S2: Age dependent myosin heavy chain (MyHCs) protein expression in gastrocnemius muscle of female mice
Representative Immunoblot and densitometry analysis are showing age dependent MyHC isoform protein expression of GA muscle in (A) TIS21 WT and (B) TIS21 KO female mice. α-tubulin was used as loading control. Statistical comparisons were performed with one-way ANOVA, followed by Tukey’s multiple-comparison test (vs. control) between the age groups.
31
3.4. Integrity checking of total RNA isolated from gastrocnemius muscle of TIS21 WT and TIS21 KO male and female mice
High quality and intactness of RNA are fundamental criteria for RNA experiment. To assess the integrity of RNA isolated from gastrocnemius muscle of TIS21 WT and TIS21 KO mice, we followed bleach gel electrophoresis method described by Patick S. and Aranda et al. (Patrick S. Aranda et al., 2012). As the measure of quality check, we examined ribosomal RNA (rRNA) band intensity in our target samples. We found the upper ribosomal band 28S (eukaryotic cells) was about twice in intensity compared to the lower 18S band (eukaryotic cells) and 5S
ribosomal RNA band run at bottom (low or absent) suggesting that degradation of RNA did not occur in our isolated total RNA samples. Moreover, there was not smearing below the two rRNA (28S and 18S) bands which indicate poor quality RNA. Thus our results support that we isolated intact total RNA from gastrocnemius muscle from respective mice tissues and those were appropriate for the next experiment.
33
Figure 5: Integrity checking of total RNA isolated from gastrocnemius muscle
Representative bleach agarose gels are showing integrity of total RNA isolated from gastrocnemius muscle of TIS21 WT and TIS21 KO (A) male mice and (B) female mice. 1% bleach (v/v) in 1% agarose (w/v) gel was used for this experiment.
34
3.5. Effect of TIS21 in mRNA expression of myosin heavy chain (MyHC) isoforms in gastrocnemius skeletal muscle of male and female mice
After analyzing MyHCs protein expression which showed a significant downregulation in old female but not in male upon ageing process, we asked how about the transcriptional expression of MyHC isoforms (MyHC1, MyHC2a, MyHC2b and MyHC2x) in GA muscle of respective age group of mice. To reveal that picture, we carried out quantitative real-time PCR. Interestingly, we found transcription of MyHC2a (fast twitch but oxidative muscle fiber isoform) and MyHC2b (fast twitch and glycolytic muscle fiber isoform) were significantly downregulated in the 19 months old KO-female mice compared to that in the WT (Figure 5B), indicating a transcriptional downregulation of MyHC2a (p˂0.001) and MyHC2b (p˂0.001) expression along the ageing process. However, transcription of MyHC1 (slow-twitch and oxidative) was rather increased in the 24 months old KO male mice compared to its WT (p˂0.001) (Figure 5A). The transcriptional downregulation of MyHC2a was also significant (p=0.008) in mid-old (38 wk) KO female mice rather than mid-old male mice (p=0.35) versus its WT (Figure 5A and 5B). On the other hand, TIS21 KO young female did not show significant difference in MyHC isoforms expression level (Figure 5B) whereas MyHC1 and MyHC2a expression significantly reduced (p˂0.001) in TIS21 KO young male, though in young adult (24 wk-26 wk) the expression of those isoforms were compensated (Figure 5B). These results suggest that TIS21 may transcriptionally regulate the MyHC isoforms (type II; fast twitch) expression in female mice but not in male mice upon aging process.
36
Figure 6: mRNA expression of MyHC isoforms in the gastrocnemius skeletal muscle
Quantitative real-time PCR was used for analyzing the mRNA expression of MyHC isoforms in gastrocnemius muscles of TIS21WT and TIS21 KO (A) male and (B) female mice. Graphs are showing the relative mRNA mean expression of the myosin heavy chain isoforms at different age group of male and female mice. L32 was used as housekeeping gene. Data are presented as mean ± SE. *p˂0.05,
37
3.6. Molecular function of TIS21 in the regulation of MyHCs expression
To explore the mechanism of TIS21 in the regulation of MyHCs, we conducted luciferase assay. First, we constructed luciferase reporter vector (pGL3 basic) using MyHC1 promote (-607 to +33 bp) and MyHC2a promoter (-670 to +7). In order to select the optimum time point of transfection for luciferase assay, MyHC1 promoter and pGL3 basic vector were co-transfected with Renilla vector (internal control) into C2C12 cells for 12 h, 18 h and 24 h. We found 18 h was optimum time point for efficient transfection than we fixed the cell transfection and harvest scheme. (Figure 7A). Further, we confirmed the overexpression of TIS21 at 18 h of post transfection by Real-Time PCR (Figure 7B). Finally, we co-transfected MyHC1 and MyHC2a promoter with Renilla vector and dose dependent TIS21-HA into C2C12 cells for 18 h and measured luciferase activity of the respective promoters. We found, TIS21 overexpression (0.5ug) noticeably increased promoter activity of MyHC2a (p=0.09) (Figure 7C), while it was statistically significant in the MyHC1 promoter activation (p=0.003) (Figure 7D). These results suggest the role of TIS21 gene in the regulation of MyHCs expression.
38
A.
39
C.
D.
Figure 7: Effect of TIS21 in the promoter activity of MyHCs in C2C12 cells
(A) Experimental scheme with optimum time point of transfection for MyHC promoter analysis. (B) TIIS21 overexpression after 18 h of transfection (C) MyHC2a promoter activity and (D) MyHC1 promoter activity with or without overexpression of TIS21 in C2C12 cell. Data are presented as mean ± SD.
40
IV. DISCUSSION
To date, TIS21 has been researched to determine its function in numerous physiological functions such as cell cycle regulation and cancer (Lim IK et al., 1998; Ryu MS et al., 2004; Choi KS et al., 2012; Choi JA et al. 2016; Sundaramoorthy S et al., 2018 and Devanand P et al., 2018). However, there is no study that demonstrates TIS21 may have a regulatory effect on muscle contractile protein, MyHCs, expression. Here, we reported the effect of TIS21 gene in the regulation of MyHCs (type II) in female mice along with the ageing.
Muscle strength and muscle mass are highly correlated with each other. However, according to Newman et al. and his colleague’s demonstration, muscle strength or muscle quality is more important factor rather than muscle mass in estimation of mortality risk (Newman et al., 2006). When we performed comparative study of body weight and GA muscle mass of TIS21 WT and TIS21 KO male and female mice we observed, TIS21 KO young and mid-old male mice had significant higher body weight and muscle wet weight while there was no substantial difference of those weight in old male compared to that of WT (Figure 2B, 2C). However, old KO female mice showed a noticeable decrease in GA wet weight rather than body weight than its WT upon ageing (Figure 2B, 2C, and 2D). Further, we become interested to check the qualitative changes which may persist in KO GA muscle and may be the causative factor in declining muscle function in aging.
Since myosin heavy chain (MyHC) isoforms are the primarily regulator of
the skeletal muscle function (J.M. Potau et al. 2012) we checked, the protein
expression of MyHC isoforms in our target samples. We found that, mid old (34 wk-38 wk) TIS21KO female mice showed a significant reduction in MyHC (type II)
41
and MyHC2x/2a (type II) protein expression than that of WT (Figure 4B) and the reduction was also significant in the old female mice (19 months) indicating KO of TIS21 attenuates MyHCs protein expression upon ageing (Figure 4C). However, there was no significant MyHCs expression alteration in old (24 months) KO male mice (Figure 3D) compared to its WT. Furthermore, we checked MyHCs expression of GA in age dependent manner. Interestingly, WT female mice showed a significant age dependent increase in MyHC (type II) and MyHC1 (type I) where MyHC2x/2a (type II) expression was noticeably increased between 12 wk vs 34 wk-38 wk (Figure 3.3.S2A). In contrast, WT male did not show age dependent MyHCs expression changes. Previous studies showed that, type II fibers (fast isoforms) are susceptible to decline in function along the aging process (Trappe S et.al., 2003; Thompson LV et. al., 2006 and Russ DW et. al., 2011). In this study, we found KO of TIS21 significantly reduces MyHCs (type II) expression in GA of female, not in male, upon ageing process. The reason could be explained, without considering other factors involved in the regulation of muscle protein expression,
that TIS21 may play an attempt to preserve the MyHCs protein expression in order to maintain functional requirements of muscle in female mice during ageing.
It is reported that MyHC isoforms (type II) expressions transcriptionally alter with ageing (Short KR et al., 2005). Our Real-time PCR analysis revealed that transcription of MyHC2a (fast-twitch and oxidative) and MyHC2b (fast-twitch and glycolytic) were significantly downregulated in the TIS21 KO old female mice compared to WT (Figure 5B), indicating a transcriptional downregulation of MyHC2a and MyHC2b expression along the ageing. However, transcription of MyHC1 (slow-twitch and oxidative) was rather increased in the 24 months old KO male mice compared to its WT (p˂0.001) (Figure 5A).
42
Finally, to investigate whether TIS21 regulate the transcription of MyHCs (type II) genes we thus performed promoter analysis by luciferase assay. TIS21 overexpression noticeably increased promoter activity of MyHC2a (Figure 7B), while it significantly increased MyHC1 promoter activation (Figure 7C) indicating the role of TIS21 gene in the regulation of MyHCs expression. However, additional experiments are required for strengthening our results.
In conclusion, we report that TIS21 plays a role in the regulation of MyHCs (type II fiber isoform) expression in aging female mice which may contribute in muscle function. In this context, female sex hormone is an important question need to be addressed. Therefore, further studies are required to investigate the estradiol effect on the TIS21-mediated MyHCs expression in cell culture system.
43
REFERENCES:
1. Aagaard P, Andersen JL. Correlation between contractile strength and myosin heavy chain isoform composition in human skeletal muscle. Med Sci Sports Exerc. 1998 Aug;30(8):1217-22.
2. Bouchard DR, Héroux M, Janssen I. Association between muscle mass, leg strength, and fat mass with physical function in older adults: influence of age and sex. J Aging Health. 2011 Mar;23(2):313-28. doi: 10.1177/0898264310388562. Epub 2010 Nov 16.
3. Brady AO, Straight CR, Evans EM. Body composition, muscle capacity, and physical function in older adults: an integrated conceptual model. J Aging Phys Act. 2014 Jul;22(3):441-52. doi: 10.1123/japa.2013-0009. Epub 2013 Aug 12.
4. Bradbury A, Possenti R, Shooter EM, Tirone F. Molecular cloning of PC3, a putatively secreted protein whose mRNA is induced by nerve growth factor and depolarization. Proc Natl Acad Sci U S A. 1991 Apr 15;88(8):3353-7.
5. Cheney RE, Riley MA, Mooseker MS. Phylogenetic analysis of the myosin superfamily. Cell Motil Cytoskeleton. 1993;24(4):215-23. PMID: 8477454 DOI: 10.1002/cm.970240402
6. Choi JA, Jung YS, Kim JY, Kim HM, Lim IK. Inhibition of breastcancer invasion by TIS21/BTG2/Pc3-Akt Sp1 Nox4 pathway targeting actinnucleators, mDia genes. Oncogene. 2016 Jan 7;35(1):83-93. doi: 10.1038/onc.2015.64. Epub 2015 Mar 23.
7. Choi KS, Kim JY, Lim SK, Choi YW, Kim YH, Kang SY, Park TJ, Lim IK. TIS21(/BTG2/PC3) accelerates the repair of DNA double strand breaks by enhancing Mre11 methylation and blocking damage signal transfer to the
44
Chk2(T68)-p53(S20) pathway. DNA Repair (Amst). 2012 Dec 1; 11(12):965-75. doi: 10.1016/j.dnarep.2012.09.009. Epub 2012 Oct 22. 8. Devanand P, Kim SI, Choi YW, Sheen SS, Yim H, Ryu MS, Kim SJ, Kim
WJ, Lim IK.Inhibition of bladder cancer invasion by Sp1-mediated BTG2 expression via inhibition of DNA methyltransferase 1. FEBS J. 2014 Dec;281(24):5581-601. doi: 10.1111/febs.13099. Epub 2014 Oct 30.
9. Fletcher BS, Lim RW, Varnum BC, Kujubu DA, Koski RA, Herschman HR. Structure and expression of TIS21, a primary response gene induced by growth factors and tumor promoters. J Biol Chem. 1991 Aug 5;266(22):14511-8.
10. Gómez-Cabello A, Carnicero JA, Alonso-Bouzón C, Tresguerres JÁ, Alfaro-Acha A, Ara I, Rodriguez-Mañas L, García-García FJ. Age and gender, two key factors in the associations between physical activity and strength during the ageing process. Maturitas. 2014 Jun;78(2):106-12. doi: 10.1016/j.maturitas.2014.03.007. Epub 2014 Mar 25.
11. Guardavaccaro D, Corrente G, Covone F, Micheli L, D'Agnano I, Starace G, Caruso M, Tirone F. Arrest of G(1)-S progression by the p53-inducible gene PC3 is Rb dependent and relies on the inhibition of cyclin D1 transcription. Exp Cell Res. 2004 Sep 10;299(1):159-70.
12. Harrison BC, Allen DL, Leinwand LA. IIb or not IIb? Regulation of myosin heavy chain gene expression in mice and men. Skelet Muscle. 2011 Feb 1;1(1):5. doi: 10.1186/2044-5040-1-5.
13. Horton MJ, Brandon CA, Morris TJ, Braun TW, Yaw KM, Sciote JJ. Abundant expression of myosin heavy-chain IIB RNA in a subset of human massetermuscle fibres. Arch Oral Biol. 2001 Nov; 46(11):1039-50.
14. Haizlip KM, Harrison BC1, Leinwand LA2. Sex-based differences in skeletal muscle kinetics and fiber-type composition. Physiology (Bethesda). 2015 Jan; 30(1):30-9. doi: 10.1152/physiol.00024.2014.
45
15. J.M. Potau et al., Expression of Myosin Heavy Chain Isoforms in the Human Supraspinatus Muscle: Variations Related to Age and Sex, Cells Tissues Organs 2012;196:456–462 DOI: 10.1159/000336680.
16. Landi F, Calvani R, Cesari M, Tosato M, Martone AM, Ortolani E, et al. Sarcopenia: an overview on current definitions, diagnosis and treatment. Curr Protein Pept Sci (2017). doi:10.2174/1389203718666170607113459 17. Larsson L, Sjödin B, Karlsson J Histochemical and biochemical changes in
human skeletal muscle with age in sedentary males, age 22--65 years. Acta Physiol Scand. 1978 May;103(1):31-9.
18. Lexell J. Human aging, muscle mass, and fiber type composition. J Gerontol A Biol Sci Med Sci. 1995 Nov;50 Spec No:11-6
19. Lim IK, Lee MS, Ryu MS, Park TJ, Fujiki H, Eguchi H, Paik WK. Induction of growth inhibition of 293 cells by downregulation of the cyclin E and cyclin-dependent kinase 4 proteins due to overexpression of TIS21. Mol Carcinog. 1998 Sep;23(1):25-35.
20. Lim YB, Park TJ, Lim IK. B cell translocation gene 2 enhances susceptibility of HeLa cells to doxorubicin-induced oxidative damage. J Biol Chem. 2008 Nov 28;283(48):33110-8. doi: 10.1074/jbc.M804255200. Epub 2008 Oct 7.
21. Micheli L, Ceccarelli M, Farioli-Vecchioli S, Tirone F. Control of the Normal and Pathological Development of Neural Stem and Progenitor Cells by the PC3/Tis21/Btg2 and Btg1 Genes. J Cell Physiol. 2015 Dec; 230(12):2881-90. doi: 10.1002/jcp.25038.
22. Masumura Y, Higo S, Asano Y, Kato H, Yan Y, Ishino S, Tsukamoto O, Kioka H, Hayashi T, Shintani Y, Yamazaki S, Minamino T, Kitakaze M, Komuro I, Takashima S, Sakata Y. Btg2 is a Negative Regulator of Cardiomyocyte Hypertrophy through a Decrease in Cytosolic RNA. Sci Rep. 2016 Jun 27;6:28592. doi: 10.1038/srep28592.
46
23. Newman AB, Kupelian V, Visser M, Simonsick EM, Goodpaster BH, Kritchevsky SB, Tylavsky FA, Rubin SM, Harris TB. Strength, but not muscle mass, is associated with mortality in the health, aging and body composition study cohort. J Gerontol A Biol Sci Med Sci. 2006 Jan;61(1):72-7.
24. Pette D, Staron RS Myosin isoforms, muscle fiber types, and transitions. Microsc Res Tech. 2000 Sep 15;50(6):500-9. PMID:10998639 DOI: 10.1002/1097-0029(20000915)50:6<500::AID-JEMT7>3.0.CO;2-7
25. Pereira Sant'Ana JA, Ennion S, Sargeant AJ, Moorman AF, Goldspink G. Comparison ofthe molecular, antigenic and ATPase determinants of fast myosin heavychains in rat and human: a single-fibre study. Pflugers Arch. 1997 Dec;435(1):151 63
26. Phillips SK, Rook KM, Siddle NC, Bruce SA, Woledge RC. Muscle weakness in women occurs at an earlier age than in men, but strength is preserved by hormone replacement therapy. Clin Sci (Lond). 1993 Jan;84(1):95-8.
27. Qaisar R, Renaud G, Hedstrom Y, Pöllänen E, Ronkainen P, Kaprio J, Alen M, Sipilä S, Artemenko K, Bergquist J, Kovanen V, Larsson L. Hormone replacement therapy improves contractile function and myonuclear organization of single muscle fibres from postmenopausal monozygotic female twin pairs. J Physiol. 2013 May 1;591(9):2333-44. doi: 10.1113/jphysiol.2012.250092. Epub 2013 Mar 4.
28. Rolfe DF, Brown GC. Cellular energy utilization and molecular origin of standard metabolic rate in mammals. Physiol Rev. 1997 Jul;77(3):731-58. 29. Russ DW, Grandy JS, Toma K, Ward CW. Ageing, but not yet senescent,
rats exhibit reduced muscle quality and sarcoplasmic reticulumfunction. Acta Physiol (Oxf). 2011 Mar; 201(3):391-403. doi: 10.1111/j.1748-1716.2010.02191.x. Epub 2010 Nov 9.
47
30. Rouault JP, Falette N, Guéhenneux F, Guillot C, Rimokh R, Wang Q, Berthet C, Moyret-Lalle C, Savatier P, Pain B, Shaw P, Berger R, Samarut J, Magaud JP, Ozturk M, Samarut C, Puisieux A.Identification of BTG2, an antiproliferative p53 dependent component of the DNA damage cellularresponse pathway. Nat Genet. 1996 Dec;14(4):482-6.
31. Ryu MS, Lee MS, Hong JW, Hahn TR, Moon E, Lim IK. TIS21/BTG2/PC3 is expressed through PKC-delta pathway and inhibits binding of cyclin B1-Cdc2 and its activity, independent of p53 expression. Experimental Cell Research [01 Sep 2004, 299(1):159-170]
32. Schiaffino S and Reggiani C. Fiber types in mammalian skeletal muscles. Physiol Rev. 2011 Oct; 91(4):1447-531. doi: 10.1152/physrev.00031.2010 33. Smerdu V, Cvetko E. Myosin heavy chain2b transcripts and isoform are
expressed in human laryngealmuscles. Cells Tissues Organs. 2013; 198(1):75-86. doi: 10.1159/000351293. Epub 2013 Jun18.
34. Skelton DA, Phillips SK, Bruce SA, Naylor CH, Woledge RC. Hormone replacement therapy increases isometric muscle strength of adductor pollicis in post-menopausal women. Clin Sci (Lond). 1999 Apr;96(4):357-64.
35. Short KR, Vittone JL, Bigelow ML, Proctor DN, Coenen-Schimke JM, Rys P, Nair KS. Changes in myosin heavy chain mRNA and protein expression in human skeletal muscle with age and endurance exercise training. J Appl Physiol (1985). 2005 Jul;99(1):95-102. Epub 2005 Mar 3.
36. Sean Park, Young Jae Lee, Ho-Jae Lee, Tsugio Seki, Kwon-Ho Hong, Joonil Park, Hideyuki Beppu, In Kyung Lim, Ji-Won Yoon, En Li, Seong-Jin Kim, S. Paul Oh et al., B-Cell Translocation Gene 2 (Btg2) Regulates Vertebral Patterning by Modulating Bone Morphogenetic Protein/Smad Signaling , Molecular and Cellular Biology, 2004, DOI: 10.1128/MCB.24.23.10256-10262.2004).
48
37. Sakaguchi T, Kuroiwa A, Takeda H. Expression of zebrafish btg-b, an anti-proliferative cofactor, during early embryogenesis. Mech Dev. 2001 Jun; 104(1-2):113-5.
38. Sugimoto K, Hayata T, Asashima M. XBtg2 is required for notochord differentiation during early Xenopus development. Dev Growth Differ. 2005 Sep; 47(7):435-43.
39. Sean Park, Young Jae Lee, Ho-Jae Lee, Tsugio Seki, Kwon-Ho Hong, Joonil Park, Hideyuki Beppu, In Kyung Lim, Ji-Won Yoon, En Li, Seong-Jin Kim, S. Paul Oh et al., B-Cell Translocation Gene 2 (Btg2) Regulates Vertebral Patterning by Modulating Bone Morphogenetic Protein/Smad Signaling , MOLECULAR AND CELLULAR BIOLOGY, 2004, DOI: 10.1128/MCB.24.23.10256-10262.2004) Patrick S. Aranda, Dollie M. LaJoie, and Cheryl L. Jorcyk* Bleach Gel: A Simple Agarose Gel for Analyzing RNA Quality. Electrophoresis. 2012 January; 33(2): 366–369. doi:10.1002/elps.201100335.
40. Trappe S1, Gallagher P, Harber M, Carrithers J, Fluckey J, Trappe T. Single muscle fibre contractile properties in young and old men and women. J Physiol. 2003 Oct 1;552(Pt 1):47-58. Epub 2003 Jul 1
41. Thompson LV, Durand D, Fugere NA, Ferrington DA. Myosin and actin expression and oxidation in aging muscle. J Appl Physiol (1985). 2006 Dec; 101(6):1581-7. Epub 2006 Jul 13.
42. Tirone F. The gene PC3 (TIS21/BTG2), prototype member of the PC3/BTG/TOB family: regulator in control of cell growth, differentiation, and DNA repair? J Cell Physiol. 2001May;187(2):155-65.
43. Weiss A, McDonough D, Wertman B, Acakpo-Satchivi L, Montgomery K, Kucherlapati R, Leinwand L, Krauter K. Organization of human and mouse skeletal myosin heavy chain gene clusters is highly conserved. Proc Natl Acad Sci U S A. (1999a) Mar 16;96(6):2958-63.
49
44. Weiss A, Schiaffino S, Leinwand LA. Comparative sequence analysis of the complete human sarcomeric myosin heavy chain family: implications for functional diversity. J Mol Biol. (1999b) Jul 2;290 (1):61-75.
45. Wu YZ, Crumley RL, Armstrong WB, Caiozzo VJ. New perspectives about human laryngeal muscle: single-fiber analyses and interspecies comparisons. Arch Otolaryngol Head Neck Surg. 2000 Jul;126(7):857-64.
46. Yang X, Morita M, Wang H, Suzuki T, Yang W, Luo Y, Zhao C, Yu Y, Bartlam M, YamamotoT, RaoZ.Crystal structures of human BTG2 and mouse TIS21 involved in suppression of CAF1deadenylase activity. Nucleic Acids Res. 2008 Dec; 36(21):6872-81. doi: 10.1093/nar/gkn825. Epub 2008 Oct 30.
50
-국문요약-
C57BL/6J 생쥐에서 TIS21 에 의한 골격근 노화 암수 성별
차이와 myosin heavy chain 발현 조절
TIS21/BTG2/PC3은 antiproliferative gene 으로써 세포분열, 성장, 분화, 노화 및 세포사멸과 같은 여러 생물학적 현상에 중요한 역할을 담당한다. 그러나 TIS21 이 근육의 기능과 보존과 관련하여 어떤 역할을 하는지는 연구가 되어 있지 않았다. 이번 연구를 통해, TIS21 이 노화가 진행될 때 암수 생쥐에서 장딴지근(gastrocneimus, GA)에서의 근단백질 myosin heavy chain (MyHCs)의 발현을 어떻게 조절하는지 알아보았다.
먼저, 여러 다른 나이의 C57BL/6J 생쥐의 암수 모두에서 몸무게에 대비한 장딴지근의 무게의 차이를 확인하였다. 어린 12 주와 나이든 38 주된 수컷 TIS21-knock out (KO) 쥐의 몸무게와 GA 근육의 절대 무게는 TIS21-wild type (WT)에 비해 유의하게 무거웠다. 그러나 암놈에서는 근육의 무게, 몸무게, 그리고 그 비율이 TIS21WT 과 TIS21KO 을 비교했을 때 크게 차이 나지 않았다. 둘째로, 나이든 34-38 주 암컷 TIS21KO 쥐에서 MyHCs 단백질이 유의하게 WT 에 비해 감소되어 있음을 immuoblot 을 통해 알 수 있었고, 이런 감소는 아주 늙은 19 달 된 암컷에서도 유의하였다. 그러나 수컷 TIS21KO 쥐에서는 WT 과 비교하여 MyHCs 단백질이 노화가 진행해도 감소하지 않았다. 또한, qRT-PCR 기법으로 mRNA 발현을 측정했을 때도 아주 늙은 19 달 암컷 TIS21KO 은 MyHC2a 와 MyHC2b (type II fiber isoforms)의 발현이 WT 에 비해 감소되어 있었고, 반면 아주 늙은 24 달 수컷 TIS21KO 에서는 WT 에 비해 차이가 없었다.
마지막으로, 일시적인 형질전환으로 TIS21 을 과발현 시킨 C2C12 세포에서 luciferase assay 를 통해 TIS21 이 MyHCs 의 발현을 promoter 수준에서 조절할 수 있다는 결과를 얻었다.
51
결론으로, 위 결과들을 통해 TIS21 이 MyHCs 의 발현을 조절하며, 특히 암컷 쥐에서는 전사 단계에서 조절함을 밝혔다.