48-2 / V. Saveljev
• IMID 2009 DIGEST Abstract
The analytical expression for quality function is found including the dependence on disparity. The problem is considered in the projective coordinates for which the forward and backward transformation matrices are found. The formation of side observer regions is considered. The probability of the pseudo stereo effect is also estimated. Testing patterns are improved in order to provide higher accuracy of measurements. This is confirmed in experiments.
1. Introduction
The visual quality is important characteristic of a display device. Recently, various approaches to the quality of 3D displays have been developed [1 - 3] in particular the quality as absence of visual fatigue [4]. Improving quality [5] is a permanent problem to be solved. In the current paper we further develop the geometric approach [6, 7]. The display device supposed to confirm the point light source model [8] which is virtually suitable for various types of 3D display devices. We consider the geometry as one of the most important factors affecting the display characteristics. The problem is considered here in the projective representation form where the layout of regions is uniform.
The point light source model [8] implies that a 3D display consists of layers. One layer can be effectively represented as a plain matrix of light sources or their optical equivalents (e.g. lenses or pinholes). Another layer is an image screen.
In this model, the observer region is an area from where all light sources of their equivalents can be seen through the corresponding cells of the screen. The image region includes all possible locations of a visual image; it is a functional analog of the viewing frustum in 3D computer graphics. In this paper we consider a
flat “horizontal” cross-section of regions. In the regular coordinates, both regions have the shape of deltoids, in the projective the rhombs.
2. Results and discussion
• The model [8] implicitly requires the symmetric luminosity (radiance) of uniformly located light sources to exceed a certain angular limit. Since the axes of all sources are parallel, there is remaining emitted light directed aside from the single (central) observer region. It can form side regions.
All regions are located at the same distance from the light source array; they touch each other along a line parallel to the light source array. The shape of a side region is not a deltoid rather a general tetragon.
• By definition [6], the image quality is kept along nodal lines within a region. For the multiple observer regions, the quality is also kept along the nodal lines crossing regions.
The problem is considered in the projective coordinates for which the transformation matrices were found [7] ⎟ ⎟ ⎟ ⎟ ⎟ ⎠ ⎞ ⎜ ⎜ ⎜ ⎜ ⎜ ⎝ ⎛ − − = 1 1 0 0 0 0 0 1 f f g H , ⎟ ⎟ ⎟ ⎟ ⎟ ⎠ ⎞ ⎜ ⎜ ⎜ ⎜ ⎜ ⎝ ⎛ − − = − 1 1 0 0 0 0 0 1 1 g g f H (1)
The quality as a function of the distance Q(z) was found for a multi-view autostereoscopic device. This function implicitly depends on geometrical parameters like the observer distance and the width of the light source array a. Therefore instead of Q(z), a function of two variables Q(z,a) can be considered.
Geometry-based quality metric for multi-view
autostereoscopic 3D display
Vladimir Saveljev
1, Jung-Young Son
2and Kae-Dal Kwack
31
Research Institute of Electrical and Computer Engineering, Hanyang University, Seoul
133-791, Korea
TEL:82-2-2294-0618, e-mail: [email protected]
2
School of Computer and Communication Engineering, Daegu University, Gyongsan,
Gyeongbuk, 712-714, Korea
3
Division of Electronics and Computer Engineering, Hanyang University, Seoul, 133-791,
Korea
48-2 / V. Saveljev
IMID 2009 DIGEST • Also, one may consider an image occupying less
than the entire screen. For a 3D display device, we can interpret its width as a disparity D of the individual view images displayed in a screen. In this case the quality becomes the function of distance and disparity Q(z,D).
The basic expression for quality [7] is
j j Q + = 1 1 ) ( , j=−n,...,0,...,n (2) From here we can find
(
)
⎩ ⎨ ⎧ > < = = > > b b F F F z z d d z z F z F z F z Q(
)
min
(
),
(
)
(
(
),
),
2 1 2 1 0, 0 2 1 (3) where d c c db 1 + = , d c n z c n d c z z F + + ⎟ ⎠ ⎞ ⎜ ⎝ ⎛ ± + + = 1 1 1 1 1 ) ( 2 , 1 µ .Considering a as a disparity, the expression for quality metric (3) can be re-expressed as a function of two variables Q(z,D).
(
)
d b D D n z b D n d b D D z D z Q + + ⎟ ⎠ ⎞ ⎜ ⎝ ⎛ ± + + = µ 1 1 ) , ( (4)The functions (4) are shown in Fig. 1. Note that the functions begin at different z but at the same level
(
n+1)
−1.Fig. 1. Quality metrics n = 4 for different
disparities.
The distinctive locations at z-axis were found as 1/i -th of -the period in -the projective coordinates for any number of views and light sources. The corresponding graph of the quality function is shown in Fig. 2 for abscissas expressed in the relative coordinates zr
across the half-period of the projective form with using (1). The “near” part of the function (when i≤n or zr < 0.045) is in agreement with the previously
found function for the single region [7].
0 0.2 0.4 0.6 0.8 1 0 0.1 0.2 0.3 0.4 0.5 0.6
Fig. 2. Quality metric for n = 60 in relative regular
coordinates.
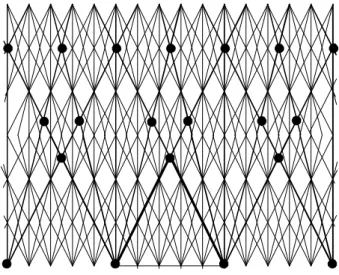
• The pseudo stereo effect [9] occurs when the rightmost view of a region meets the leftmost view of an adjacent region. Generally, this can happen along the rays originated at ends of a (Fig. 3). However the effect is stronger in points of intersection of these lines. Locations of the strong effect are marked by circles in Fig. 3 where the lines of weak effect are shown in bold.
Fig. 3. Pseudo stereo locations (projective)
z, cm
zr
Q
Q
48-2 / V. Saveljev
• IMID 2009 DIGEST
Two intersecting families of equidistant parallel lines (k and l lines respectively) form rhomboidal cells. There are kl nodes (intersection points) total and (k-1)(l-1) cells within the intersection area. For m intersecting families (if k = l) the total numbers of nodes and cells are
(
)
(
)
(
)( )
1 2 1 1 C 2 1 C 2 m 2 2 2 m 2 − − = − = − = = k m m k N k m m k N c n (5) where Cm2 is the number of combinations n choose 2.
For a 3D device, the total number of lines in a family is k = Mn + 1, where M is number of regions, n is number of views. Therefore
(
)(
)
(
)( )
2 2 2 1 1 2 1 Mn m m N Mn m m N cell node − = + − = (6) The number of lines involved into pseudo effect is M+1. Therefore the number of strong nodes is(
)( )
122 1 ' =
m
m
−M
+N
node (7)The probability can be estimated as a relative quantity of nodes 2 1 1 ' ⎟ ⎠ ⎞ ⎜ ⎝ ⎛ + + = = Mn M N N P node node strong (8)
which behaves as 1/n2 for M≫ 1.
Eq. (8) represents a node-based probabilistic metric of pseudo effect for a random location of an observer. The more regions (and the more views) are involved, the less is the probability for the observer to be located at a node of pseudo stereo effect.
Instead of nodes, lines can be considered, so as the line-based probability metric will be
1 1 ' + + = = Mn M N N P node node weak (9)
which is about 1/n for M≫ 1. Both (8), (9) mean that
for large M and n, the pseudoscopic effect has a very small probability and the randomly located observers would mostly avoid watching the pseudo stereo effect.
3. Experimental
For our experiments, special testing patterns were developed and then displayed in an autostereoscopic 3D display. The patterns were observed monoscopically.
The testing pattern is a stairwise vertical line (Fig. 4) which consists of n vertical segments displaced 1 pixel each (n is the number of views). The view images can be easily separated basing on their visible vertical section, so as a monoscopic observer can distinguish numbers of view images unambiguously.
Fig. 4. Testing pattern
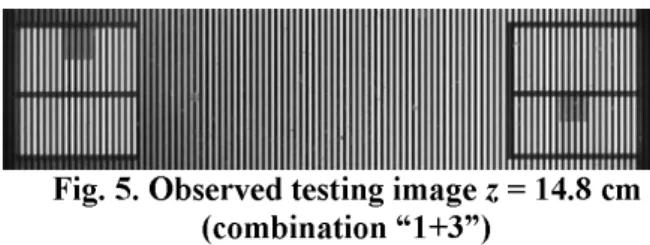
Displayed in our experiments were 2 patterns with different disparities. These patterns correspond to 2 light sources. A monoscopic observer is expected to see various combinations of 2 view images, Fig. 5.
Fig. 5. Observed testing image z = 14.8 cm
(combination “1+3”)
A camera (movable in a horizontal plane) was installed in front of the display device. The experiment included 2 stages to locate deltoids.
First. The nodal lines were found by moving the camera along the normal to the device screen (z-axis) while searching for certain combinations of view images to appear with a small displacement along x -axis (parallel to the screen). In the current experiment, the searchable combinations were: {1, 2, 3, 4}, {1+2, 2+3, 3+4, 4+1}, and {1+3, 2+4}.
Second. The camera is located at the nodal lines found at the first step. Then it was carefully moved along x-axis along wide x-range in order to find the clearest appearance for each combination.
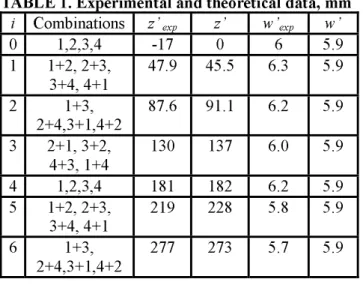
The experimental and theoretical data (projective) are given in Table 1. The root mean square (RMS)
48-2 / V. Saveljev
IMID 2009 DIGEST • difference between the experimental and theoretical
data in the projective space (supposing g = d in (1)) is about 0.03 cm for width and about 0.8 cm for distance. For the typical values of width and distance these correspond to 4-5%.
TABLE 1. Experimental and theoretical data, mm
i Combinations z’ exp z’ w’exp w’
0 1,2,3,4 -17 0 6 5.9 1 1+2, 2+3, 3+4, 4+1 47.9 45.5 6.3 5.9 2 1+3, 2+4,3+1,4+2 87.6 91.1 6.2 5.9 3 2+1, 3+2, 4+3, 1+4 130 137 6.0 5.9 4 1,2,3,4 181 182 6.2 5.9 5 1+2, 2+3, 3+4, 4+1 219 228 5.8 5.9 6 1+3, 2+4,3+1,4+2 277 273 5.7 5.9
4. Summary
The geometry-based quality metric can be calculated analytically, see Figs. 1, 2. It allows estimating the quality of a 3D device in advance. Also, two or more devices can be compared remotely. This allows estimating the behavior of the quality function in both projective and regular coordinates for larger number of views and light sources (image cells) as well as across the longer and wider area.
The disparity-based quality can give a natural limit for disparity as follows. A certain acceptable level of quality restricts the size of the area within which the quality is higher to this level (Fig. 1). The formula (4) informs us that the larger the disparity, the shorter the area. Therefore the images with smaller disparities can be observed from longer areas.
In regards of the pseudo stereo effect one can find that among 16 possible combinations, 10 are non-pseudo (the left number if lower than the right one), 4 are definitely pseudo (the left number is higher), and 2 are uncertain (their perception may depend on circumstances other than numbers). The maximal probability of pseudo effect in this case is between 4/16 and 6/16, i.e. as average 5/16 = 0.313 which is closer to the estimation (9) for lines (which gives 0.308 in this case) than (8) for nodes (0.095).
The experiments were performed across the region boundary. This differs from the previous experiment
[6] because now there is no extra visual displacement within the pattern. This improves the accuracy. As compared to the previous experiment, the distance range in the projective space is almost twice longer (7 values of i instead of 4), the displacement range is also wider (from 1 to 3 periods instead of 1). This confirms the same behavior of the combinations for multiple regions and between them.
The higher accuracy was obtained with using specially built improved testing patterns (RMS 5% instead of 11% previously). This allows creating objective tests for autostereoscopic 3D display devices.
5. References
1. Heynderickx, I., Kaptein, R., "Perception of detail in 3D images", Proc. SPIE, Vol. 7242, p. 72420W (2009).
2. Boher, P., Leroux, T., Bignon, T., Collomb-Patton, V., "A new way to characterize autostereoscopic 3D displays using Fourier optics instrument", Proc. SPIE, Vol. 7237, p. 72370Z (2009).
3. Kim, D., Min, D., Oh, J., Jeon, S., Sohn, K., "Depth map quality metric for three-dimensional video", Proc. SPIE Vol. 7237, p. 723719-1 (2009). 4. Lambooij, M., Fortuin, M., IJsselsteijn, W.A.,
Heynderickx, I., "Measuring visual discomfort associated with 3D displays", Proc. SPIE, Vol.
7237, p. 72370K (2009).
5. Shin, D.-H., Kim, N.-W., Yoo, H., Lee, J.-J., Lee, B., Kim, E.-S., “Improved viewing quality of 3-D images in computational integral imaging reconstruction based on round mapping model,” ETRI Journal, 29 [5], pp. 649-654 (2007).
6. Saveljev, V.V., Son, J.-Y., Kim, S.-H., Kim, D.-S., Park, M.-C., Song Y.-C., "Image mixing in multiview three-dimensional imaging systems", Journal of Display Technology, 4[3], pp. 319-323 (2008).
7. Saveljev, V., Son, J.-Y., Woo, S.-B., Park, M.-C., Lee, D.-S., Kwack, K.-D. , “Quality estimation for visual image in autostereoscopic 3D display”, Proc. SPIE, Vol. 7329, p. 73290O, (2009).
8. Kim, S.-S., Sohn, K.-H., Saveljev, V.V., Pen, E. F., Son, J.-Y., Chun, J.-H., "A full parallax three-dimensional imaging system based on a point light source array", Japanese Journal of Applied Physics,
40 [8], pp. 4913-4915 (2001).
9. Okoshi, T., Three Dimensional Imaging Techniques, Academic, (1976).