저작자표시-비영리-변경금지 2.0 대한민국 이용자는 아래의 조건을 따르는 경우에 한하여 자유롭게 l 이 저작물을 복제, 배포, 전송, 전시, 공연 및 방송할 수 있습니다. 다음과 같은 조건을 따라야 합니다: l 귀하는, 이 저작물의 재이용이나 배포의 경우, 이 저작물에 적용된 이용허락조건 을 명확하게 나타내어야 합니다. l 저작권자로부터 별도의 허가를 받으면 이러한 조건들은 적용되지 않습니다. 저작권법에 따른 이용자의 권리는 위의 내용에 의하여 영향을 받지 않습니다. 이것은 이용허락규약(Legal Code)을 이해하기 쉽게 요약한 것입니다. Disclaimer 저작자표시. 귀하는 원저작자를 표시하여야 합니다. 비영리. 귀하는 이 저작물을 영리 목적으로 이용할 수 없습니다. 변경금지. 귀하는 이 저작물을 개작, 변형 또는 가공할 수 없습니다.
A THESIS
FOR THE DEGREE OF DOCTOR OF PHILOSOPHY
Development of Nanostructured Electrode Materials
for Self-Charging Supercapacitor Power Cell
SURJIT SAHOO
DEPARTMENT OF MECHATRONICS ENGINEERING
GRADUATE SCHOOL
JEJU NATIONAL UNIVERSITY
Development of Nanostructured Electrode Materials for
Self-Charging Supercapacitor Power Cell
Surjit Sahoo
(Supervised by Professor Sang-Jae Kim)
A thesis submitted in partial fulfilment of the requirement for the degree of
Doctor of Philosophy
2019.12
The thesis has been examined and approved.
……….
Prof. Kwang-Man Lee Professor, Department of Electronic Engineering,
Thesis Director College of Engineering,
Jeju National University.
……….
Prof. Nam-Jin Kim Professor, Department of Nuclear & Energy Engineering,
Thesis Committee Member College of Engineering,
Jeju National University.
……….
Prof. Hyomin Lee Assistant Professor, Department of Chemical & Biological
Thesis Committee Member Engineering, College of Engineering,
Jeju National University.
……….
Prof. Woo Young Kim Assistant Professor, Department of Electronic Engineering,
Thesis Committee Member College of Engineering,
Jeju National University.
……….
Prof. Sang -Jae Kim Professor, Department of Mechatronics Engineering,
Thesis Committee Member College of Engineering,
and Supervisor Jeju National University.
December, 2019
DEPARTMENT OF MECHATRONICS ENGINEERING
GRADUATE SCHOOL
JEJU NATIONAL UNIVERSITY
REPUBLIC OF KOREA
Dedicated to my father, mother, my Family
members, all my teachers and friends
ACKNOWLEDGEMENT
Foremost, I would like to express my sincere cheers to the almighty for his support and making me stood in all challenging times and mastered me to tackle situations peacefully. My mother Mrs. Sukanti
Sahoo my first teacher and her irrepealable love, my father Mr. Surendra Nath Sahoo my first guide,
who made me to think and feel happy always. Appreciations to the kindhearted well-wishers, all my family members who made me to reach this extent in my life. My sincere thanks to my advisor Prof.
Sang-Jae Kim for his continuous support throughout my Ph.D. and motivation towards research. His
patience, motivation, and immense knowledge is unparalleled. His guidance helped me in every other means during time of research until the completion of thesis to mold myself in a better way.
I express my sincere and the most heartful gratitude to Dr. Karthikeyan Krishnamoorthy, who is not only a mentor in my professional life but also a well-wisher in my personal life. I would extend my deep appreciativeness to Dr. Parthiban Pazhamalai for mentoring and handling me as his brother. I also would like to thank all of my colleagues Dr. Nagamalleswara Rao Alluri, Dr. Arunkumar Chandrasekhar, Dr. Sophia Selvarajan, Dr. Yuvasree Purusothaman Mr. Vivekanathan Venkateswaran, Mrs. Kausalya Ganesan, Mr. Vimal kumar Mariappan, Ms. Sindhuja Manoharan, Mr. Rajagopal Pandey, Mr. Gaurav Khandelwal, Mr. Nirmal, Mr. Woo Joong Kim, Mr. Divakar, Mr. Abishek, Mr. Dhanasekar, Dr. Deepak, Dr. Natraj,Mr. Swapnil, Mr. Prashanth, Ms. Aparna, Mr .Arunprasath, Mr. Sugato, Ms. Manisha, who made my time in the lab as memorable.
I would also like to thank my friends outside the laboratory especially Dr.MSP Sudhakaran, Dr. Srikanth, Ms. Karthika Muthuramalingam, Mr. Gnanaselvan, Mr. Sravan Kumar, and Mr. Vikram for the beautiful reminiscences to cherish during my stay in Jeju.
I am grateful to the instrumentation facilities provided by Jeju National University to handle the sole operation of the instruments. I am thankful to Barain Korea 21 (BK-21) for funds provided for my research work.
I would like to extend my ovations to my friends who have been supported and making me feel good in my difficult times. Impeccable gratitude to all the well-wishers who lend their hands directly or indirectly during my entire stay in Jeju.
1
TABLE OF CONTENTS
Contents 1 Nomenclature 8 List of Tables 10 List of Figures 11 Abstract-Hangul 23 Abstract 31 CHAPTER 1 INTRODUCTION 34 1.1 Background 341.2 Significance of electrochemical energy storage devices 34
1.3 Classification of supercapacitors 36
1.3.1 Electrochemical double- layer capacitors (EDLC) 36
1.3.2 Pseudocapacitors 38
1.3.3 Hybrid supercapacitors 40
1.3.4 Electrode materials 41
1.3.4.1 Carbon based electrode materials 41
1.3.4.2 Metal oxides 42
1.3.4.3 Conducting polymers 42
1.3.4.4 Transition metal chalcogenides 43
1.4 Energy harvesting: Nanogenerators 43
1.4.1 Mechanism of piezoelectric nanogenerator 44
2
1.5 Objectives and scope of thesis 46
1.6 Structure of this thesis 47
1.7 References 48
CHAPTER 2 CHEMICALS, SYNTHESIS METHODS, PHYSICAL CHARACTERIZATION, ELECTRODE FABRICATION TECHNIQUES AND ELECTROCHEMICAL CHARACTERIZATION 2.1 Chemicals and equipment’s 53
2.2 Material preparation 55
2.2.1 Hydrothermal method 56
2.2.2 Sonochemical method 56
2.2.3 Film casting 57
2.2.4 Graphene oxide synthesis by modified Hummer’s method 57
2.3 Materials characterization 58
2.3.1 X-ray diffraction (XRD) 58
2.3.2 Field-emission scanning electron microscopy (FE-SEM) 58
2.3.3 Laser Raman spectroscopy 59
2.3.4 Fourier transform infrared (FT-IR) spectrometer 60
2.3.5 X-ray photoelectron spectroscopy (XPS) 61
3
2.3.7 UV-Vis spectrophotometer (UV-Vis) 62
2.4 Fabrication of electrode 62
2.5 Device fabrication 62
2.5.1 Coin-cell symmetric supercapacitor 63
2.6 Electrochemical characterization 63
2.6.1 Cyclic voltammetry (CV) 64
2.6.2 Galvanostatic charge/discharge (GCD) 64
2.6.3 Electrochemical impedance spectroscopy (EIS) 64
2.6.4 Calculation of electrochemical parameters 65
2.6.4.1 Determination of specific capacitance from CV analysis 65
2.6.4.2 Determination of specific capacitance from GCD analysis 65
2.6.4.3 Determination of Columbic efficiency (ƞ%), Energy and power density 66
2.6.4.4 Determination of specific capacitance from EIS analysis 66
2.6.4.5 Determination of real and imaginary components of capacitance from EIS analysis 66
2.7 References 67
CHAPTER-3
Hydrothermally prepared α-MnSe nanoparticles as a new pseudocapacitive electrode material for supercapacitor
4
3.1 Introduction 70
3.2 Experimental section 72
3.2.1 Materials 72
3.2.2 Preparation of manganese selenide (α-MnSe) nanoparticles 72
3.2.3 Instrumentation 72
3.2.4 Electrochemical analysis of α-MnSe nanoparticles 73
3.3 Results and discussions 74
3.4 Conclusions 83
3.5 References 84
CHAPTER-4 Copper molybdenum sulfide: a novel pseudocapacitive electrode material for electrochemical energy storage device 4.1 Introduction 91
4.2 Experimental section 93
4.2.1 Materials 93
4.2.2 Preparation of Cu2MoS4 nanostructures 93
4.2.3 Instrumentation 94
4.2.4 Electrochemical analysis 94
5
4.4 Conclusions 111
4.5 References 111
CHAPTER-5 Copper molybdenum sulfide: a novel pseudocapacitive electrode material for electrochemical energy storage device 5.1 Introduction 118
5.2 Experimental section 120
5.2.1 Materials 120
5.2.2 Synthesis of Cu2MoS4 nanostructures 120
5.2.3 Synthesis of Cu2MoS4-rGO hybrid 121
5.2.4 Instrumentation 121
5.2.5 Electrochemical analysis 121
5.3 Results and discussions 123
5.4 Conclusions 142
5.5 References 143
CHAPTER-6 Copper molybdenum sulfide anchored nickel foam: A high performance, binder-free, negative electrode for supercapacitor 6.1 Introduction 150
6
6.2.1 Materials 151
6.2.2 Hydrothermal growth of CMS anchored on Ni foam 152
6.2.3 Instrumentation 152
6.2.4 Electrochemical analysis 153
6.3 Results and discussions 154
6.4 Conclusions 169
6.5 References 169
CHAPTER-7 High performance self-charging supercapacitor using porous PVDF-ionic liquid electrolyte sandwiched between two-dimensional graphene electrodes 7.1 Introduction 175
7.2 Experimental section 177
7.2.1 Materials 177
7.2.2 Sonochemical reduction of graphene oxide into reduced graphene sheets 177
7.2.3 Fabrication and analysis of free-standing porous PVDF piezo-polymer separator 178
7.2.4 Instrumentation 179
7.2.5 Fabrication of self-charging supercapacitor power cell (SCSPC) 179
7.2.5.1 Preparation of graphene electrodes for SCSPC 179
7.2.5.2 Incorporation of TEABF4 electrolyte into porous PVDF matrix 180
7
7.2.5.4 Electrochemical analysis of graphene based SCSPC 180
7.3 Results and discussions 181
7.4 Conclusions 202
7.5 References 202
CHAPTER-8 Conclusions and Future work 8.1. Conclusions 209
8.2. Suggestions for the Future Work 210
APPENDIX A: List of Publications 212
APPENDIX B: Conference Presentations 216
8
Nomenclature
AC Activated Carbon BET Brunauer-Emmet-Teller CV Cyclic voltammetry CNT Carbon nanotube CT Conductive textile DI De-ionizedECD Electrochemical deposition
ECs Electrochemical capacitors
EDLC Electrochemical double layer capacitor
EDS Energy dispersive X-ray Spectroscopy
EIS Electrochemical Impedance spectroscopy
ESR Equivalent series resistance
FE- SEM Field-emission scanning electron microscopy
FT-IR Fourier transform infrared spectrometer
GCD Galvanostatic charge discharge
GO Graphene Oxide
9
HR-TEM High resolution transmission electron microscopy
RGO Reduced graphene oxide
SCs Supercapacitors
SS Stainless steel
TEM Transmission electron microscope
XRD X-ray diffraction
10
LIST OF TABLES
Table 2.1 Chemicals and solvents used in this thesis. 54 Table 2.2 Equipment’s used in the research project. 55 Table 3.1 Summary of electrochemical performances of the α-MnSe electrode and recently
reported electrode materials using three-electrode configurations. 82
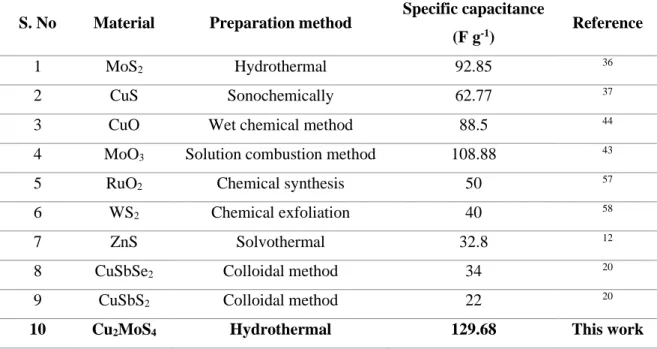
Table 4.1 Summary of electrochemical performance of Cu2MoS4 electrode and recently reported
electrode materials using three-electrode configurations. 110
Table 4.2 Summary of electrochemical performance of Cu2MoS4 SSC device and recently
reported SSC devices. 110
Table 5.1 The summary of electrochemical performances of Cu2MoS4 and Cu2MoS4-rGO
electrode and reported electrodes for supercapacitor application using three-electrode
configurations. 141
Table 5.2 The summary of EIS parameters of Cu2MoS4-rGO electrode at different operating
temperatures. 142
Table 6.1 Summary of electrochemical performances of binder-free CMS/Ni electrode and
recently reported binder-free electrode materials using three-electrode configurations. 168
Table 6.2 Summary of electrochemical performances of CMS/Ni SSC device and recently
reported binder-free SSC device. 168
Table 7.1. Summary of electrochemical performances of graphene SCSPC and recently reported
11
LIST OF FIGURES
Figure 1.2 Evaluation of energy storage devices by Ragone plot. 35
Figure 1.3 Categorization of SCs. 37
Figure 1.3.1 Representations of the EDLC at a positively charged surface: (a) Helmholtz model, (b) Gouy–Chapman (GC) model, and (c) Stern model, representing the (i) inner and (ii) outer Helmholtz planes. 38
Figure 1.3.2 Reversible redox mechanisms: (a) under-potential deposition (UD), (b) redox pseudo-capacitance, and (c) intercalation pseudo-capacitance. 39
Figure 1.4.1 Mechanism of the piezoelectric nanogenerator. 45
Figure 2.3.1 Image of X-Ray diffractometer for the powder analysis. 58
Figure 2.3.2 Image of FE-SEM instrument. 59
Figure 2.3.3 Image of Micro Raman Spectroscopy system. 60
Figure 2.3.4 Image of Fourier transform Spectrophotometer system. 60
Figure 2.3.5 Image of X-ray photoelectron spectrometer system. 61
Figure 2.6 Image of Electrochemical work station. 63
Figure 3.1 (a) X-ray diffraction pattern of α-MnSe and (b) laser Raman spectrum of α-MnSe. Field emission scanning electron micrographs of α-MnSe nanoparticles measured at different magnifications (c) 1 µm and (d) 100 nm. 76
Figure 3.2 (a) Cyclic voltammetric profile of α-MnSe electrode measured at low scan rate (1 mV s-1), (b) cyclic voltammetric profiles measured at different scan rates ranging from 5 to 100 mV s-1), (c) Nyquist plot and (d) Bode phase angle plot. This data was obtained using three-electrode configuration. 78
Figure 3.3 (a) Charge-discharge profile of α-MnSe electrode measured at different current
12 the cyclic stability test of α-MnSe electrodes over 2000 cycles and the inset shows the FESEM image of electrode before and after electrochemical performance, and (d) Ragone plot of α-MnSe electrodes (data obtained using half-cell configuration) and inset shows the Nyquist plot before and after cyclic stability. 80
Figure 3.4 Electrochemical performance of α-MnSe based symmetric supercapacitor device (a)
cyclic voltammetric profile measured at low scan rate (5 mV s-1), (b) cyclic voltammetric
profiles at different scan rates, (c) effect of scan rate on the specific capacitance of α-MnSe symmetric supercapacitor device, and (d) Nyquist plot of α-MnSe symmetric supercapacitor device. The inset shown in Figure 3.4 (d) represents the enlarged portion of the Nyquist plot of the α-MnSe device in the high-frequency region. 81
Figure 3.5 (a) Charge-discharge profile of α-MnSe symmetric supercapacitor device measured
at a constant current density of 0.5 mA cm-2, (b) charge-discharge profiles measured at different
current densities, (c) effect of current density on specific capacitance of α-MnSe symmetric supercapacitor device and (d) Ragone plot of α-MnSe symmetric supercapacitor device. 83
Figure 4.1 (A) X-ray diffraction pattern of Cu2MoS4 nanostructures and (B) laser Raman
spectrum of Cu2MoS4 nanostructures at different laser powers. Field emission scanning electron
micrographs of Cu2MoS4 nanostructures measured at different magnifications (C) 1 µm and (D)
500 nm. 96
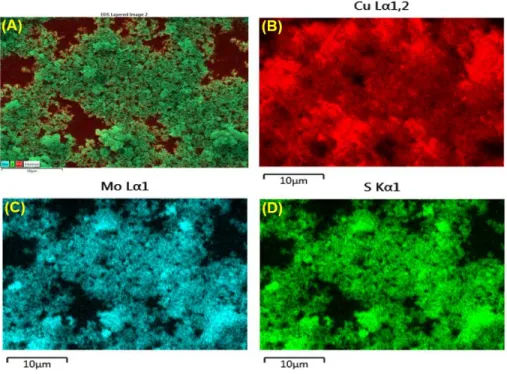
Figure 4.2 Elemental mapping of the Cu2MoS4 nanostructures: (A) FE-SEM micrographs for
elemental mapping and corresponding elemental mapping (B) Cu, (C) Mo and (D) S. 97
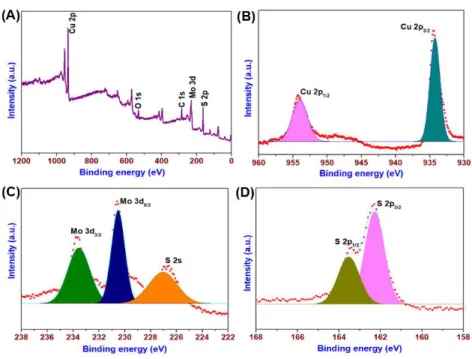
Figure 4.3 X-ray photoelectron spectrum of hydrothermally prepared Cu2MoS4 nanostructures
(A) Survey spectrum in the range of 0 to 1200 eV, (B) core level spectrum of Cu 2p element present in Cu2MoS4, (C) core level spectrum of Mo 3d element present in Cu2MoS4, and (D)
13
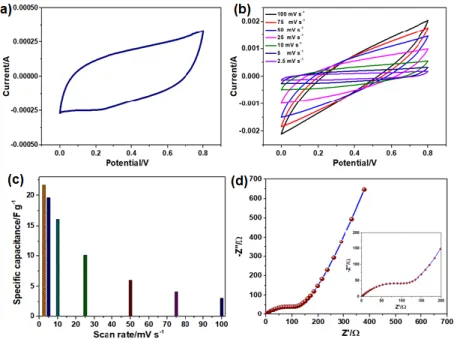
Figure 4.4 Electrochemical performance of Cu2MoS4 electrode in three electrode system. (A)
Cyclic voltammetric profile of Cu2MoS4 electrode measured at various scan rate (5 to 100 mV s -1), (B) effect of scan rate on the specific capacitance of Cu
2MoS4 electrode, (C) Galvanostatic
charge-discharge profile of Cu2MoS4 electrode measured at various current densities (1.5 – 5
mA cm-2) and (D) effect of current density on specific capacitance. 99
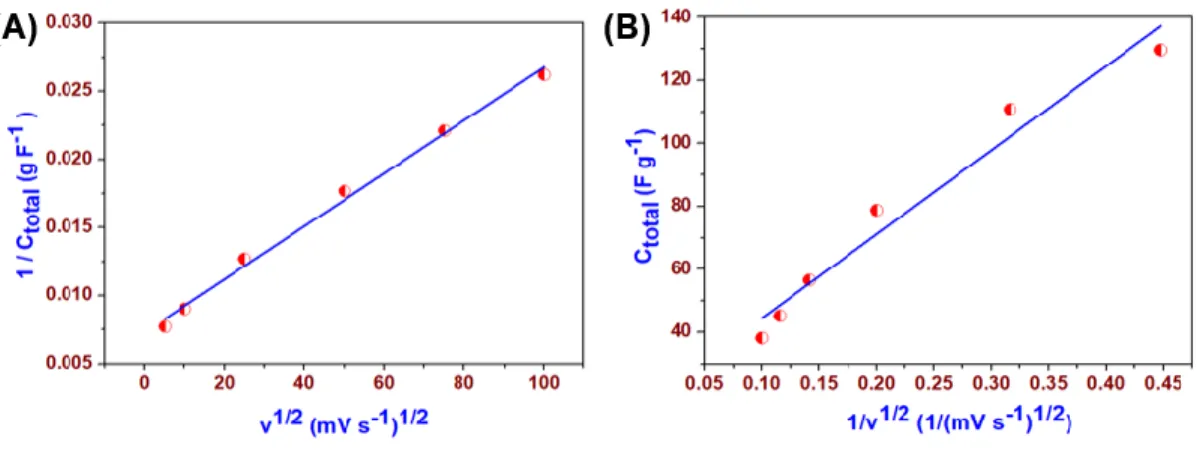
Figure 4.5 Trasatti plot for Cu2MoS4 electrode. (A) Dependence of 1 / Ctotal on v1/2 and (B)
dependence of Ctotal on v-1/2 for Cu2MoS4 electrode in Na2SO4 electrolyte. 100
Figure 4.6 The Nyquist plot for Cu2MoS4 electrode (the inset shows the enlarged portion of
Nyquist plot in the high-frequency region). 102
Figure 4.7 Electrochemical performance of Cu2MoS4 SSC device (A) cyclic voltammetric
profile at 5 mV s-1, (B) cyclic voltammetric profiles at different scan rates (5 – 100 mV s-1) , (C)
cyclic voltammetric profiles at different scan rates (150 – 500 mV s-1), and (D) effect of scan
rate on the specific capacitance of Cu2MoS4 SSC device. 103
Figure 4.8 (A) Charge-discharge profile of Cu2MoS4 SSC device measured at constant current
density of 0.5 mA cm-2, (B) charge-discharge profiles measured at different current densities
(0.25 – 2.5 mA cm-2) , (C) effect of current density on specific capacitance and (D) Ragone plot
of Cu2MoS4 SSC device. 105
Figure 4.9 EIS analysis of Cu2MoS4 SSC device (A) Nyquist plot (the inset shown in Fig. 4.9
(A) represents the enlarged portion of Nyquist plot in the high-frequency region), (B) Bode phase angle plot, (C) Normalized real component of capacitance as a function of frequency and (D) Normalized imaginary component of capacitance as a function of frequency. 106
Figure 4.10 (A) Nyquist plot at different applied potential, (B) Bode phase angle plot, (C)
variation of specific capacitance concerning frequency of Cu2MoS4 SSC device and (D) The
14
Figure 4.11 Nyquist plot of Cu2MoS4 SSC device before and after cyclic stability tests. 109
Figure 5.1 Schematic illustration of Cu2MoS4 nanoparticles embedded on graphene sheets by
one-pot hydrothermal method. 123
Figure 5.2 (A) X-ray diffraction pattern of as prepared Cu2MoS4 and Cu2MoS4-rGO hybrid and
(B) laser Raman spectrum of Cu2MoS4 and Cu2MoS4-rGO hybrid. High resolution X-ray
photoelectron spectrum (XPS) of as prepared Cu2MoS4-rGO hybrid (C) core level spectrum of
Cu 2p state, (D) core level spectrum of Mo 3d state, (E) core level spectrum of S 2p state, and (F) core level spectrum of C 1s state. 125
Figure 5.3 High resolution X-ray photoelectron spectrum (XPS) of as prepared Cu2MoS4-rGO
hybrid (A) Survey spectrum in the range of 0 to 1200 eV, and (B) core level spectrum of O 1s state. 127
Figure 5.4 High resolution X-ray photoelectron spectrum (XPS) of as prepared Cu2MoS4 (A)
Survey spectrum in the range of 0 to 1200 eV, (B) core level spectrum of Cu 2p state, (C) core level spectrum of Mo 3d state, (D) core level spectrum of S 2p state. 127
Figure 5.5 (A) EDS spectrum of Cu2MoS4-rGO hybrid. 128
Figure 5.6 Elemental mapping of Cu2MoS4-rGO hybrid (A) FE-SEM micrographs for elemental
mapping, (B) copper, (C) molybdenum, (D) sulfur, (E) carbon, and (F) oxygen. 128
Figure 5.7 (A) EDS analysis of as prepared Cu2MoS4. 129
Figure 5.8 Elemental mapping of as prepared Cu2MoS4 (A) FE-SEM micrographs for elemental
mapping, (B) copper, (C) molybdenum, (D) sulfur. 129
Figure 5.9 The Brunauer-Emmett-Teller (BET) and the Barrett-Joyner Halenda (BJH) analysis
of pristine Cu2MoS4 and Cu2MoS4-rGO hybrid: (A) N2 adsorption-desorption isotherms of
adsorption-15 desorption isotherms of Cu2MoS4-rGO hybrid, and (D) pore size distribution curve of Cu2MoS4
-rGO hybrid. 131
Figure 5.10 Electrochemical performance of as prepared Cu2MoS4 and Cu2MoS4-rGO electrode
in three electrode system. (A) Cyclic voltammetric profile of Cu2MoS4 and Cu2MoS4-rGO
electrode measured at constant scan rate of 25 mV s-1, (B) cyclic voltammetric profile of the
Cu2MoS4-rGO electrode at various scan rates (5 to 100 mV s-1), (C) effect of scan rate on the
specific capacitance of Cu2MoS4-rGO electrode, (D) Galvanostatic charge-discharge profile of
Cu2MoS4 and Cu2MoS4-rGO electrode measured at constant current of 2.5 mA, (E)
Galvanostatic charge-discharge profile of Cu2MoS4-rGO electrode measured at different current
(1.5 to 10 mA), (F) effect of current on specific capacitance of Cu2MoS4-rGO electrode, (G)
Nyquist plot of Cu2MoS4 and Cu2MoS4-rGO electrode with inset shows the enlarged portion of
the Nyquist plot of Cu2MoS4-rGO electrode, (H) Ragone plot of Cu2MoS4, Cu2MoS4-rGO
electrode and values reported for other rGO based hybrid supercapacitor electrodes are added for comparison (References: R50-R53), and (I) The cyclic stability of Cu2MoS4-rGO electrode over
3000 cycles with inset shows the Nyquist plot of Cu2MoS4-rGO electrode initial and after cyclic
stability test. 132
Figure 5.11 Electrochemical performance of as prepared Cu2MoS4 electrode, (A) cyclic
voltammetric profile of the Cu2MoS4 electrode at various scan rates (5 to 200 mV s-1), and (B)
effect of scan rate on the specific capacitance of Cu2MoS4 electrode. 133
Figure 5.12 Electrochemical performance of as prepared Cu2MoS4 electrode, (A) Galvanostatic
charge-discharge profile of Cu2MoS4 electrode measured at different current (1.5 to 10 mA) and
(F) effect of current on the specific capacitance of Cu2MoS4 electrode. 134
Figure 5.13 Electrochemical performance of as prepared Cu2MoS4-rGO electrode in three
16 profile of Cu2MoS4-rGO electrode measured at various operating temperature, (B) effect of
temperature on specific capacitance of Cu2MoS4-rGO electrode from cyclic voltammetric profile,
(C) charge-discharge profiles of Cu2MoS4-rGO electrode measured at various operating
temperature, (D) effect of temperature on the specific capacitance of Cu2MoS4-rGO electrode
from charge-discharge profile, (E) Nyquist plot of Cu2MoS4-rGO electrode measured at different
operating temperature, and (F) variation of specific capacitance with respect to frequency of Cu2MoS4-rGO electrode at different operating temperature. 135
Figure 5.14 Variation of Bode phase angle concerning frequency of Cu2MoS4-rGO electrode at
different operating temperature (25 °C to 80 °C). 138
Figure 5.15 Electrochemical performance of as prepared rGO electrode. (A) CV profile of rGO
electrode measured at various scan rates (5 to100 mV s-1), (B) effect of scan rate on the specific
capacitance of rGO electrode, (C) CD profile of rGO electrode measured at different current (4 to 10 mA), (D) effect of current on specific capacitance of rGO electrode, (E) CV profile of rGO electrode measured at various operating temperature, and (F) effect of temperature on specific capacitance of rGO electrode from CV profile. 140
Figure 6.1 (A) Digital photographs of bare Ni Foam and CMS nanostructure anchored on Ni
foam, Field emission-scanning electron micrographs of CMS nanostructure anchored on Ni foam measured at different magnifications (B) 50 µm and (C) 10 µm. The elemental mapping of (D) copper, (E) molybdenum and (F) sulfur elements present in CMS nanostructure anchored on Ni foam. 155
Figure 6.2 FE-SEM image of CMS anchored on Ni foam. 155 Figure 6.3 (A) FE-SEM micrographs for elemental mapping and (B) EDS spectrum for CMS
17
Figure 6.4 X-ray photoelectron spectrum of CMS nanostructure anchored on Ni foam (A)
survey spectrum, (B) core level spectrum of Cu 2p state (C) core level spectrum of Mo 3d state, and (D) core level spectrum of S 2p state present in CMS nanostructure. 158
Figure 6.5 XRD pattern of CMS grown on Ni foam. 158
Figure 6.6 (A) UV–vis absorption spectrum for the CMS nanostructures. 159 Figure 6.7 (A) BET spectrum for CMS powder and (B) CMS/Ni foam. 159
Figure 6.8 Electrochemical performance of CMS/Ni electrode using three-electrode
configuration. (A) cyclic voltammetric profiles of CMS/Ni electrode measured at various scan rate, (B) effect of scan rate on the specific capacity of CMS/Ni electrode, (C) galvanostatic charge-discharge profile of CMS/Ni electrode measured at various current, and (D) effect of current on specific capacity of CMS/Ni electrode. 160
Figure 6.9 Cyclic voltammetry analysis of bare Ni foam and CMS/Ni electrode in three
electrode configuration. 161
Figure 6.10 Electrochemical performance of binder-based CMS electrode in three electrode
configuration. The three-electrode configuration test of binder-based CMS electrode was performed according to the method reported in our earlier literature. 161
Figure 6.11 (A) Effect of specific capacitance of CMS/Ni electrode with respect to scan rate (A),
and discharge current. 162
Figure 6.12 Potential window optimization of CMS/Ni SSC device using cyclic voltammetry:
(A) CV profile at different potential window, and (B) effect of specific capacitance of CMS/Ni SSC device with respect to different operating potential window (OPW). 163
Figure 6.13 Electrochemical performance of CMS/Ni SSC. (A) cyclic voltammetric profiles at
different scan rate, (B) effect of scan rate on the specific capacitance of CMS/Ni SSC, (C) Nyquist plot of CMS/Ni SSC (inset shows the enlarged view of the Nyquist plot), (D)
charge-18 discharge profiles of CMS/Ni SSC measured at different current, (E) effect of current on specific capacitance of CMS/Ni SSC, (F) Ragone plot of CMS/Ni SSC and the references R1-R9 are provided in Table 6.2. 164
Figure 6.14 (A) Bode phase angle plot, and (B) Plot of variation of specific capacitance of
CMS/Ni SSC device with respect to frequency. 164
Figure 6.15 (A) Cyclic stability performance for CMS/Ni SSC device, (B) Bode phase angle
plot initial and after 3000 cycles for CMS/Ni SSC device, (C) Plot of variation of specific capacitance of CMS/Ni SSC device with respect to frequency initial and after 3000 cycles for CMS/Ni SSC device, and (D) Nyquist plot of CMS/Ni SSC device measured during initial and after 3000 cycles. 165
Figure 6.16 Comparison of XRD spectra for CMS/Ni foam (a) initial and (b) after the cyclic test.
The peaks denoted to (*) correspond to Ni foam and (#) to Na2SO4. 166
Figure 6.17 FE-SEM micrograph for CMS/Ni SSC (A) before and (B) after cyclic stability
performance. 167
Figure 7.1 (A) Schematic illustration for fabrication of porous PVDF film via table salt
incorporated method. (B-D) Field emission-scanning electron micrographs of porous PVDF film obtained under different magnifications. (E-G) Elemental mapping micrographs of porous PVDF film in which (E) shows the overlay map, (F, G) represents the elemental maps of fluorine (F) and carbon (G) elements in the porous PVDF film. 182
Figure 7.2 FE-SEM micrographs of table salt-induced PVDF film at magnification of (A) 200
µm and (B) 100 µm. (C) EDX spectrum of table salt-induced PVDF film with an atomic percentage. 183
19
Figure 7.3 Elemental mapping micrographs of table salt incorporated PVDF film. The elemental
maps of (A) fluorine, (B) carbon, (C) sodium and (D) Chlorine elements present in table salt incorporated PVDF film. 183
Figure 7.4 (A) EDX spectrum of porous PVDF film showing the presence of C and F elements.
(B) X-ray diffraction pattern of porous PVDF film. (C) Fourier transform- infrared spectrum of porous PVDF film. (D) Laser Raman spectrum of porous PVDF film. 184
Figure 7.5 XRD pattern of (A) table salt incorporated PVDF film (JCPDS No:05-0628) and (B)
porous PVDF film. 185
Figure 7.6 FT-IR spectra of (A) table salt incorporated PVDF and (B) porous PVDF film. 186 Figure 7.7 Raman spectra (A) table salt incorporated PVDF and (B) porous PVDF film. 186 Figure 7.8 Piezoelectric energy harvesting properties of porous PVDF film. (A) Output voltage
profile of the porous PVDF film obtained using various compressive forces from 5 to 20 N, (B) Variation of the output voltage of the porous PVDF film under different magnitude (5 to 20 N) of applied force, (C) electromechanical stability of the porous PVDF film under continuous applied force of 10 N over 1000 seconds, (D) the enlarged view (last 30 seconds) of the output voltage profile given in Figure 7.8(C). 187
Figure 7.9 (A) Current profile of the porous PVDF film based nanogenerator device under
various compressive forces from 5 to 20 N. (B) Variation of the output current of the porous PVDF film under different magnitude (5 to 20 N) of the applied force. 188
Figure 7.10 Physico-chemical characterization of sonochemically prepared graphene sheets. (A)
The x-ray diffraction pattern of GO and graphene(rGO) sheets. (B) Fourier transform- infrared spectra of GO and graphene sheets. (C) C 1s core-level spectrum X-ray photoelectron spectrum of graphene sheets. (D) Laser Raman spectra of GO and graphene sheets. (E-F) Field emission-scanning electron micrographs of graphene sheets measured at different magnifications. The
20 inset in Figure 7.10(E) shows the FE-SEM overlay micrograph used for elemental mapping analysis, and (G-H) represents the elemental maps of carbon and oxygen elements present in graphene sheets, (I) EDX spectrum of graphene sheets. 189
Figure 7.11 Electrochemical analysis of the graphene SCSPC (CR2032 coin cell) in TEABF4
electrolyte. (A-E) Cyclic voltammetric profiles of the graphene SCSPC measured at the different operating potential window (1.0 to 3.0 V) using a scan rate of 200 mV s-1. (F) Effect of specific
capacitance of graphene SCSPC with respect to the different operating potential window (1.0 to 3.0 V). 191
Figure 7.12 Electrochemical analysis of the graphene SCSPC (CR2032 coin cell) using porous
PVDF incorporated TEABF4 electrolyte. (A-B) Cyclic voltammetric profiles of the graphene
SCSPC measured at scan rates (from 5 to 500 mV s-1). (C) Effect of gravimetric specific device
capacitance of graphene SCSPC with respect to applied scan rates. (D) Nyquist plot of graphene SCSPC. 192
Figure 7.13 The plot of variation of specific capacitance of graphene SCSPC with respect to
frequency. 192
Figure 7.14 Electrochemical analysis of the graphene SCSPC device. (A) Galvanostatic
charge-discharge profiles of graphene SCSPC measured at a constant current of 2.5 mA in the operating potential window from 0.0 to 3.0 V. (B) Charge-discharge profiles of graphene SCSPC obtained in different applied current ranges from 1 to 10 mA. (C) Effect of discharge current on the gravimetric specific device capacitance of graphene SCSPC, (D) Ragone plot of graphene SCSPC showing their superior performance metrics over the reported supercapacitors using ionic liquid electrolytes. The references (R1-R8) in Fig. 7.14(D) are provided in Table 7.1. 194
Figure 7.15 (A) Effect of areal specific capacitance of graphene SCSPC with respect to scan rate.
21
Figure 7.16 (A) Cyclic stability performance for graphene SCSPC over 10000 cycles with inset,
shows the Nyquist plot of graphene SCSPC measured during initial and after 10000 cycle. (B) The plot of variation of specific capacitance of graphene SCSPC with respect to frequency initial and after 10000 cycles. 196
Figure 7.17 The practical application of fully charged graphene SCSPC to glow (A) a white
LED-based night lamp, and (B) a blue LED-based night lamp. 197
Figure 7.18 Self-charging behaviour of the graphene SCSPC. (A-D) Self-charging properties of
graphene SCSPC subjected to different levels of applied compressive force from 5 to 20 N showing a maximum self-charging of graphene SCSPC device up to 112 mV using a compressive force of 20 N. 198
Figure 7.19 The effect of different applied forces on the self-charging performance of the
graphene SCSPC. 199
Figure 7.20 Schematic representation for the underlying working mechanism for the
self-charging process involved in graphene SCSPC when subjected to compressive force. (A) The normal (or uncharged) state of the graphene SCSPC with no applied compressive force (rest condition), (B) The graphene SCSPC is under compressive force. Piezoelectrical polarization produced by the porous PVDF separator, which migrates the electrolyte ions. (C) Migration of TEA+ and BF
4− ions towards the graphene electrode. (D) An equilibrium state has been reached
between piezoelectric potential created by the porous PVDF separator and the electrochemical reaction of the graphene SCSPC. (E) Completion of one self-charging cycle upon releasing of an external force and the piezoelectric potential disappeared in the graphene SCSPC. 200
22
ABSTRACT-HANGUL
사람이 생활하는 데에는 에너지가 필수적이다. 석유 같은 재생이 힘든 에너지원들이 고갈되어 감과 지구 온난화 및 기술의 발전에 의해 인류는 에너지 부족을 야기하고 있다. 이로 인해, 친환경적이면서 고성능인 에너지 수확, 저장 및 변환 장치에 대한 요구가 증가하고 있다. 전기화학적 에너지는 청정에너지와 관련하여 빠질 수 없는 부분이다. 수퍼커패시터, 연료 전지 및 배터리 같은 기존의 에너지장치는 전기화학적 반응을 통해 화학에너지를 전기에너지로 변환함으로써 다양한 휴대용 전자장치 및 전기 자동차 등에 사용되어왔다. 슈퍼커패시터 중에는 친환경적이며 빠른 충 방전 시간, 초고전력 등 다양한 휴대용 전자장치의 전력 공급원으로서 훌륭한 특성으로 인해 많은 주목을 받고 있는 것이 있다. 하지만, 충분치 않은 에너지 양 등이 수퍼커패시터의 실적용에 관하여 문제로 남아있다. 지난 10 년간 수퍼커패시터의 특정 전력, 특정 에너지 및 장시간 사용 안정성 등 과 같은 성능을 향상시키기 위해 여러 그룹에서 연구 작업이 진행되었다. 고성능을 위해 수퍼커패시터 장치를 위한 주요독립소자를 찾아야 한다. 수퍼커패시터 장치의 독립소자를 고려하면 전도성 기판, 전해질 및 전극 재료는 수퍼커패시터의 전기화학적 성능에 중요한 부분을 제공한다. 다양한 유형의 전극 재료23 중에서, 나노입자, 나노시트 및 나노와이어 같은 나노구조 전극재료는 짧은 전극, 이온 수송 경로 및 높은 비표면적에 대한 접근성으로 인해 향상된 전기화학적 성능을 보인다. 수퍼커패시터 장치의 실적용 관점에서, 에너지 변환 및 저장은 휴대용 및 착용 가능한 전자 장치의 전원 공급을 위해 단일 시스템 안에서 이루어져야 한다. 전통적으로, 에너지 저장과 에너지 수확은 별개의 작업 메커니즘 및 독립적 물리장치를 사용하는 것으로 잘 알려진 현상이다. 자가충전 수퍼커패시터 파워셀은 외부에서 가해진 기계적 에너지를 “압전-전기화학적 공정”을 통해 전기적 에너지로 변환하고 배터리 혹은 수퍼커패시터 장치에 저장할 수 있는 가능성을 갖고 있다. SCSPC 장치의 자가충전 전압 및 에너지 변환 효율은 전원 공급 전자 장치를 위한 중요한 기준을 충족하기 위해 향상되어야 한다. 따라서 SCSPC 장치의 성능 개선은 지속 가능한 에너지원과 관련하여 상당한 관심을 끌고 있다. 에너지 저장 장치 및 SCSPC 장치와 관련하여 모든 기능을 고려하여, 이 논문은 주로 성능이 개선된 수퍼커패시터 및 자가 충전 수퍼커패시터 파워 셀을 위한 나노구조 전극 재료에 집중되었다. 챕터 3 에서는 전이 금속 셀레나이드 (α-MnSe) 나노 입자의 합성을 설명하고 3 전극 시스템 및 대칭형 수퍼커패시터 장치에서 수퍼커패시터 응용을 위한 양극 재료로써의 전기화학적 분석을 하였다. 챕터 4 에서는 수열공정을 통하여 구리 몰리브덴
24 황화물 (Cu2MoS4) 나노 입자의 합성을 나타내고 3 전극 셋업 및 대칭형 수퍼커패시터 (SSC) 장치에서 수퍼커패시터 전극으로서 전기화학적 분석을 하였다. Cu2MoS4 전극은 약 127 F / g 의 비중 측정 커패시턴스를 보였고 SSC 는 탁월한 주기 안정성으로 28.25 F / g 의 비중 커패시턴스를 나타냈다. 또한 챕터 5 에서 Cu2MoS4 의 슈퍼 용량 특성을 개선하기 위해, Cu2MoS4-rGO 복합 재료는 열 수법을 통해 제조되고 슈퍼 용량 성능이 확인되었다.
Cu2MoS4-rGO 복합 전극은 노출된 Cu2MoS4전극에 비해 더 우수한 비정전 용량 (231.51 F
g-1)을 나타낸다. Cu
2MoS4-rGO 복합 전극의 전기 화학적 성능의 향상은 Cu2MoS4 나노
입자와 rGO 시트 사이의 화학적 상호 작용과 관련 될 수 있으며, 이는 전기 화학적 공정을 위한 더 활성화된 부위를 생성한다. 열악한 환경에서 수퍼커패시터를 적용하는 관점에서, 수성 Na2SO4 전해질의 25 ° C ~ 80 ° C 의 온도 범위에서 Cu2MoS4-rGO 복합 전극에 대한 자세한 온도 의존적 수퍼커패시터 연구가 수행되었다. Cu2MoS4전극의 중량 커패시턴스 및 비 에너지를 보다 향상시키기 위해, 바인더가 없는 전극 제조 전략이 챕터 6 에서 선택되었다. Cu2MoS4나노 구조의 직접 성장은 열 수법을 사용하여 Ni 폼에서 발생하였고 그들의 수퍼커패시티브 특성을 분석하였다. 3 극 시스템에서 바인더가 없는 Cu2MoS4 전극에 대해 2278.83 F / g 의 비중 측정 커패시턴스가 달성되었다. Cu2MoS4 SSC 장치 (바인더 프리)는 탁월한 비 에너지 (23.61 Wh / kg)로 265.62 F / g 의 커패시턴스를
25 전달하였다. Ni 폼 전극에 고정된 바인더 프리 Cu2MoS4는 이온 전달 경로가 짧고 독특한
구조의 뛰어난 전자 전도성으로 인해 바인더 기반 Cu2MoS4 전극 및 Cu2MoS4-rGO 복합
전극에 비해 우수한 수퍼커패시티브 특성을 보여준다. 마지막으로, 수퍼커패시터의 실제
적용을 고려하여, 챕터 7 에서 SCSPC 가 제조 및 논의되었다. SCSPC 는 에너지 저장
장치를 위한 고유 전극 (그래핀 시트) 및 TEABF4 전해질이 통합된 압전 분리기 (table salt
derived porous PVDF) 를 사용하여 제조되었다. 다공성 PVDF (table salt derived) 압전
분리기는 20N 의 인가된 힘에서 약 11V 의 전압을 발생시켰다. 유사하게, 그래핀
SCSPC 의 전기 화학적 성능은 35.58Wh / kg 의 에너지 밀도와 함께 약 28.46F / g 의 장치
특정 중량 커패시턴스를 갖는다. 그래핀 SCSPC 는 112mV 까지 자가충전 되었으며 이는
탄소 SCSPC 를 기반으로 한 과거의 연구보다 높다.
실험적 증거는 다공성 PVDF (table salt derived) 압전 분리기를 사용하여 기계적
에너지를 전기 에너지로 변환하고 그래핀 SCSPC 장치를 사용한 에너지 저장을 보여
주었으며, 결과적으로 휴대용 및 착용 가능한 전자 장치에 전력을 공급하기 위한 차세대
자체 전원 장치 개발에 대한 관심을 고려하였다.
사람이 생활하는 데에는 에너지가 필수적이다. 석유 같은 재생이 힘든
26 야기하고 있다. 이로 인해, 친환경적이면서 고성능인 에너지 수확, 저장 및 변환 장치에 대한 요구가 증가하고 있다. 전기화학적 에너지는 청정에너지와 관련하여 빠질 수 없는 부분이다. 수퍼커패시터, 연료 전지 및 배터리 같은 기존의 에너지장치는 전기화학적 반응을 통해 화학에너지를 전기에너지로 변환함으로써 다양한 휴대용 전자장치 및 전기 자동차 등에 사용되어왔다. 슈퍼커패시터 중에는 친환경적이며 빠른 충 방전 시간, 초고전력 등 다양한 휴대용 전자장치의 전력 공급원으로서 훌륭한 특성으로 인해 많은 주목을 받고 있는 것이 있다. 하지만, 충분치 않은 에너지 양 등이 수퍼커패시터의 실적용에 관하여 문제로 남아있다. 지난 10 년간 수퍼커패시터의 특정 전력, 특정 에너지 및 장시간 사용 안정성 등 과 같은 성능을 향상시키기 위해 여러 그룹에서 연구 작업이 진행되었다. 고성능을 위해 수퍼커패시터 장치를 위한 주요독립소자를 찾아야 한다. 수퍼커패시터 장치의 독립소자를 고려하면 전도성 기판, 전해질 및 전극 재료는 수퍼커패시터의 전기화학적 성능에 중요한 부분을 제공한다. 다양한 유형의 전극 재료 중에서, 나노입자, 나노시트 및 나노와이어 같은 나노구조 전극재료는 짧은 전극, 이온 수송 경로 및 높은 비표면적에 대한 접근성으로 인해 향상된 전기화학적 성능을 보인다. 수퍼커패시터 장치의 실적용 관점에서, 에너지 변환 및 저장은 휴대용 및 착용 가능한 전자 장치의 전원 공급을 위해 단일 시스템 안에서 이루어져야 한다. 전통적으로,
27 에너지 저장과 에너지 수확은 별개의 작업 메커니즘 및 독립적 물리장치를 사용하는 것으로 잘 알려진 현상이다. 자가충전 수퍼커패시터 파워셀은 외부에서 가해진 기계적 에너지를 “압전-전기화학적 공정”을 통해 전기적 에너지로 변환하고 배터리 혹은 수퍼커패시터 장치에 저장할 수 있는 가능성을 갖고 있다. SCSPC 장치의 자가충전 전압 및 에너지 변환 효율은 전원 공급 전자 장치를 위한 중요한 기준을 충족하기 위해 향상되어야 한다. 따라서 SCSPC 장치의 성능 개선은 지속 가능한 에너지원과 관련하여 상당한 관심을 끌고 있다. 에너지 저장 장치 및 SCSPC 장치와 관련하여 모든 기능을 고려하여, 이 논문은 주로 성능이 개선된 수퍼커패시터 및 자가 충전 수퍼커패시터 파워 셀을 위한 나노구조 전극 재료에 집중되었다. 챕터 3 에서는 전이 금속 셀레나이드 (α-MnSe) 나노 입자의 합성을 설명하고 3 전극 시스템 및 대칭형 수퍼커패시터 장치에서 수퍼커패시터 응용을 위한 양극 재료로써의 전기화학적 분석을 하였다. 챕터 4 에서는 수열공정을 통하여 구리 몰리브덴 황화물 (Cu2MoS4) 나노 입자의 합성을 나타내고 3 전극 셋업 및 대칭형 수퍼커패시터 (SSC) 장치에서 수퍼커패시터 전극으로서 전기화학적 분석을 하였다. Cu2MoS4 전극은 약 127 F / g 의 비중 측정 커패시턴스를 보였고 SSC 는 탁월한 주기 안정성으로 28.25 F / g 의 비중 커패시턴스를 나타냈다. 또한 챕터 5 에서 Cu2MoS4 의 슈퍼 용량 특성을 개선하기
28 위해, Cu2MoS4-rGO 복합 재료는 열 수법을 통해 제조되고 슈퍼 용량 성능이 확인되었다.
Cu2MoS4-rGO 복합 전극은 노출된 Cu2MoS4전극에 비해 더 우수한 비정전 용량 (231.51 F
g-1)을 나타낸다. Cu
2MoS4-rGO 복합 전극의 전기 화학적 성능의 향상은 Cu2MoS4 나노
입자와 rGO 시트 사이의 화학적 상호 작용과 관련 될 수 있으며, 이는 전기 화학적 공정을 위한 더 활성화된 부위를 생성한다. 열악한 환경에서 수퍼커패시터를 적용하는 관점에서, 수성 Na2SO4 전해질의 25 ° C ~ 80 ° C 의 온도 범위에서 Cu2MoS4-rGO 복합 전극에 대한 자세한 온도 의존적 수퍼커패시터 연구가 수행되었다. Cu2MoS4전극의 중량 커패시턴스 및 비 에너지를 보다 향상시키기 위해, 바인더가 없는 전극 제조 전략이 챕터 6 에서 선택되었다. Cu2MoS4나노 구조의 직접 성장은 열 수법을 사용하여 Ni 폼에서 발생하였고 그들의 수퍼커패시티브 특성을 분석하였다. 3 극 시스템에서 바인더가 없는 Cu2MoS4 전극에 대해 2278.83 F / g 의 비중 측정 커패시턴스가 달성되었다. Cu2MoS4 SSC 장치 (바인더 프리)는 탁월한 비 에너지 (23.61 Wh / kg)로 265.62 F / g 의 커패시턴스를 전달하였다. Ni 폼 전극에 고정된 바인더 프리 Cu2MoS4는 이온 전달 경로가 짧고 독특한
구조의 뛰어난 전자 전도성으로 인해 바인더 기반 Cu2MoS4 전극 및 Cu2MoS4-rGO 복합
전극에 비해 우수한 수퍼커패시티브 특성을 보여준다. 마지막으로, 수퍼커패시터의 실제
29 장치를 위한 고유 전극 (그래핀 시트) 및 TEABF4 전해질이 통합된 압전 분리기 (table salt
derived porous PVDF) 를 사용하여 제조되었다. 다공성 PVDF (table salt derived) 압전
분리기는 20N 의 인가된 힘에서 약 11V 의 전압을 발생시켰다. 유사하게, 그래핀
SCSPC 의 전기 화학적 성능은 35.58Wh / kg 의 에너지 밀도와 함께 약 28.46F / g 의 장치
특정 중량 커패시턴스를 갖는다. 그래핀 SCSPC 는 112mV 까지 자가충전 되었으며 이는
탄소 SCSPC 를 기반으로 한 과거의 연구보다 높다.
실험적 증거는 다공성 PVDF (table salt derived) 압전 분리기를 사용하여 기계적
에너지를 전기 에너지로 변환하고 그래핀 SCSPC 장치를 사용한 에너지 저장을 보여
주었으며, 결과적으로 휴대용 및 착용 가능한 전자 장치에 전력을 공급하기 위한 차세대
30
ABSTRACT
Energy is indispensable for human establishment. Insufficient sources of non-renewable energy along with an increase in global warming and evolution in technology put human beings under the nose of an energy crisis. So, there has been an increasing requirement for environment-friendly, high-performance energy harvesting, storing and conversion devices. Electrochemical energy is an unpreventable fragment of the clean energy portfolio. Unconventional energy devices, such as supercapacitors, fuel cells, and batteries, have been used in various portable electronic devices and electric vehicles due to the conversion of chemical energy into electrical energy via electrochemical reactions. Amongst supercapacitor has gained much attention due to their admirable characteristics, including eco-friendly nature, rapid charging/discharging time, and ultrahigh specific power, which are immensely anticipated as an auspicious contender to meet the demands to supply power for various portable electronic devices. However, extensive implementations of supercapacitors remain a question, with unfulfilled energy demands. Several research works were carried out by several research groups to enhance the performance metrics like specific power, specific energy, and long cyclic stability of supercapacitors through last decade. The choosing of significant independent elements for the supercapacitor devices is extremely required to acquire high performance. Taking into consideration of independent elements of supercapacitor devices, the conducting substrate, electrolyte, and electrode material provides a crucial part in the electrochemical performances of supercapacitor. Among various types of electrode materials, nanostructured electrode materials like nanoparticle, nanosheet, and nanowire exhibit enhanced electrochemical performance due to their accessibility of short electron and ion transport pathways and high specific surface area.
In the view of the practical application of a supercapacitor device, the energy conversion and storage should be in a single system to power up portable and wearable electronic devices.
31 Traditionally, energy storage and energy harvesting are two well-known phenomena using distinct working mechanisms and independent physical units. The self-charging supercapacitor power cell (SCSPC) has the potential to convert mechanical energy from applied stress/force to electrical energy and stores them in battery or supercapacitor device via “piezo-electrochemical process”. The self-charging voltage and energy conversion efficiency of SCSPC devices are needed to be enhanced to meet out the significant criterions for power up electronic devices. Hence the improvement in the performance of SCSPC device attract considerable attention considering the emergence of sustainable energy sources. Taking all the features into consideration with respect to energy storage device and SCSPC device, this thesis is mostly concentrated on nanostructured electrode materials towards supercapacitor and self-charging supercapacitor power cell with improved performance.
Chapter-3 of this thesis presents the synthesis of transition metal selenide (α-MnSe) nanoparticle and performed electrochemical analysis as a positive electrode material for supercapacitor applications in three-electrode system and symmetric supercapacitor devices. Chapter-4 of this thesis represents the synthesis of copper molybdenum sulfide (Cu2MoS4)
nanoparticles using the hydrothermal process and performed the electrochemical analysis as supercapacitor electrode in both three-electrode setup and symmetric supercapacitor (SSC) device. The Cu2MoS4 electrode showed specific gravimetric capacitance of about 127 F/g and
SSC exhibited a specific capacitance of 28.25 F/g with superb cyclic stability. Further to improve supercapacitive properties of Cu2MoS4, Cu2MoS4-rGO composite material is prepared
via hydrothermal method and performed supercapacitive performance in chapter-5. The Cu2MoS4-rGO composite electrode exhibits better specific capacitance (231.51 F g-1) compare to
the bare Cu2MoS4 electrode. The enhancement in the electrochemical performance of Cu2MoS4
32 nanoparticles, and rGO sheets, which producing more active sites for the electrochemical process. In the view of application of supercapacitor in the harsh environment, the detailed temperature-dependent supercapacitor study occurred for Cu2MoS4-rGO composite electrode in
the applied temperature range of 25 °C to 80 °C in aqueous Na2SO4 electrolyte. For more
improving the gravimetric capacitance and the specific energy of Cu2MoS4 electrode, a binder
free electrode fabrication strategy has been chosen in chapter-6. The direct growth of Cu2MoS4
nanostructures occurred on Ni foam using hydrothermal method and analyzed their supercapacitive properties. The specific gravimetric capacitance of 2278.83 F/g was achieved for binder-free Cu2MoS4 electrode in three electrode system. The Cu2MoS4 SSC device (binder-free)
delivered capacitance of 265.62 F/g with excellent specific energy (23.61 Wh/kg). The binder free Cu2MoS4 anchored on Ni foam electrode shows better supercapacitive properties compare
to binder based Cu2MoS4 electrode and Cu2MoS4-rGO composite electrode due to their short ion
transport pathways, and superb electronic conductivity of unique architecture. Finally, in view of practical application of supercapacitor, a SCSPC was fabricated and discussed in chapter-7. A SCSPC was fabricated using unique electrodes (graphene sheets) for energy storage device, and piezo-separator (table salt derived porous PVDF) incorporated with TEABF4 electrolyte. The
porous PVDF (table salt derived) piezo-separator generated a voltage of about 11 V at an applied force of 20 N. Similarly, electrochemical performance of graphene SCSPC possesses device specific gravimetric capacitance of about 28.46 F/g with energy density of 35.58 Wh/kg. The graphene SCSPC was self-charged up to 112 mV, which is higher than the past works based on carbon SCSPC. The experimental evidence demonstrated the conversion of mechanical energy into electrical energy using porous PVDF (table salt derived) piezo-separator and storage using the graphene SCSPC device, consequently considering the attention towards the development of future-generation self-powered devices for powering up portable and wearable electronics.
33
CHAPTER 1
INTRODUCTION
1.1. Background
Energy conversion and energy storage have become a worldwide concern in current days because of rapid consumption of available energy resources and global warming issues. In an effort to fight the rising greenhouse gases emission caused by the burning of these limited conventional natural resources, human society is moving towards developing renewable energy sources, such as solar-, wind-, hydropower-, and geothermal- energy that offer justifiable energy in environmentally friendly manner1–5. At the same time the destruction of environmental
hazards like nuclear waste from non-renewable sources from the nuclear plants. Additionally, over past few decades the market price of fossil fuels has rapidly increasing day by day which makes more pressure on economic progress of the developing and developed countries 6. Hence
the fabrication of an efficient energy or power source device using renewable resources (solar, wind, hydropower etc.) that offer sustainable energy without losing the environmental quality. Therefore, these inadequate energy resources mainly depend on natural conditions (e.g., rain-, wind-, sunshine-, and location); thus, innovative technology is essential to convert the off-peak electricity into various forms of energy conversion and storage system to fill the energy shortages during the on-peak period 7.
1.2. Significance of electrochemical energy storage devices
To retain an equilibrium amid the desires of predominant energy demands and the ecological issues, investment in electrochemical energy storage (EES) is needed to accompany in a green energy future8. Electrochemical energy storage- and conversion- systems with good
34 batteries (SIBs), supercapacitors (SCs), and water-splitting, are very encouraging technologies for conquering the universal energy challenges 9–13. The EES has fascinated among various
classes of energy storing systems due to its numerous merits such as ultra-high efficiency conversion rate, direct energy conversion without intermediate step, miniaturization, portability, convenience to scale up and minimum pollution. The SCs and LIBs are at the frontier of this research due to extensively uses in our day to day life, powering various advanced electronic devices and new electric vehicles. However, the crucial tasks and problem headed for the commercialization of EES system, have been broadly considered in different fields of technology basically on electrode materials and electrolyte. Along with some practical problems and when selecting the SCs and LIBs, the usage with lower cost electrode material is a major issue.
Figure 1.2 Evaluation of energy storage devices by Ragone plot.
Amongst the EES systems, supercapacitors (SCs) have captivated substantial interest in both academia and industry because of their unique properties such as superior power density induced due to a fast charge-discharge rates and a long-life cycle in comparison with batteries and
fuel-35 cells. Practically, SCs have maximal power (kW kg-1) than batteries which are theoretically very
low as shown in Figure 1.1.Hence, SCs are most auspicious candidate for alternative energy storage systems with longer life time and lighter weight than other energy storage devices 14.
Currently, due to ultrahigh power densities SCs are used in verities of applications such as in industrial power and energy management, memory back-up systems, portable electronics15.
1.3 CLASSIFICATION OF SUPERCAPACITORS
Based on the charge storage process and existing R & D technologies, SCs can be categorized as electrochemical dual-layer capacitors (EDLCs), pseudo-capacitors and hybrid-ion capacitors 16. The categorization of SCs is acquired in the Figure 1.3.
1.3.1 ELECTROCHEMICAL DOUBLE- LAYER CAPACITORS (EDLC)
The charge-storage process in EDLCs is depending on the electrostatic adsorption of the electrolyte-ions on the electroactive materials surface. Thus, the significant thing is to achieve high capacitance of EDLCs is in employing a highly available surface area and electrically conducting electrodes. Nanostructured carbonaceous materials possessing a larger surface area and decent electrical conductivity are the materials of excellent-choice for EDLCs.
Carbonaceous materials like as graphene and their derivatives, carbon-nanotubes, activated carbon, carbon in various forms (nanocoils-, nanohorns-, onions-), carbon fabrics, carbon fibers, zeolite-templated carbons, carbon aerogels, carbide-derived carbons, and porous carbons having electrical conductivity, electrochemical stability, and highly accessible surface area along with low-cost could manage all the necessities for SCs application17. The EDLC
nature of the carbonaceous electrode is mainly ruled by their structure along with the porosity and specific surface area. The charge storage process in the EDLC succeeds through the electrostatic adsorption of ions (EDLC), at the interface between the electrolyte and electrode by employing the applied cell voltage. In the 19th century, the idea of EDL was first proposed by
36 Helmholtz when he explored the scattering of opposite charges at interface on colloidal microparticles. The Helmholtz double layer model describes that the two layers of opposite charge appear at the electrolyte/electrode interface and the layers are separated by an atomic distance.
Figure 1.3 Categorization of SCs.
Later, Gouy and Chapman modified the Helmholtz double layer model to study the thermal motion of ions closer to a charged surface, which is denoted as diffuse layer. The perception of EDLC is a grouping of two regions; (i) the inner and (ii) the diffuse layer. Therefore, the entire capacitance (C) can be stated by the following relation 18:
1/C = 1/Ci + 1/Cd ……… (2)
Where Ci is the inner (Helmholtz) layer capacitance self-governing of the
37 Chapman theory. Classically, carbon-based materials and their derivatives are used in EDLCs behavior (graphene, porous carbon, activated carbon and carbon nanotubes (CNTs)).
Figure 1.3.1 Representations of the EDLC at a positively charged surface: (a) Helmholtz model, (b) Gouy–Chapman (GC) model, and (c) Stern model, representing the (i) inner and (ii) outer Helmholtz planes.
1.3.2 PSEUDOCAPACITORS
In pseudo-capacitors, the charge storage process arisen between electrode and electrolyte interface which result in bulk oxidation in anode and reduction in cathode (i.e. oxidation-reduction reactions or redox reaction or faradic reaction19,20).The faradaic mechanism
can be categorized as different electrochemical features: (1) under-potential deposition (UD), (2) redox capacitance (example: transition metal oxides), and (3) intercalation pseudo-capacitance. Under-potential (UD) is created when the adsorbents of metal-ions at a distinct metal's surface which is well above their redox potential. One typical illustration of UD is that of Pb on the surface of an Au electrode. Redox pseudocapacitance/diffusion capacitance rises while ions are electrochemically adsorbed onto the surface/near surface of an electrode material with the allied phase charge-transfer. As well, another kind of capacitance called
38 intercalation/diffusion capacitance arises due to the diffusioin of ions into the layers/channel of an electrode material in the company of a phase charge-transfer with absence of crystallographic phase alteration. It worthy to note that these three kind of mechanisms occurs due to the different materials and various physio-chemical process; the resemblance in the electrochemical signs rises because of the connection between potential (voltage difference) and the amount of charge that grows as a result of EDLC processes at the electrolyte/electrode interface (EEI) /within the internal surface of a material21. These processes are described in Figure 1.3.2.
Figure 1.3.2 Reversible redox mechanisms: (a) under-potential deposition (UD), (b) redox pseudo-capacitance, and (c) intercalation pseudo-capacitance.
Transition metal oxides (e.g. MnO
2, Fe
3O
4, and RuO
2), transition metal
sulfides/selenides (e.g. MoS
2, MoSe
2), carbon nanomaterials holding oxygen related
surface functional groups, and conducting polymers (e.g. polyaniline (PANi),
polypyrrole (PPy), and polythiophene (PT))
22–24are generally being used as a
pseudo-capacitor materials.
39 Current research efforts on SCs displays that new strategies must be applied to achieve a high energy density as compared to the lithium-ion batteries with different attempts. Later, a new strategy is proposed using the combination both Faradaic and non-Faradaic processes in order to store charge in hybrid capacitors to accomplish a higher energy and power densities than the lithium-ion batteries.
The phrase “hybrid” in SC can be used if pairing the two electrodes with diverse charge storage properties, i.e., one faradaic and one capacitive, that characteristics lie in between a SC and a battery device. While, “asymmetric supercapacitor” employs an extensive range of electrode combinations since it can be utilized electrodes of the same nature but with various mass loading, or in the combination of two electrodes using different materials. Brousse et al., recently stated that the term “asymmetric” should be used only when pseudocapacitive or capacitive electrodes are involved so as to evade confusion with true “hybrid” devices 25–27.
There are many literatures on the usage of faradaic electrode materials for electrochemical capacitor applications including our published reports. Sadly, few of these materials are denoted as “pseudocapacitive” materials although the reason that their electrochemical nature (i.e., charge/discharge curve and cyclic voltammogram) is akin to that of “battery electrodes”. Generally, positive electrodes for hybrid supercapacitors are based on same faradaic reaction as we discussed in previous section. But it is potential independent charge storage behavior which should be denoted as “battery like electrodes” of faradaic electrodes. Hybrid SCs devices compose of asymmetric cells. In hybrid SCs devices, numerous charge-storage mechanisms are applied in the positive and negative electrode. For instance, one electrode uses the EDLC mechanism (that is, carbon based electrode) whereas the further charge storage by means of pseudo-capacitive reactions, that is, as happens in transition oxides, except MnO2, RuO228,29.
40 Generally, electrode materials and electrolytes play key roles to decide the specific capacitance, which has been getting more attention from research and academia. It is demonstrated that monitoring the structure and physical property of electrode materials are deciding factors to improve the performance SCs including good specific capacitance, better rate capability and cyclic life 30. Overall, the electrode materials of supercapacitor can be categorized
as: (1) carbon-based materials, (2) metal oxides, (3) polymers, and (4) transition metal chalcogenides.
1.3.4.1 Carbon based electrode materials
Carbon materials store charges electrostatically on their surfaces by means of reversible adsorption/desorption of ions of the electrolyte onto active electrode materials. Carbon-based materials have been broadly investigated as electrode materials for SCs due to a unique combination of physical features such as good surface area, lightweight, good electrical conductivity, controlled pore size distribution, and compatibility with other materials.
(i) Activated carbons (ACs): Activated carbon (AC) is a non-graphitic carbon (i.e. disordered
carbon) and holding the property of high-porosity nature31. It can be seen from the interplanar
spacing (0.335 nm) of activated carbon which is smaller than the graphite interplanar spacing (0.34-0.35 nm) and also this AC consist of several number of disorder graphene layers or basal layer, branded as turbostatic carbon. ACs are extensively utilized electrode materials owing to their high surface area, relatively good electrical properties and reasonable cost. ACs are usually can be generated from physical (thermal) and/or chemical activation of numerous types of carbonaceous materials (e.g. wood, coal, nutshell, etc.) 18,32.
(ii) Carbon nanotubes (CNTs): CNTs displays high advantages of exceptional inter-connected
mesoporous structure, high electronic conductivity, good mechanical and thermal stability 33.