저작자표시-비영리-변경금지 2.0 대한민국 이용자는 아래의 조건을 따르는 경우에 한하여 자유롭게 l 이 저작물을 복제, 배포, 전송, 전시, 공연 및 방송할 수 있습니다. 다음과 같은 조건을 따라야 합니다: l 귀하는, 이 저작물의 재이용이나 배포의 경우, 이 저작물에 적용된 이용허락조건 을 명확하게 나타내어야 합니다. l 저작권자로부터 별도의 허가를 받으면 이러한 조건들은 적용되지 않습니다. 저작권법에 따른 이용자의 권리는 위의 내용에 의하여 영향을 받지 않습니다. 이것은 이용허락규약(Legal Code)을 이해하기 쉽게 요약한 것입니다. Disclaimer 저작자표시. 귀하는 원저작자를 표시하여야 합니다. 비영리. 귀하는 이 저작물을 영리 목적으로 이용할 수 없습니다. 변경금지. 귀하는 이 저작물을 개작, 변형 또는 가공할 수 없습니다.
A THESI
S
FOR THE DEGREE OF MASTER OF
ENGI
NEERI
NG
PhysicochemicalPropertiesofCitrusHallabong
PowdersandGranules
Chung-WooLee
Depar
t
mentofFoodSci
enceandEngi
neer
i
ng
GRADUATE SCHOOL
J
EJ
U NATI
ONAL UNI
VERSI
TY
Cont
ent
s
요약 ·
·
·
·
·
·
·
·
·
·
·
·
·
·
·
·
·
·
·
·
·
·
·
·
·
·
·
·
·
·
·
·
·
·
·
·
·
·
·
·
·
·
·
·
·
·
·
·
·
·
·
·
·
·
·
·
·
·
·
·
·
·
·
·
·
·
·
·
·
·
·
·
·
·
·
·
·
·
·
·
·
·
·
·
·
·
·
·
·
·
·
·
·
·
·
·
·
·
·
ⅴ
Li
stofFi
gur
es·
·
·
·
·
·
·
·
·
·
·
·
·
·
·
·
·
·
·
·
·
·
·
·
·
·
·
·
·
·
·
·
·
·
·
·
·
·
·
·
·
·
·
·
·
·
·
·
·
·
·
·
·
·
·
·
·
·
·
·
·
·
·
·
·
·
·
·
·
·
·
·
·
·
·
·
·
ⅷ
Li
stofTabl
es·
·
·
·
·
·
·
·
·
·
·
·
·
·
·
·
·
·
·
·
·
·
·
·
·
·
·
·
·
·
·
·
·
·
·
·
·
·
·
·
·
·
·
·
·
·
·
·
·
·
·
·
·
·
·
·
·
·
·
·
·
·
·
·
·
·
·
·
·
·
·
·
·
·
·
·
·
·
·
ⅸ
ABSTRACT·
·
·
·
·
·
·
·
·
·
·
·
·
·
·
·
·
·
·
·
·
·
·
·
·
·
·
·
·
·
·
·
·
·
·
·
·
·
·
·
·
·
·
·
·
·
·
·
·
·
·
·
·
·
·
·
·
·
·
·
·
·
·
·
·
·
·
·
·
·
·
·
·
·
·
·
·
·
·
·
·
·
·
ⅺ
I
NTRODUCTI
ON·
·
·
·
·
·
·
·
·
·
·
·
·
·
·
·
·
·
·
·
·
·
·
·
·
·
·
·
·
·
·
·
·
·
·
·
·
·
·
·
·
·
·
·
·
·
·
·
·
·
·
·
·
·
·
·
·
·
·
·
·
·
·
·
·
·
·
·
·
·
·
·
·
·
·1
Par
tI
:Physi
cochemi
calPr
oper
t
i
esofCi
t
r
usHal
l
abong
Powder
s
1.MATERI
ALS AND METHODS·
·
·
·
·
·
·
·
·
·
·
·
·
·
·
·
·
·
·
·
·
·
·
·
·
·
·
·
·
·
·
·
·
·
·
·
·
·
·
·
·3
1
.
1Ma
t
e
r
i
al
sandc
he
mi
c
al
s·
·
·
·
·
·
·
·
·
·
·
·
·
·
·
·
·
·
·
·
·
·
·
·
·
·
·
·
·
·
·
·
·
·
·
·
·
·
·
·
·
·
·
·
·
·
·
·
·
·
·
·
·
·3
1
.
2Pr
e
par
a
t
i
onofHa
l
l
abongpowde
r
s·
·
·
·
·
·
·
·
·
·
·
·
·
·
·
·
·
·
·
·
·
·
·
·
·
·
·
·
·
·
·
·
·
·
·
·3
1
.
3Me
as
ur
e
me
ntofc
he
mi
c
a
lpr
ope
r
t
i
e
soft
hepowde
r
s
·
·
·
·
·
·
·
·
·
·
·
·
·
·
·
·
·
·
·
·
·
·
·
·
·
·
·
·
·
·
·
·
·
·
·
·
·
·
·
·
·
·
·
·
·
·
·
·
·
·
·
·
·
·
·
·
·
·
·
·
·
·
·
·
·
·
·
·
·
·
·
·
·
·
·
·
·
·
·
·
·
·
·
·
·
·
·
·
·
·
·
·
·
·
·
·
·
·
·
·4
1
.
3
.
1Moi
s
t
ur
ec
ont
e
nt·
·
·
·
·
·
·
·
·
·
·
·
·
·
·
·
·
·
·
·
·
·
·
·
·
·
·
·
·
·
·
·
·
·
·
·
·
·
·
·
·
·
·
·
·
·
·
·
·
·
·
·
·
·
·
·
·
·
·
·
·
·
·4
1
.
3
.
2Sol
ubl
e
-s
ol
i
ds·
·
·
·
·
·
·
·
·
·
·
·
·
·
·
·
·
·
·
·
·
·
·
·
·
·
·
·
·
·
·
·
·
·
·
·
·
·
·
·
·
·
·
·
·
·
·
·
·
·
·
·
·
·
·
·
·
·
·
·
·
·
·
·
·
·
·
·
·4
1
.
3
.
3pH andt
i
t
r
at
a
bl
eac
i
di
t
y·
·
·
·
·
·
·
·
·
·
·
·
·
·
·
·
·
·
·
·
·
·
·
·
·
·
·
·
·
·
·
·
·
·
·
·
·
·
·
·
·
·
·
·
·
·
·
·4
1
.
3
.
4Vi
t
ami
nC·
·
·
·
·
·
·
·
·
·
·
·
·
·
·
·
·
·
·
·
·
·
·
·
·
·
·
·
·
·
·
·
·
·
·
·
·
·
·
·
·
·
·
·
·
·
·
·
·
·
·
·
·
·
·
·
·
·
·
·
·
·
·
·
·
·
·
·
·
·
·
·
·
·
·4
1
.
3
.
5Col
ora
ndbr
owni
ngi
nde
x·
·
·
·
·
·
·
·
·
·
·
·
·
·
·
·
·
·
·
·
·
·
·
·
·
·
·
·
·
·
·
·
·
·
·
·
·
·
·
·
·
·
·
·
·5
1
.
4Me
as
ur
e
me
nt
off
l
ow pr
ope
r
t
i
e
soft
hepowde
r
s
·
·
·
·
·
·
·
·
·
·
·
·
·
·
·
·
·
·
·
·
·
·
·
·
·
·
·
·
·
·
·
·
·
·
·
·
·
·
·
·
·
·
·
·
·
·
·
·
·
·
·
·
·
·
·
·
·
·
·
·
·
·
·
·
·
·
·
·
·
·
·
·
·
·
·
·
·
·
·
·
·
·
·
·
·
·
·
·
·
·6
1
.
4
.
1Bul
k
de
ns
i
t
y·
·
·
·
·
·
·
·
·
·
·
·
·
·
·
·
·
·
·
·
·
·
·
·
·
·
·
·
·
·
·
·
·
·
·
·
·
·
·
·
·
·
·
·
·
·
·
·
·
·
·
·
·
·
·
·
·
·
·
·
·
·
·
·
·
·
·
·
·
·
·6
1
.
4
.
2Compac
t
i
onde
ns
i
t
y·
·
·
·
·
·
·
·
·
·
·
·
·
·
·
·
·
·
·
·
·
·
·
·
·
·
·
·
·
·
·
·
·
·
·
·
·
·
·
·
·
·
·
·
·
·
·
·
·
·
·
·
·
·
·
·
·
·8
1
.
4
.
3Haus
ne
rr
at
i
o·
·
·
·
·
·
·
·
·
·
·
·
·
·
·
·
·
·
·
·
·
·
·
·
·
·
·
·
·
·
·
·
·
·
·
·
·
·
·
·
·
·
·
·
·
·
·
·
·
·
·
·
·
·
·
·
·
·
·
·
·
·
·
·
·
·
·
·
·8
1
.
4
.
4Wa
t
e
rs
ol
ubi
l
i
t
yands
we
l
l
i
ngc
apa
c
i
t
y·
·
·
·
·
·
·
·
·
·
·
·
·
·
·
·
·
·
·
·
·
·8
1
.
4
.
5Hygr
os
c
opi
c
i
t
y·
·
·
·
·
·
·
·
·
·
·
·
·
·
·
·
·
·
·
·
·
·
·
·
·
·
·
·
·
·
·
·
·
·
·
·
·
·
·
·
·
·
·
·
·
·
·
·
·
·
·
·
·
·
·
·
·
·
·
·
·
·
·
·
·
·
·9
1
.
5St
at
i
s
t
i
c
a
la
nal
ys
i
s·
·
·
·
·
·
·
·
·
·
·
·
·
·
·
·
·
·
·
·
·
·
·
·
·
·
·
·
·
·
·
·
·
·
·
·
·
·
·
·
·
·
·
·
·
·
·
·
·
·
·
·
·
·
·
·
·
·
·
·
·
·
·
10
2.RESULTS AND DI
SCUSSI
ON·
·
·
·
·
·
·
·
·
·
·
·
·
·
·
·
·
·
·
·
·
·
·
·
·
·
·
·
·
·
·
·
·
·
·
·
·
·
·
·
10
2.
1Pr
e
pa
r
at
i
onofHal
l
a
bongpowde
r
s·
·
·
·
·
·
·
·
·
·
·
·
·
·
·
·
·
·
·
·
·
·
·
·
·
·
·
·
·
·
·
·
·
·
·
10
2
.
2Che
mi
c
a
lpr
ope
r
t
i
e
soft
hepowde
r
s·
·
·
·
·
·
·
·
·
·
·
·
·
·
·
·
·
·
·
·
·
·
·
·
·
·
·
·
·
·
·
·
13
2.
2
.
1pH,t
i
t
r
at
abl
ea
c
i
di
t
y,s
ol
ubl
e
-s
ol
i
ds
,andvi
t
ami
n
C·
·
·
·
·
·
·
·
·
·
·
·
·
·
·
·
·
·
·
·
·
·
·
·
·
·
·
·
·
·
·
·
·
·
·
·
·
·
·
·
·
·
·
·
·
·
·
·
·
·
·
·
·
·
·
·
·
·
·
·
·
·
·
·
·
·
·
·
·
·
·
·
·
·
·
·
·
·
·
·
·
·
·
·
·
·
·
·
·
·
·
13
2.
2
.
2Col
orandbr
owni
ngi
nde
x·
·
·
·
·
·
·
·
·
·
·
·
·
·
·
·
·
·
·
·
·
·
·
·
·
·
·
·
·
·
·
·
·
·
·
·
·
·
·
·
·
·
·
·
·
15
2
.
3Fl
ow pr
ope
r
t
i
e
soft
hepowde
r
s·
·
·
·
·
·
·
·
·
·
·
·
·
·
·
·
·
·
·
·
·
·
·
·
·
·
·
·
·
·
·
·
·
·
·
·
·
·
·
17
2.
3
.
1Bu
l
kde
ns
i
t
y·
·
·
·
·
·
·
·
·
·
·
·
·
·
·
·
·
·
·
·
·
·
·
·
·
·
·
·
·
·
·
·
·
·
·
·
·
·
·
·
·
·
·
·
·
·
·
·
·
·
·
·
·
·
·
·
·
·
·
·
·
·
·
·
·
·
·
·
·
·
17
2.
3
.
2Compac
t
i
onde
ns
i
t
y·
·
·
·
·
·
·
·
·
·
·
·
·
·
·
·
·
·
·
·
·
·
·
·
·
·
·
·
·
·
·
·
·
·
·
·
·
·
·
·
·
·
·
·
·
·
·
·
·
·
·
·
·
·
·
·
·
·
18
2.
3
.
3Haus
ne
rr
at
i
o·
·
·
·
·
·
·
·
·
·
·
·
·
·
·
·
·
·
·
·
·
·
·
·
·
·
·
·
·
·
·
·
·
·
·
·
·
·
·
·
·
·
·
·
·
·
·
·
·
·
·
·
·
·
·
·
·
·
·
·
·
·
·
·
·
·
·
·
18
2.
3
.
4Wat
e
rs
ol
ubi
l
i
t
yands
we
l
l
i
ngc
apac
i
t
y·
·
·
·
·
·
·
·
·
·
·
·
·
·
·
·
·
·
·
·
·
·
21
Par
tI
I
:Physi
cochemi
calPr
oper
t
i
esofCi
t
r
usHal
l
abong
Gr
anul
es
1.MATERI
ALS AND METHODS·
·
·
·
·
·
·
·
·
·
·
·
·
·
·
·
·
·
·
·
·
·
·
·
·
·
·
·
·
·
·
·
·
·
·
·
·
·
·
26
1
.
1Ma
t
e
r
i
al
sandc
he
mi
c
al
s·
·
·
·
·
·
·
·
·
·
·
·
·
·
·
·
·
·
·
·
·
·
·
·
·
·
·
·
·
·
·
·
·
·
·
·
·
·
·
·
·
·
·
·
·
·
·
·
·
·
·
·
26
1
.
2Pr
e
par
a
t
i
onofHa
l
l
abonggr
anul
e
s·
·
·
·
·
·
·
·
·
·
·
·
·
·
·
·
·
·
·
·
·
·
·
·
·
·
·
·
·
·
·
·
·
26
1
.
3Me
as
ur
e
me
ntofc
he
mi
c
a
lpr
ope
r
t
i
e
soft
hegr
anul
e
s
·
·
·
·
·
·
·
·
·
·
·
·
·
·
·
·
·
·
·
·
·
·
·
·
·
·
·
·
·
·
·
·
·
·
·
·
·
·
·
·
·
·
·
·
·
·
·
·
·
·
·
·
·
·
·
·
·
·
·
·
·
·
·
·
·
·
·
·
·
·
·
·
·
·
·
·
·
·
·
·
·
·
·
·
·
·
·
·
·
·
·
·
·
·
·
·
·
·
30
1
.
3
.
1Mo
i
s
t
ur
ec
ont
e
nt·
·
·
·
·
·
·
·
·
·
·
·
·
·
·
·
·
·
·
·
·
·
·
·
·
·
·
·
·
·
·
·
·
·
·
·
·
·
·
·
·
·
·
·
·
·
·
·
·
·
·
·
·
·
·
·
·
·
·
·
·
30
1
.
3
.
2Sol
ubl
e
-s
ol
i
ds·
·
·
·
·
·
·
·
·
·
·
·
·
·
·
·
·
·
·
·
·
·
·
·
·
·
·
·
·
·
·
·
·
·
·
·
·
·
·
·
·
·
·
·
·
·
·
·
·
·
·
·
·
·
·
·
·
·
·
·
·
·
·
·
·
·
·
30
1
.
3
.
3pH andt
i
t
r
at
a
bl
eac
i
di
t
y·
·
·
·
·
·
·
·
·
·
·
·
·
·
·
·
·
·
·
·
·
·
·
·
·
·
·
·
·
·
·
·
·
·
·
·
·
·
·
·
·
·
·
·
·
·
30
1
.
3
.
4Vi
t
ami
nC·
·
·
·
·
·
·
·
·
·
·
·
·
·
·
·
·
·
·
·
·
·
·
·
·
·
·
·
·
·
·
·
·
·
·
·
·
·
·
·
·
·
·
·
·
·
·
·
·
·
·
·
·
·
·
·
·
·
·
·
·
·
·
·
·
·
·
·
·
·
·
·
·
30
1
.
3
.
5Col
or ·
·
·
·
·
·
·
·
·
·
·
·
·
·
·
·
·
·
·
·
·
·
·
·
·
·
·
·
·
·
·
·
·
·
·
·
·
·
·
·
·
·
·
·
·
·
·
·
·
·
·
·
·
·
·
·
·
·
·
·
·
·
·
·
·
·
·
·
·
·
·
·
·
·
·
·
·
·
·
·
·
30
1
.
4Me
as
ur
e
me
ntoff
l
ow pr
ope
r
t
i
e
soft
hegr
a
nul
e
s
·
·
·
·
·
·
·
·
·
·
·
·
·
·
·
·
·
·
·
·
·
·
·
·
·
·
·
·
·
·
·
·
·
·
·
·
·
·
·
·
·
·
·
·
·
·
·
·
·
·
·
·
·
·
·
·
·
·
·
·
·
·
·
·
·
·
·
·
·
·
·
·
·
·
·
·
·
·
·
·
·
·
·
·
·
·
·
·
·
·
·
·
·
·
·
·
·
·
30
1
.
4
.
1Bul
kde
ns
i
t
y·
·
·
·
·
·
·
·
·
·
·
·
·
·
·
·
·
·
·
·
·
·
·
·
·
·
·
·
·
·
·
·
·
·
·
·
·
·
·
·
·
·
·
·
·
·
·
·
·
·
·
·
·
·
·
·
·
·
·
·
·
·
·
·
·
·
·
·
·
30
1
.
4
.
2Compac
t
i
onde
ns
i
t
y·
·
·
·
·
·
·
·
·
·
·
·
·
·
·
·
·
·
·
·
·
·
·
·
·
·
·
·
·
·
·
·
·
·
·
·
·
·
·
·
·
·
·
·
·
·
·
·
·
·
·
·
·
·
·
·
30
1
.
4
.
3Haus
ne
rr
at
i
o·
·
·
·
·
·
·
·
·
·
·
·
·
·
·
·
·
·
·
·
·
·
·
·
·
·
·
·
·
·
·
·
·
·
·
·
·
·
·
·
·
·
·
·
·
·
·
·
·
·
·
·
·
·
·
·
·
·
·
·
·
·
·
·
·
·
·
31
1
.
4
.
4Wa
t
e
rs
ol
ubi
l
i
t
yands
we
l
l
i
ngc
apa
c
i
t
y·
·
·
·
·
·
·
·
·
·
·
·
·
·
·
·
·
·
·
·
31
1
.
4
.
5Hygr
os
c
opi
c
i
t
y·
·
·
·
·
·
·
·
·
·
·
·
·
·
·
·
·
·
·
·
·
·
·
·
·
·
·
·
·
·
·
·
·
·
·
·
·
·
·
·
·
·
·
·
·
·
·
·
·
·
·
·
·
·
·
·
·
·
·
·
·
·
·
·
·
31
1
.
5Se
ns
or
ye
val
uat
i
onoft
hegr
a
nul
e
s·
·
·
·
·
·
·
·
·
·
·
·
·
·
·
·
·
·
·
·
·
·
·
·
·
·
·
·
·
·
·
·
31
2.RESULTS AND DI
SCUSSI
ON·
·
·
·
·
·
·
·
·
·
·
·
·
·
·
·
·
·
·
·
·
·
·
·
·
·
·
·
·
·
·
·
·
·
·
·
·
·
·
·
32
2.
1
.Phys
i
c
oc
he
mi
c
a
lpr
ope
r
t
i
e
sofHal
l
abonggr
a
nul
e
s·
·
·32
2
.
1
.
1Moi
s
t
ur
ec
ont
e
nt
,t
i
t
r
a
t
a
bl
eac
i
di
t
y,pH,s
ol
ubl
e
-s
ol
i
ds
,andvi
t
a
mi
nC·
·
·
·
·
·
·
·
·
·
·
·
·
·
·
·
·
·
·
·
·
·
·
·
·
·
·
·
·
·
·
·
·
·
·
·
·
·
·
·
·
·
·
·
·
·
·
·
·
·
·
·
34
2
.
1
.
2Col
or ·
·
·
·
·
·
·
·
·
·
·
·
·
·
·
·
·
·
·
·
·
·
·
·
·
·
·
·
·
·
·
·
·
·
·
·
·
·
·
·
·
·
·
·
·
·
·
·
·
·
·
·
·
·
·
·
·
·
·
·
·
·
·
·
·
·
·
·
·
·
·
·
·
·
·
·
·
·
·
·
36
2
.
1
.
3Fl
ow pr
ope
r
t
i
e
s ·
·
·
·
·
·
·
·
·
·
·
·
·
·
·
·
·
·
·
·
·
·
·
·
·
·
·
·
·
·
·
·
·
·
·
·
·
·
·
·
·
·
·
·
·
·
·
·
·
·
·
·
·
·
·
·
·
·
·
·
·
38
2
.
1
.
4Wat
e
rs
ol
ubi
l
i
t
ya
nds
we
l
l
i
ngc
apac
i
t
y·
·
·
·
·
·
·
·
·
·
·
·
·
·
·
·
·
·
·
·
38
2
.
1
.
5Hygr
os
c
opi
c
i
t
y·
·
·
·
·
·
·
·
·
·
·
·
·
·
·
·
·
·
·
·
·
·
·
·
·
·
·
·
·
·
·
·
·
·
·
·
·
·
·
·
·
·
·
·
·
·
·
·
·
·
·
·
·
·
·
·
·
·
·
·
·
·
·
·
38
2.
2Se
ns
or
ye
va
l
uat
i
onoft
hegr
anul
e
s ·
·
·
·
·
·
·
·
·
·
·
·
·
·
·
·
·
·
·
·
·
·
·
·
·
·
·
·
·
44
REFERENCES
·
·
·
·
·
·
·
·
·
·
·
·
·
·
·
·
·
·
·
·
·
·
·
·
·
·
·
·
·
·
·
·
·
·
·
·
·
·
·
·
·
·
·
·
·
·
·
·
·
·
·
·
·
·
·
·
·
·
·
·
·
·
·
·
·
·
·
·
·
·
·
·
·
·
·
·
·
·
·
·
·
·
·
·
·
·
·
·
·
·
·
·
4
7
요 약
제주산 한라봉의 과실과 착즙박을 열풍건조와 동결건조한 후 분말의 물리화학적 특성과 유동성을 측정하였다.또한 분말을 이용하여 과립을 제조한 후 시판제품 과 특성을 비교하였다. 건조 방법에 따른 한라봉 과실의 동결건조 수율은 20.0%,열풍건조 수율은 17.5% 이었다.또한 한라봉 착즙박의 동결건조 수율은 22.5%,열풍건조 수율은 22.0% 이었다. 한라봉 과실의 적정 산도는 동결건조 분말이 4.31~4.49%,열풍건조 분말이 4.4 2~5.12% 이었고,착즙박의 적정 산도는 동결건조 분말이 2.77~3.30%,열풍건조 분말이 3.00~3.41%를 나타내었다.한라봉 과실의 당도는 동결건조 분말과 열풍 건조 분말이 80°Brix이었고,착즙박은 동결건조 분말이 58~60°Brix,열풍건조 분말이 55~58°Brix를 나타내었다.한라봉 과실의 비타민 C 함량은 동결건조 분 말(220.8~364.7 mg/100g)이 열풍건조 분말(80.1~114.6 mg/100g)보다 높았다. 착즙박의 비타민 C 함량은 동결건조 분말이 62.7~89.5% mg/100g인 반면 열풍 건조 분말에서는 검출되지 않았다.색도는 L값과 b값이 한라봉 동결건조 과실과 착즙박 분말 모두 열풍건조 분말에 비해 높았으나,a값은 열풍건조 분말이 동결 건조 분말에 비해 높았다.갈변도는 한라봉 과실과 착즙박 모두 동결건조 분말이 열풍건조 분말에 비해 유의적으로 낮았다. 분말의 유동적 특성에서 겉보기 밀도,다짐 밀도와 hausnerratio는 한라봉 과실 과 착즙박 분말 모두 열풍건조가 동결건조보다 유의적으로 높았다.용해성과 흡 습성은 한라봉 과실과 착즙박 분말에서 동결건조가 열풍건조보다 높았다.그러나 팽윤력은 한라봉 과실과 착즙박 분말에서 열풍건조가 동결건조보다 높았다.물리화학적 특성과 유동적 특성이 우수한 한라봉 동결건조 착즙박 분말(입자크 기 180~250μm)을 이용하여 한라봉 과립을 제조하였다. 한라봉 과립의 배합비율은 동결건조 착즙박을 10%,유동층건조 주스(10%)분말 을 70%,첨가물을 6.92%로 고정하였고,주스와 구연산 첨가량을 달리하여 세가 지 종류의 과립 즉,J10C3(주스 10.0%,구연산 3.08%),J08C4(주스 8.75%,구연 산 4.33%),J07C5(주스 7.50%,구연산 5.58%)를 제조하였다. 한라봉 과립의 수분 함량은 5.08~5.44%이었고,시판 제품은 2.39%이었다.적정 산도는 한라봉 과립이 4.35~5.88%이었고,시판 제품은 10.3%이었다.pH는 한라 봉 과립이 2.54~2.70이었고,시판 제품은 2.59이었다.당도는 한라봉 과립이 90~ 98 °Brix이었고,시판 제품은 100 °Brix이었다.당산비는 한라봉 과립이 15.3~ 22.5이었으며,시판 제품은 9.7이었다.비타민 C 함량은 한라봉 과립이 1.22~1.60 g/100g이었고,시판 제품은 9.31g/100g이었다. 유동적 특성으로서,겉보기 밀도는 J10C3,J08C4와 J07C5이 각각 0.541,0.580, 0.660 g/mL으로서,J10C3는 시판 제품(0.549 g/mL)과 유사하였다.다짐 밀도는 J10C3,J08C4와 J07C5이 각각 0.561,0.603,0.689g/mL으로서,J08C4는 시판 제 품(0.616 g/mL)과 유사하였다.Hausnerratio는 J10C3,J08C4와 J07C5이 각각 0.964,0.962,0.957으로 시판 제품(0.892)보다 모두 높았는데,이로보아 시판제품 이 한라봉 과립에 비해 유동성이 유의적으로 우수하였다.용해성은 J10C3,J08C4 와 J07C5이 각각 72.0,66.7%,66.6%으로 시판제품(75.6%)보다 낮았다.팽윤력은 J10C3,J08C4와 J07C5이 각각 3.84,5.42,6.40 g/g으로 시판제품(3.47 g/g)보다 모두 높았다.흡습성은 J10C3이 가장 높았으며,다음으로 J08C4,그 다음으로 J07C5순이었고,시판제품이 가장 낮았다. 한라봉 과립과 시판 제품의 관능검사 결과 color, sweetness와 overall acceptance는 유의적으로 차이가 없었으나,flavor와 bitterness는 시판 제품이 과 립에 비해 선도호가 유의적으로 높았다.
결론적으로 한라봉 동결건조 착즙박과 유동층건조 주스를 이용하면 물리화학적 특성과 유동적 특성이 우수한 분말과 과립을 제조할 수 있을 것으로 기대되며, 비상품 한라봉을 가공함으로써 한라봉 생과의 적정가격을 유지하는데도 기여할 것으로 생각된다.
Li
stofFi
gur
es
Fig.1. Apparatusformeasuringthebulkdensity.
Fig.2. Hygroscopicitywithelapsedtimeof(A)wholefruitpowdersand (B)pressedcakepowderswithdifferentdryingmethods
Fig.3. Preparationmethodofthegranules.
Fig.4. Hygroscopicitywith elapsed timeofHallabog granules (J10C3, J08C4andJ07C5)andCommercialproduct(CP)
Li
stofTabl
es
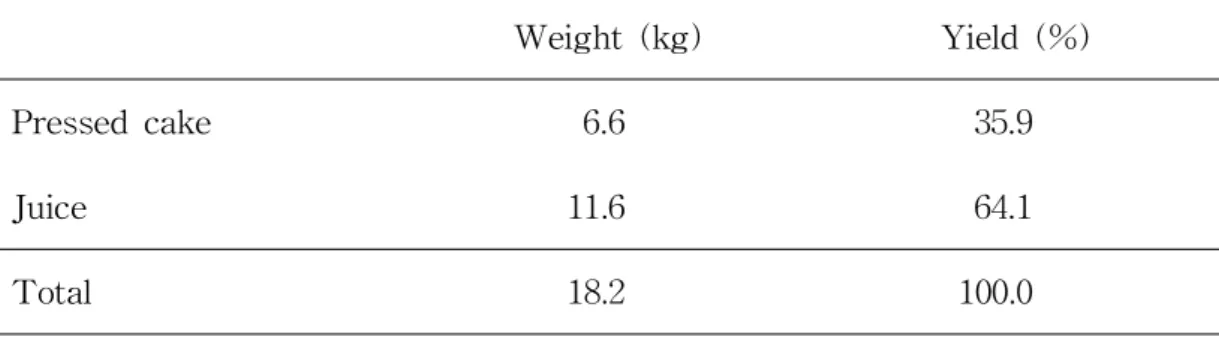
Table1. Yieldofpressedcakeandjuicefrom Hallabong
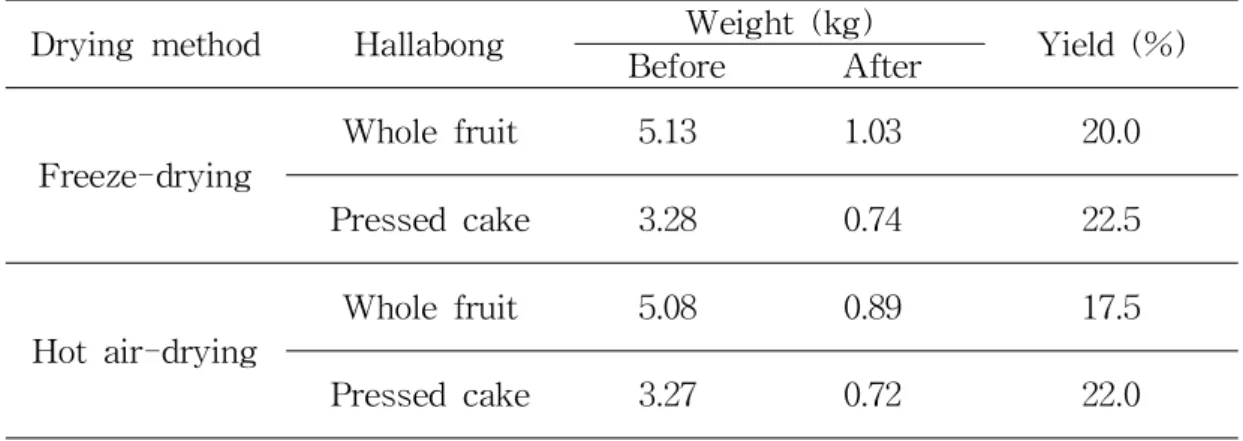
Table2. Yieldsofthepowdersfrom wholefruitandpressedcakefrom Hallabong
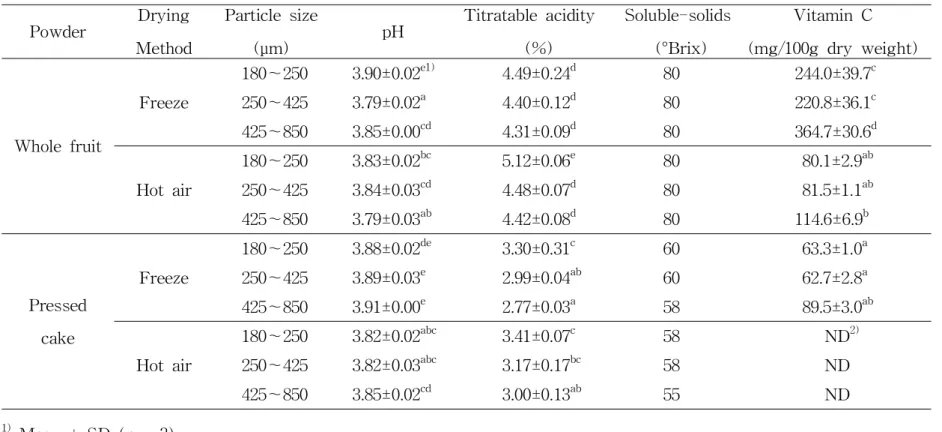
Table3. pH, titratable acidity, soluble-solids, and vitamin C of Hallabongpowderswithdifferentdryingmethods
Table4. Colorandbrowning index ofHallabong powderswithdifferent dryingmethods
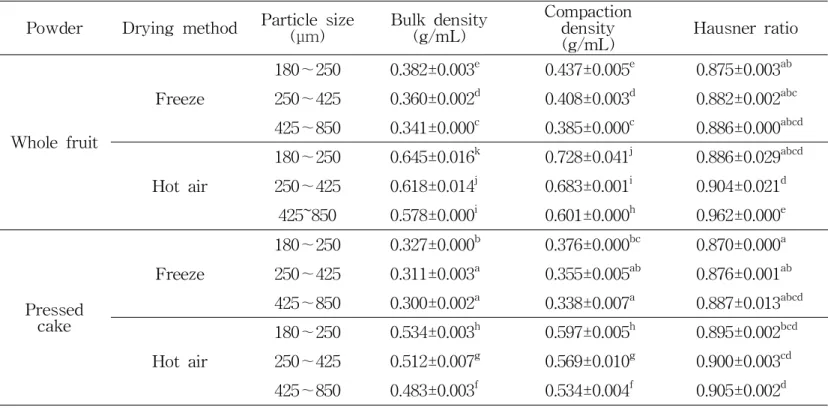
Table5. Flow properties of Hallabong powders with different drying methods
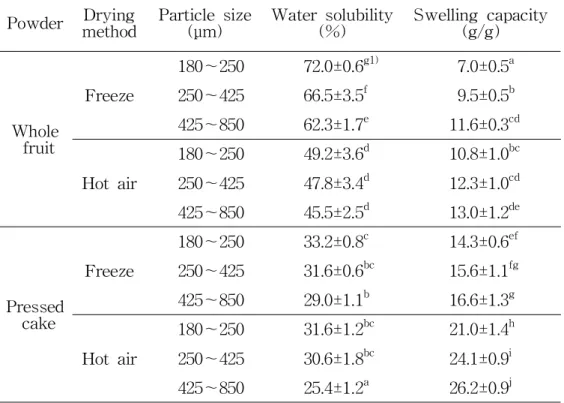
Table6. Watersolubility and swelling capacity ofHallabong powders withdifferentdryingmethods
Table7. Hygroscopicity withelapsedtime ofHallabong powders with differentdryingmethods
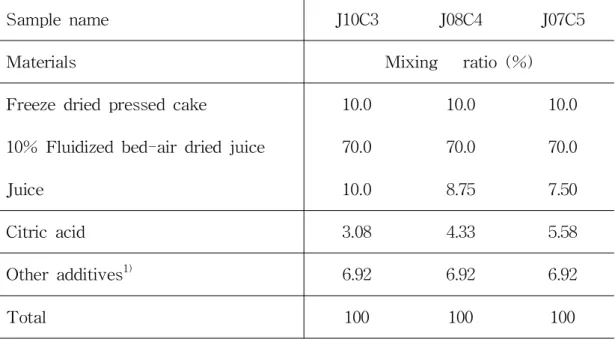
Table8. The mixing ratio for preparation of the granules drying methods
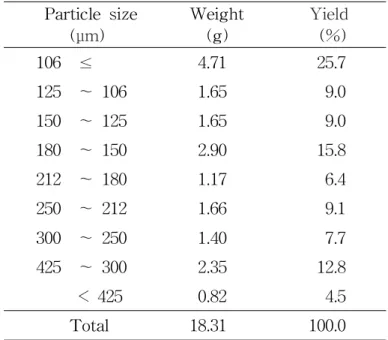
Table9. Particledistributionofacommercialproduct
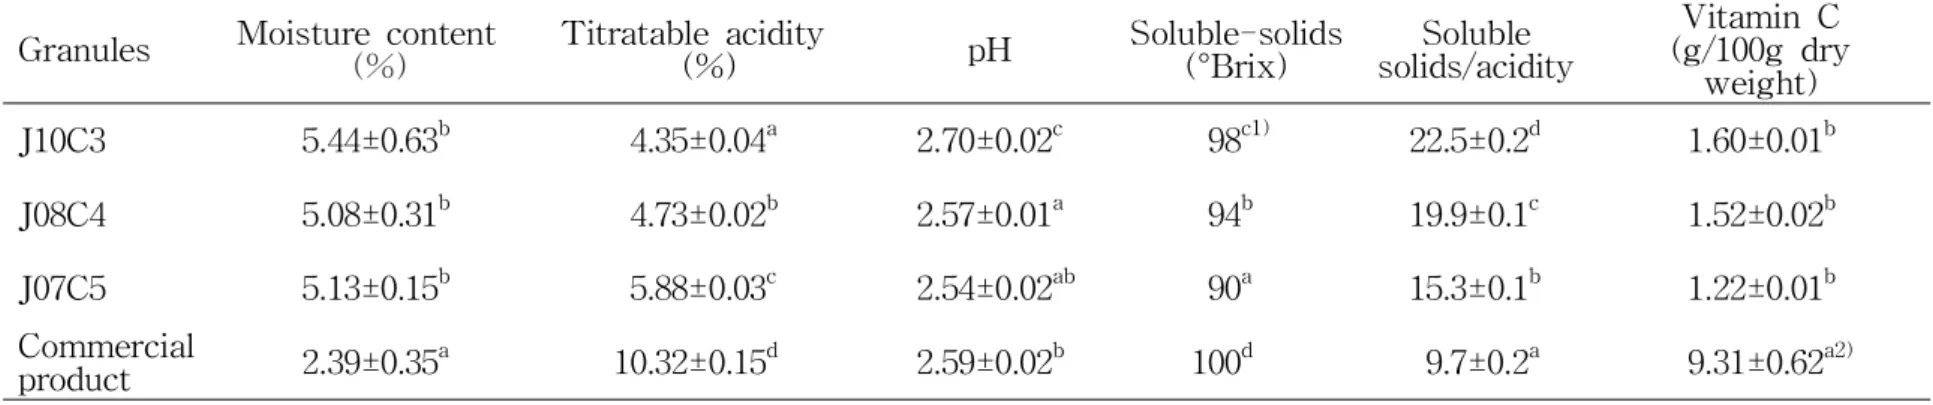
Table10. Moisture content, titratable acidity, pH, soluble-solids, and vitaminC ofHallabonggranules
Table11. ColorofHallabonggranules
Table13. WatersolubilityandswellingcapacityofHallabonggranules Table14. HygroscopicitywithelapsedtimeofHallabonggranules Table15. SensoryattributesofHallabonggranules
ABSTRACT
Citrus "Hallabong" powders were prepared using hotairand freeze drying methods,and theirphysicochemicaland flow properties were measured.The yields ofthe powders from wholefruitand pressed cakeby hotairdrying method were 17.5% and 22.0%,while those by freeze drying method were 20.0% and22.5%,respectively.
VitaminC washighinfreeze-driedwholefruitpowders(220.8~364.7mg/100 g) compared with those in hot air-dried ones (80.1~114.6 mg/100 g). Browning index offreeze-driedpowderswassignificantlylowerthanthoseof hotair-driedones.
Bulk densities,compaction densities,and Hausnerratios ofboth whole fruit andpressed cakepowdersweresignificantly higherin hotairdrying method compared with freeze drying method.Watersolubilities and hygroscopicities offreeze-driedwholefruitandpressedcakepowderswerehigherthan those ofhotair-dried ones.In conclusion,Hallabong powders can be made using freezedryingmethodwithgoodphysicochemicalandflow properties.
Threetypes(J10C3, J08C4,J07C5)ofHallabonggranuleswerepreparedwith
thepowdersoffreeze dried pressed cakesand fluidized bed-airdried juices atdifferentmixing ratios,andtheirphysicochemicalpropertieswerecompared
with the targeted commercial product. The soluble solids of Hallabong
granuleswereslightly lowerthan thatofthecommercialproduct.Hallabong
granules were abouttwo times lowerin titratable acidity than thatofthe
commercialproduct.pH of commercialproduct was in the middle of the
high.VitaminC inHallabonggranuleswereabout6timeslowerthanthatof
commercialproduct.Bulkandcompactiondensity ofcommercialproductwere
in the middle ofthe Hallabong granules.However,hausnerratios ofthree
granuleswerehigherthan thatofcommercialproduct.J10C3wassimilarto
commercialproductin water solubility and swelling capacity.The granule
similarto commercialproductin terms ofhygroscopicity was J07C5.J10C3
and J08C4 was notsignificantly different from the commercialproduct in color,sweetness,andoverallacceptance.Inconclusion,Hallabong granuleswe madewerenotsignificantlydifferentcomparedwithcommercialproduct.
I
NTRODUCTI
ON
Citrus"Hallabong"isahybrid between Kiyomi(Citruskiyomi)and ponkan (C. reticulata),developedinJapanin1972.OnceHallabong wasintroducedin Korea intheearly1990s,itwascalledasanameofDekoponorShiranuhi.Afterthen, Dekopon was called “Hallabong”named afterHallasan the mountain located in Jeju-do,whereitisprimarily grown since1998(Song etal.,2005;Kim etal.,
2006).
Hallabong is distinctive due to its sweet taste, large size, and the large protruding bump on the top of the fruit.Cultivation area and production of Hallabong havebeenrapidlyincreasedfrom 134haand841tonin1998to1,188 ha and 22,199 ton in 2008,respectively because the consumerprefers its taste and flavor (Kim etal.,2006).Hallabong is second to Satsuma mandarin in productioninJeju.OverproductionofHallabong maycausethedropintheprice ofthefresh fruit.So,weneed tofind theway ofprocessing theoverproduced fruits.
There have been several studies about Hallabong such as physicochemical propertiesforvolatileflavorproperties(Songetal.,2005),qualitystandardization (Kim et al., 2006),and quality change during storage (Lee et al., 2007b). However,theprocessingofHallabonghasnotbeenreported.
One ofthe processing methods to make food sub-materials is the drying for making apowder.Themajorfactortochoosethedrying methodisthequality ofdehydratedproduct.Air-drying isvery oldestprocessusedtopreservefoods. Advantageofair-drying can extendashelflifeofaproductasaresultofthe drying of foodstuffs by high temperature at a low expense. However, disadvantage is to cause the quality deterioration than that of the original foodstuff.Freezedrying istheprocessofremoving themoistureby sublimation
of a frozen product. Advantage of freeze drying can prevent the quality deteriorationandmicrobiologicalreactions.Anditcanmaintainthestructureand theshapeoftheoriginalproductbyminimizing thevolumereduction.Despiteof theseadvantages,freezedrying isthemostexpensiveprocessformanufacturing adriedproduct(Garauetal.,2006;Ratti,2001).
Fluidized bed-air drying is a process to transfer heat and materials
simultaneously.Theairissentin thefluidized bed-dryerand then theparticle is floated by the drag.Because ofthe advantage to rapidly increase the heat and materials transfer,ituses widely in the food and petrochemicalindustries
(Davidson and Harrison,1971).Fluidized bedsofferadvantagessuch as:(i)the
fluidity ofthe bed facilitating easy handling and transportofsolids,(ii)high heatandmasstransferrates,(iii)perfectmixingofmaterialinthebed,and(iv) the possibility ofapplying othersources ofenergy such as immersed heating coils,etc(Srinivasakannan and Balasubramanian,2008).Fluidizedbed-airdrying is very effective to decrease loss of the nutrients and increase the drying velocity atlow temperature.Particularly,itisvery effectiveto dry thepowder
anditusesattheflourmillandthepharmaceuticalindustry(Lee,2006).
Food powders can be made afterthe drying process.In orderto produce the good quality of food powders,there is a need for information about their handling and processing characteristics.Thephysicalpropertiesofpowders are important because they affect its behavior during storage, handling, and processing.The changes in the particle shapes can occur during handling or storage as a result of moisture absorption,chemicalreactions or mechanical attrition.The hygroscopicity can be affected by the type offood,ingredients, shape,andsize,etc(Schubert,1987;Peleg,1983;Koetal.,1999).
The objective of this study was to measure the physicochemicaland flow
propertiesofHallabong powdersand granulesprepared with hotairand freeze
Par
tⅠ
Physi
cochemi
calPr
oper
t
i
esofCi
t
r
usHal
l
abong Powder
s
1.Materialsandmethods 1.1.Materialsandchemicals
Citrus“Hallabong”waspurchased from thelocalmarketin Jeju,Korea.Itwas stored at 4℃ until needed.Meta-phosphoric solution, acetonitrile, and monopotassium phosphate were obtained from Sigma ChemicalCo.(St.Louis, MO,USA).Hydrochloric acid was obtained from JunseiChemicalCo.(Tokyo, Japan).
1.2.PreparationofHallabongpowders
Hallabong powders were prepared by two differentdrying methods as freeze andhotairdryingasfollows.Hallabongwaswashedandcleaned.Thenpressed cake and juice were obtained by the pulverization-screw press type juice extractor(#HCM-12,500,Hansung Pulverizing MachineCo.LTD.,Korea).Whole fruitandpressedcakeweredriedby using hotairdrying methodat60±1℃ for 96 hr.They were also frozen by deep freezerat–70±1℃ for24 hrand then
driedfor72hrbyfreezedryer(PVTFD101A,Hucom systems,Korea).
The powders weremadeby a chopper(HR1396,Philips Co.,Istanbul,Turkey) and sorted according to theparticlesizeas180~250μm,250~425μm,and 42 5~850 μm using a standard sieve (Chunggyesanggongsa,Seoul,Korea).The powdersampleswereputin acontainerwhich wasincluded alithium chloride saturated solution (relativehumidity:11%)to adjustthesamemoisturecontent (Kim etal.,2007)andstoredattherefrigerator(4℃)untilused.
1.3.Measurementofchemicalpropertiesofthepowders 1.3.1.Moisturecontent
Moisturecontentwasmeasuredusingairovenmethodat105℃ (AOAC,2000).
1.3.2.Soluble-solids
Thepowders(5 g)weredissolved in a 45mL distilled water,and thesoluble solid wasmeasuredby using ahand-held refractometer(0∼32%,Atago,Japan) andmultipliedbythedilutionratio.
1.3.3.pH andtitratableacidity
The pH value ofthe powders was determined by blending 1 g ofthe sample with 10 mL distilled water,using the pH meter (SevenEasy,Mettler Toledo, Switzerland)calibratedwithstandardbuffersatpH 4and7.
Titratableacidityofthepowderswasmeasuredasfollows(KIFA,2006).1g of thepowderswasdilutedto100mL withdistilledwaterina250mL beaker.0.5 mL ofphenolphthaleinindicatorwasadded,andtitrationwasperformedwith0.1 N NaOH solution.Titratableacidityofthepowderswascalculatedasfollows: Titratableacidity(%,asacitricacid)={(A xF x0.0064)/sampleweight(g)}x 100
A:consumptions(mL)of0.1N NaOH solution F:afactorof0.1N NaOH solution
Firstofall,vitamin C wasextractedfrom thepowdersby themodifiedmethod ofRizzoloetal.(1984)asfollows.A portionof0.5g ofthepowderswasadded to 50 mL of6% meta-phosphoricsolution.The mixturewas homogenized and centrifuged at6,000 g force at4℃ for10 min.The supernatantwas filtered throughasyringefilterandSep-PakC18cartridge.
The contentofvitamin C in the sample was measured by the HPLC system
(Waters 2695,MA,USA) using the method of Albrecht et al.(1990).The
analyticalcolumn used was a μBondapakTM NH2 (3.9 x 300 mm,10 μm,
Waters,Ireland).The mobile phase used was 5 mM KH2PO4 (pH 4.6) and
acetonitrile (30:70).The flow rate and the wavelength ofthe analysis were 1 mL/minand254nm.
1.3.5.Colorandbrowningindex
Colorwasmeasured using aChromameter(CR-300Series,Minolta Co.,Osaka, Japan) (ASTM Committee,1975).The color was expressed using CIE Lab coordinateswhereL representsthelightness,atherednessorgreenness,andb thebluenessoryellowness.Totalcolordifference(△E)wascalculatedusingthe followingequation:
△E =
Thestandardcolorvalue(L096.98,a00.19,b01.95)wasused.
Browning index wasmeasured by themodified method ofKim etal.(2009)as follows.The powders (0.5 g)were suspended with 10 mL distilled water,and then theclearsupernatantwasobtainedafterthecentrifugationat5,000g force for10min.Theopticaldensityofthesupernatantwasmeasuredimmediatelyat
420nm againstthedistilledwaterasablankusingaUV-Visspectrophotometer (MQX 200,μQuant,Bio-TekInstruments,Inc.,Korea).
1.4.Measurementofflow propertiesofthepowders
Flow properties ofthe powders such as bulk density,compaction density,and hausnerratio were measured and calculated by using the modified method of Peleg(1983)andShin(2009).
1.4.1.Bulkdensity
The bulk density ofthe powders was calculated from its mass and volume. First,a 100mL messcylinderwasplaced in theelectronicbalance(TypeAX 200,Shimadzu Co.,Japan),and a funnel(75mm x 140 mm)wasfixed in the stand abovethecylinderasshown in Fig.1.Thepowderswereslowly putin thefunneluntiltheweightofthepowdersbecameabout15g in thecylinder. Then,the volume of the powders was read,and the bulk density of the powderswascalculatedasfollows:
Bulkdensity(g/mL)=(A/B) A:weightofthepowders(g) B:volumeofthepowders(mL)
Fig.1.Apparatusformeasuringthebulkdensity.
1.4.2.Compactiondensity
The cylinderwith the powders measured the bulk density above wasvibrated with ReciproShaker(RS-1,JeioTec,Korea)for1min at300rpm.Afterthat, the volume ofthe powders was read.The compaction density ofthe powders wascalculatedasfollows:
Compactiondensity(g/mL)=(A/B) A:weightofthepowders(g) B:volumeofthepowders(mL) 1.4.3.Hausnerratio
The"Hausnerratio"isdefinedastheratiobetweencompactiondensityandbulk density (Hausner,1967).This"Hausnerratio"could beusedasaflow property index of the powders (Gray and Beddow,1968/9).The Hausner ratio was calculatedasfollows:
Hausnerratio(%)=(A/B)
A:Bulkdensityofthepowders(g/mL)
B:Compactiondensityofthepowders(g/mL) 1.4.4.Watersolubilityandswellingcapacity
Watersolubility and swelling capacity weremeasured by themodified methods of Dubois et al.(1956) and Leach et al.(1959).The powders (0.1 g) and distilledwater(10mL)wereputintothe50mL conicaltubeandmixedevenly. Afterthe conicaltube was placed into the waterbath for30 min at60℃,it
wascooledusing coldwaterfor3min.Andthen,itwascentrifugedfor10min
at5,000g force,andthesupernatantwasseparatedby decanting.Theswelling
capacity was calculated from the weight of precipitate. Meanwhile, the supernatantwasdriedat105℃ for3hr,andthewatersolubilitywascalculated from theweightofthesupernatant.
Watersolubility(%)=(B/A)x100 A:weightofthepowders(g)
B:weightofthedriedsupernatant(g)
Swellingcapacity(g/g)=[C/{A x(100-%watersolubility)}]x100 A:weightofthepowders(g)
C:weightoftheswollenpowders(g) 1.4.5.Hygroscopicity
Hygroscopicity was determined according to the modified method ofChung et
al.(2005).The powders (approximately 0.5 g) were put into a humidified containerandplacedinanincubatorwherebecomessetting with20℃.Moisture contentofthepowderswasweighedeveryhourfor7hr.Hygroscopicity ofthe powderswascalculatedasfollows:
Hygroscopicity(%)={(A -B)/B}x100 A:weightofthepowders(g)
1.5.Statisticalanalysis
Experimentalresults are expressed as the mean ± SD.The experimentaldata was analyzed by using the statistical package for social scientists (SPSS) version 12.0 (SPSS,Inc.,Chicago,IL,USA).Significant difference from the respectivecontrolsforeach experimentwastested using theDuncan'sMultiple Range Test(DMRT).A p-value <0.05 was considered statistically significant.
Allexperimentswereperformedthreetimes.
2.Resultsanddiscussion
2.1.PreparationofHallabongpowders
Hallabong was squeezed through a pulverization-screw press type juice extractor. The yields of pressed cake and juice were 35.9% and 64.1%, respectively (Table 1).Korea Food Research Institute (1998)reported thatthe yield ofjuice from Satsuma mandarin (C.unshiu Marc.)was 70.5% using an experimentjuiceextractor,and thejuiceyield ofHallabong waslow than that ofSatsumamandarin.
Theyieldsofthepowdersfrom wholefruitand pressed cakeby freeze-drying method were 20.0% and 22.5%,respectively,while by hotair-drying method thosewere17.5% and 22.0%,respectively (Table2).Ourresultwassimilarto
thereportofKim etal.(2006),saying thattheyieldofthepowderswholefruit
Table1.Yieldofpressedcakeandjuicefrom Hallabong Weight(kg) Yield(%) Pressedcake 6.6 35.9 Juice 11.6 64.1 Total 18.2 100.0
Table 2. Yields of the powders from whole fruit and pressed cake from Hallabong
Dryingmethod Hallabong Weight(kg) Yield(%) Before After Freeze-drying Wholefruit 5.13 1.03 20.0 Pressedcake 3.28 0.74 22.5 Hotair-drying Wholefruit 5.08 0.89 17.5 Pressedcake 3.27 0.72 22.0
2.2.Chemicalpropertiesofthepowders
2.2.1.pH,titratableacidity,soluble-solidsandvitaminC
pH ofthepowderswasnotsignificantly differentregardlessofdrying methods andparticlesizes.pH wasintherangeof3.79~3.90.
Titratableaciditywashighinthepowdersofwholefruit(4.3~5.12%)compared with those in pressed cake (2.77~3.41%)because the juices were included in whole fruit which contained more organic acids. However, it was not significantlydifferentwithdryingmethods.
Soluble-solids ofthe powders from whole fruitwere 80 °Brix,while those of pressed cake were in the range of 55~60 °Brix (Table 3). It was not significantlydifferentwithdryingmethodsandparticlesizes.
VitaminC washighinfreeze-driedwholefruitpowders(220.8~364.7mg/100g) comparedwiththatinhotair-driedones(80.1~114.6mg/100g)becauseitwas decomposedathightemperatureinhotair-dryingmethod.VitaminC wasinthe rage of 62.7~89.5 mg/100 g in freeze-dried pressed cake powders,but not detected in hot air-dried ones.Kayaa et al.(2010) also reported that the destructionofvitaminC increasedwithincreasingdryingairtemperature.
Vitamin C waslow with thedecreaseoftheparticlesizeasshownin Table4. Whenthesurfaceareawhichisexposedtoairwasincreased,lossofvitaminC also increased.The loss ofvitamin C was increased depending on the rate of the oxygen in the air (Erenturk etal.,2005).Consequently,contents ofthe vitaminC canbedecreasedwithdecreaseinparticlesize.
Table3.pH,titratableacidity,soluble-solids,andvitaminC ofHallabongpowderswithdifferentdryingmethods Powder Drying Method Particlesize (μm) pH Titratableacidity (%) Soluble-solids (°Brix) VitaminC (mg/100gdryweight) Wholefruit Freeze 180~250 3.90±0.02e1) 4.49±0.24d 80 244.0±39.7c 250~425 3.79±0.02a 4.40±0.12d 80 220.8±36.1c 425~850 3.85±0.00cd 4.31±0.09d 80 364.7±30.6d Hotair 180~250 3.83±0.02bc 5.12±0.06e 80 80.1±2.9ab 250~425 3.84±0.03cd 4.48±0.07d 80 81.5±1.1ab 425~850 3.79±0.03ab 4.42±0.08d 80 114.6±6.9b Pressed cake Freeze 180~250 3.88±0.02de 3.30±0.31c 60 63.3±1.0a 250~425 3.89±0.03e 2.99±0.04ab 60 62.7±2.8a 425~850 3.91±0.00e 2.77±0.03a 58 89.5±3.0ab Hotair 180~250 3.82±0.02abc 3.41±0.07c 58 ND2) 250~425 3.82±0.03abc 3.17±0.17bc 58 ND 425~850 3.85±0.02cd 3.00±0.13ab 55 ND 1)Mean± SD (n=3).
a-e)ValueswithdifferentlettersinthecolumnaresignificantlydifferentaccordingtoDuncan'smultiplerangetest(p<0.05). 2)ND:notdetected
2.2.2Colorandbrowningindex
Table 4 shows the color of the powders.L values were high in the freeze-dried powders compared with those in hotair-dried ones in both of
wholefruitandpressedcake.However,avaluesshowedoppositetendency.b
valueswerehigherinfreeze-driedpowdersthanhotair-driedones.Thiscan
be happen due to the thermaldegradation by high temperature in hotair
drying.Infruitsandvegetables,L andavaluesin colorcan beusedforthe
evaluation ofbrowning degree,and lowerL and highera values show that
they are browning (Castaneretal.,1999;Chung etal.,2009;Wang etal.,
2010).
Browning index offreeze-driedpowderswassignificantlylowerthanthoseof
hot air-dried ones as shown in Table 4. High browning index of hot
air-dried powderscan becaused by degradation ofcolordueto high drying
Table4.ColorandbrowningindexofHallabongpowderswithdifferentdryingmethods
Powder MeDryithodng Parsitziecle (μm) Color Browning Index L2) a b △E Whole Fruit Freeze 180~250 83.47±0.24f1) 2.19±0.16bc 68.71±0.19j 68.1±0.2g 0.363±0.017e 250~425 75.20±1.33d 3.71±0.76d 66.44±2.50i 68.2±2.1g 0.251±0.008c 425~850 74.86±2.57d 6.83±0.97f 64.35±0.65h 66.6±0.9g 0.227±0.003c Hotair 180~250 78.42±1.61e 3.22±0.98cd 45.95±1.90f 47.9±2.4bc 0.501±0.015f 250~425 76.22±0.86de 3.93±0.30d 43.66±0.72e 46.7±1.0b 0.477±0.032f 425~850 68.58±1.26c 6.88±0.69f 40.46±1.23d 48.3±1.8bc 0.383±0.014e Pressed cake Freeze 180~250 85.91±1.46f -1.26±0.15a 49.20±0.28g 48.6±0.6bc 0.163±0.023b 250~425 83.49±0.24f 1.62±0.25b 51.29±0.37g 51.2±0.4de 0.127±0.005a 425~850 77.37±1.49de 5.13±1.18e 50.18±1.86g 52.3±2.3e 0.152±0.007ab Hotair 180~250 70.56±0.43c 7.34±0.18f 36.62±0.07c 44.2±0.3a 0.289±0.013d 250~425 60.51±1.44b 10.90±0.69g 33.83±0.67b 49.6±0.9cd 0.318±0.038d 425~850 49.56±1.69a 12.85±0.55h 27.82±1.12a 55.5±0.8f 0.303±0.006d 1)Mean± SD (
n=3
).2.3.Flow propertiesofthepowders
2.3.1.Bulkdensity
Table 5 shows the bulk densities of the powders with different drying
methods.Bulk densitiesofboth whole fruitand pressed cake powderswere
significantly higher in hotair drying method compared with freeze drying
method.Thiswasdueto thedifferencein theporesofthepowdersformed
during a drying process.Itwas known thatthe porosity ofhotair-dried
powders become smaller due to the surface hardening and the shrinkage,
whilethatoffreeze-driedpowdersbecomeslargerbecausetheparticleshape
offreeze-dried powders maintained the originalform by the sublimation of theicedistributed uniformly within theparticlesby quick freezing (Leeand
Kim,2001).
Withthesamedrying method,bulkdensitiesofthepowdersfrom wholefruit
were significantly higherthan those ofpressed cake.This was due to the solidcompositionwherethesoluble-solidswere80°Brix and55~60°Brix in the whole fruitand pressed cake,respectively (Table 4).Peleg (1983)also reported that the bulk density of the powders was affected by the solid composition.
With the same materialand the same drying method,bulk densities were
increased with the decrease ofthe particle size due to the decrease ofthe void volumebetween theparticles(Lam etal.,2008;Littlefield etal.,2011).
Peleg (1983)reported thatbulk density ofmostfood powders was in the
rangeof0.3~0.8g/mL.Inthisstudy,bulkdensityofHallabong powderswas
2.3.2.Compactiondensity
Table 5 also shows the compaction densities ofthe powders with different
drying methods.Compaction densities showed similar tendency with bulk
densities.Compaction densitiesofthepowdersfrom wholefruitand pressed cakein hotairdrying method weresignificantly higherthan thoseoffreeze drying method. This result would be that the structure of freeze-dried particles was noteasily collapsed during tapping because the powders by
freezedrying methodmaintainedalmosttheoriginalform.Ontheotherhand,
hot air-dried particles were filled with void spaces and could be easily
collapsedduringtapping(LeeandKim,2001).
With the same drying method,compaction densities ofwhole fruitpowders
were significantly higher than those ofpressed cake powders.This result
would also be because the chemicalcomposition of powders is different
betweenwholefruitandpressedcake.
Compactiondensitiesofwholefruitandpressedcakepowderswereincreased
with the decrease ofthe particle size.As the particle size decreased,the smallerparticlewasabletofillthevoidspaceduring tapping.Therefore,the powdersofsmallparticlesizeshowed high compaction density (Littlefield et al.,2011).
2.3.3.Hausnerratio
Table 5 also shows Hausner ratios of the powders with different drying
methods.Hausner ratios also showed similar tendency with bulk densities.
Hausnerratiosofthepowdersfrom freeze-driedwholefruitandpressedcake
volume change by the externalimpactorvibration in freeze-dried powders
was smalland in a stable condition.Also,thatwas due to smallinternal
frictionforceofparticles(Leeetal.,1993).
Hausnerratiowasdecreasedwith thedecreaseoftheparticlesize.Thiswas
because the decrease of the particle size of the powders increased the cohesivity by thevan derWaalsforcesandtheinterparticleforces(Abdullah