저작자표시-비영리-변경금지 2.0 대한민국 이용자는 아래의 조건을 따르는 경우에 한하여 자유롭게 l 이 저작물을 복제, 배포, 전송, 전시, 공연 및 방송할 수 있습니다. 다음과 같은 조건을 따라야 합니다: l 귀하는, 이 저작물의 재이용이나 배포의 경우, 이 저작물에 적용된 이용허락조건 을 명확하게 나타내어야 합니다. l 저작권자로부터 별도의 허가를 받으면 이러한 조건들은 적용되지 않습니다. 저작권법에 따른 이용자의 권리는 위의 내용에 의하여 영향을 받지 않습니다. 이것은 이용허락규약(Legal Code)을 이해하기 쉽게 요약한 것입니다. Disclaimer 저작자표시. 귀하는 원저작자를 표시하여야 합니다. 비영리. 귀하는 이 저작물을 영리 목적으로 이용할 수 없습니다. 변경금지. 귀하는 이 저작물을 개작, 변형 또는 가공할 수 없습니다.
Study for Doctoral Thesis
Determinants of Information Technology
Assimilation in the Dairy Industry
-An Exploratory Perspective-
낙농업에서 정보 기술 적용의
결정 요인에 관한 연구
-
탐색적 고찰 -
August 2012
서울대학교 대학원
농경제사회학부 지역정보전공
Ronald S. Berger
Determinants of Information Technology
Assimilation in the Dairy Industry
-An Exploratory Perspective-
낙농업에서 정보 기술 적용의
결정 요인에 관한 연구
-
탐색적 고찰 -
Advisor: Professor Young Chan Choe
Submitting a Doctoral Thesis of Economics
August 2012
서울대학교 대학원
농경제사회학부 지역정보전공
Confirming the Doctoral Thesis Written by
Ronald S. Berger
August 2012
Chair (Seal)
Vice Chair (Seal)
Examiner
(Seal)
Examiner
(Seal)
Examiner
(Seal)
Abstract
Determinants of Information Technology
Assimilation in the Dairy Industry
-An Exploratory Perspective-
Ronald S. Berger
Regional Information
Department of Agricultural Economics and Rural Development
Graduate School
Seoul National University
Information management in the dairy industry is more complex because of the intensification of information systems and the increase in knowledge about animal management, consumer demand for higher quality products, and government regulations. Technology enables precision agriculture (Wang et al., 2006), which obtains effective data in real time (Zhang et al., 2002). Precision livestock farming originates from the increased use of information technology for livestock and dairy management activities (Banhazi et al., 2007; Mertens et al., 2011). However, studies indicate that the application of information technology in agricultural production is minimal (Thomas and Callahan, 2002). Farmers did not take advantage of information technology during the 1980s and 1990s (Schmidt et al., 1994). Farmers have shown a low rate of information technology adoption (Morris et al., 1995). Studies in New Zealand indicate that dairy farms have not adopted or have been slow to adopt new technologies that would benefit their milk production (Crawford et al., 1989; Deane, 1993; Edwards and Parker, 1994; Stantiall and
Parker, 1997). In general, businesses do not utilize the full potential of information technology applications and components (Jasperson et al., 2005). Businesses typically operate at low levels of component use and rarely extend the use of available components that are offered by the technology (Davenport, 1998; Lyytinen and Hirschheim, 1987; Mabert et al., 2001; Osterland, 2000; Rigby et al., 2002; and Ross and Weill 2002).
There are two objectives for this dissertation. The first objective is to investigate factors for the post-adoption of a dairy management information system in South Korea. The second objective is to investigate factors for the assimilation and extended use of a dairy management information system. The first and second objectives are investigated in Chapters 3 and 4. The objectives are applied as two studies that focus on post-adoption and assimilation of information technology used in dairy management. A literature review on precision agriculture and precision livestock farming is also investigated in Chapter 2. Chapter 2 investigates the adoption, potential functions and actual applications of precision agriculture and precision livestock farming. Automated dairy systems are also reviewed.
Chapter 3 is an exploratory case study that examines the post-adoption of a dairy management information system in South Korea. We develop a multi-method case study to investigate the influences for adoption by early adopters. Individual adopter and environmental, technological and organizational factors are investigated. The results of this study can provide better insight for why the adoption of a dairy management information system and agricultural information systems in Korea and elsewhere is lagging. The propositions were evaluated using qualitative data collected through on site interviews with dairy managers that have already implemented the system. The study results suggest that environmental conditions appear more relevant than individual characteristics of the farmer. There was a general feeling that technology is a “good” thing rather than bottom-line profit. Trust is more important than economics. Although farmers adopted the technology, they still prefer to “observe” conditions on the farm manually. A
number of farm processes remained somewhat of an “art.” Farmers prefer to follow known routines. This relationship may contribute or hinder the adoption of this emerging technology. The results of this case study closely follow and are linked to the Technology-Organization-Environment Framework (Tornatsky and Fleisher, 1990). The results of the study were a set of propositions and general framework, which lead to Chapter 4. We were able to support eleven of sixteen propositions. This is the first exploratory, multi-method case study to look at a dairy management information system in South Korea. The study further provides a better understanding of the relationship between dairy managers and vendor support. We investigate factors that affect assimilation and extended use of a dairy management information system in Chapter 4.
Chapter 4 is a quantitative study that examines the assimilation and extended use of an information system used in dairy management. We initially investigate this study through the Technology-Organization-Environment Framework. The theoretical model proceeds through two assimilation and extended use stages. The first stage is farm operational activities. These farm operational activities are daily operations, production planning and herd health management. The second stage is the level of process automation. There are many studies that are concerned with the adoption of information technology. There have rarely been studies on assimilation of information technology from an agricultural and dairy context. The study utilizes data collected through a Likert-type survey. Exploratory and confirmatory factor analysis and partial least squares for hypothesis testing are performed. Results indicate that measures for daily operations have a significant effect on the level of process automation. This effect is negatively impacted by the years of dairy industry experience. There is also evidence that farm size can facilitate information system assimilation and extended use to automate herd health management. Social influences such as other farmers and other support services outside the organization can affect future use of the system. The system can also improve outside relationships and farm image. These factors facilitate the
assimilation and extended use of the system in farm operational activities. The study introduces an information systems framework and demonstrates its applicability to extended farm operational activities from a theoretical perspective. The study also introduces a new component that involves biological phases of a domesticated animal in a dairy farm environment. This biological component is rarely seen in information technology adoption and assimilation research.
Keywords: Assimilation, Dairy Management Information Systems, Extended Use,
Post-Adoption, Precision Agriculture, Precision Livestock Farming, Technology-Organization-Environment Framework
Student ID: 2009-30760 E-mail: ronberger@snu.ac.kr
Table of Contents
Abstract ………...
iKey Words ………... iv
Table of Contents ………
vList of Tables ………..
xiList of Figures ……….
xiiiChapter 1: Overview ………...
11.1 Research Background ………... 1
1.2 Problem Statement ………... 2
1.3 Small and Medium-sized Enterprises ………... 3
1.4 Dissertation Objectives and Research Questions ………... 5
1.5 Organization of the Dissertation ………... 6
Chapter 2: Literature Review ……….
82.1 Introduction ………... 8
2.2 The Agricultural Technology Revolution ………... 10
2.3 Precision Agriculture ……… 10
2.3.1 Awareness and Adoption of Precision Agriculture ………... 10
2.3.2 Barriers to Adopt and Automate Precision Agriculture ………... 11
2.3.3 Precision Agriculture Applications ……….. 13
2.4 Precision Livestock Farming ……… 15
2.4.1 Information Systems in Dairy Management ……… 15
2.4.2 Potential Functions of Precision Livestock Farming …………... 15
2.4.3 Adoption of Precision Livestock Farming ………... 17
2.5 Automatic Agricultural Systems ………... 19
2.6 Automatic Milking Systems ………... 24
2.7 Summary ………... 26
Chapter 3: Factors Affecting Adoption of a Dairy Management
Information System: An Exploratory Case Study ………..
273.1 Introduction ………... 27
3.1.1 Statement of the Problem ………... 28
3.1.2 Significance of the Study ………... 30
3.1.3 Purpose of the Study ……… 31
3.1.4 Research Question ………... 32
3.2 Literature Review ………... 33
3.2.1 Adoption of Information Technology in Agriculture …………... 33
3.2.2 Adoption of Information Technology in Dairy ……… 35
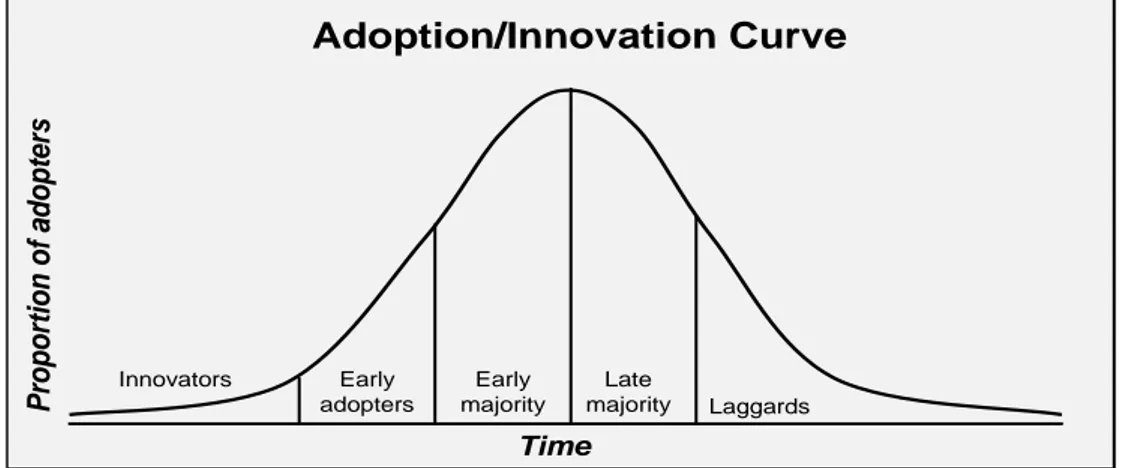
3.2.3 Innovation Diffusion Theory ……… 36
3.3 Theoretical Model and Propositions ………... 38
3.3.1 Adopter characteristics ………. 40
3.3.2 Environment Context ………... 44
3.3.3 Technology Context ………... 46
3.3.4 Organization Context ………... 49
3.4 Methodology ………... 52
3.4.1 Case Study Research Methodology ………... 52
3.4.2 Ethics of Survey Research ………... 56
3.4.3 Study and Interview Permission ……….. 57
3.4.4 Research Method ………... 57
3.4.5 Survey Population ……… 59
3.4.6 Sampling Method ………. 59
3.4.8 Survey Instrument ……… 60
3.4.9 The Dairy Management Information System …………... 61
3.5 Analysis ………. 62 3.5.1 Farm Size ………... 63 3.5.2 Experience ……… 63 3.5.3 Age ………... 64 3.5.4 Education ………... 65 3.5.5 Social Influences ……….. 65 3.5.6 Sponsorship ………... 66 3.5.7 Information Sharing ………... 67 3.5.8 Dealer Trust ………... 68 3.5.9 Relative Advantage ……….. 68 3.5.10 Knowledge ………... 68 3.5.11 Compatibility ………... 69 3.5.12 Planning ………... 69 3.5.13 Complexity ………. 70 3.5.14 Profitability ……… 71
3.5.15 Cash Flow/Financial Resources ………... 72
3.5.16 Risk-taking/Uncertainty ………... 72
3.6 Research Model Results ……… 74
3.7 Discussion ………... 76
3.7.1 Research Question ………... 76
3.7.2 Findings ……… 76
3.8 Study Limitations and Future Research ……… 79
3.8.1 Theoretical Contributions ……… 81
3.8.2 Practical Contributions ………. 82
Chapter 4: Factors Affecting Assimilation of a Dairy Management
Information System: A Quantitative Study ……….
844.1 Introduction ………... 84
4.1.2 Problem Statement ………... 85
4.1.3 Small and Medium-sized Enterprises ……….. 85
4.1.4 Significance of the Study ………... 87
4.1.5 Intent of the Study and Research Questions ……… 87
4.1.6 Limitations ………... 89
4.1.7 Delimitations ……… 90
4.1.8 Assumptions ………... 91
4.1.9 Organization of the Study ……… 91
4.2 Theoretical Background ………... 92
4.2.1 Adoption-Infusion Process ………... 92
4.2.2 Assimilation Process ……… 93
4.2.3 Technology-Organization-Environment Framework……… 93
4.2.4 Assimilation ………... 98
4.2.5 Extended Use of Information Technology ………... 100
4.2.6 Dairy Management Activities ……….. 102
4.2.7 Dairy Farm Supply Chain ……… 105
4.2.6 Milk Production Cycle ………... 106
4.3 Hypotheses and Model Development ………... 107
4.3.1 Theoretical Model ……… 108
4.3.2 Level of Process Automation ………... 110
4.3.3 Moderator Effects ……… 113
4.3.4 System Complexity ………... 114
4.3.5 System Compatibility ………... 116
4.3.6 Organization Competence ……… 117
4.3.8 Social Influences ……….. 120
4.3.9 Cooperative Support ……… 121
4.3.10 Control Variables ……… 123
4.3.11 Study Hypotheses ………... 124
4.4 Research Methodology ………... 126
4.4.1 Ethics of Survey Research ………... 126
4.4.2 Study and Survey Permission ……….. 127
4.4.3 Research Method ………... 127
4.4.4 Validity of Research Questions and Survey ………... 127
4.4.5 Survey Population ……… 128
4.4.6 Sampling Method ………. 128
4.4.7 Sample Validity ……… 128
4.4.8 Representative Sample ………. 129
4.4.9 The Survey Instrument ………. 129
4.4.10 Dairy Management Information System ……… 131
4.4.11 Operationalization and Validation ………... 132
4.4.12 Descriptive Analysis ……….. 134
4.5 Analysis and Results ………... 137
4.5.1 Statistical Tools ……… 137 4.5.2 Measurement Model ……… 139 4.5.3 Hypotheses Testing ………... 144 4.6 Discussion ………... 152 4.6.1 Process Automation ………... 155 4.6.2 Moderator Variables ………... 156 4.6.3 Daily Operations ………... 157 4.6.4 Production Planning ………. 158
4.6.5 Herd Health Management ……… 159
4.6.6 Control Variables ………... 160
4.7 Limitations and Future Research ……….. 163
4.8 Conclusions ………... 164
Chapter 5: Conclusions ………...
166References ………..
171Appendices ……….
208Appendix A. List of Abbreviations ………... 208
Appendix B. Case Study Open-Ended Interview Questions ………... 209
Appendix C. Dairy Management Information System Components …... 209
Appendix D-1. English Survey Questionnaire ……… 211
Appendix D-2. Taiwanese/Chinese Survey Questionnaire ………. 213
Appendix D-3. Korean Survey Questionnaire ……… 215
Appendix E. Farmers Comments ……… 217
List of Tables
Chapter 1: Overview
1-1 Changes in the Size Structure of U.S. Dairy Farms, 2000-2006 ……... 4
Chapter 2: Literature Review
2-1 Crop Production Revolutions for the U.S. during the Twentieth
Century ……… 10 2-2 Barriers limiting Automation Systems in Agriculture ………... 12 2-3 Functions Achieved By Precision Livestock Farming ………. 16 2-4 Factors for the Slow Adoption of Precision Livestock Farming
Technology ……….. 17 2-5 Barriers and Challenges for Adopting Precision Livestock Farming 17 2-6 Agriculture and Livestock Automated Technology …………... 20 2-7 Other Examples of Automation in the Food Industry ……... 22 2-8 Potential Areas of Development for Pig Management ……….. 23 2-9 Advantages and Disadvantages of Automated Milking Systems ……. 24
Chapter 3: Factors Affecting Adoption of a Dairy Management
Information System: An Exploratory Case Study
3-1 Categories of Adopter ………... 37 3-2 Selected Related Research, Factors and Expected Relationships ……. 51 3-3 Components and Functions of the Dairy Management Information
System ………. 62 3-4 Individual Adopter Characteristics ………... 66 3-5 Advantage, Knowledge, Compatibility and Planning ………... 70 3-6 Complexity, Profitability, Cash Flow, and Uncertainty and Risk ……. 73
3-7 Results of Propositions ………... 75
3-8 Key Findings ….……….... 78
Chapter 4: Factors affecting Assimilation of a Dairy Management
Information System: A Quantitative Study
4-1 Changes in the Size Structure of U.S. Dairy Farms, 2000-2006 86 4-2 Information Technology Implementation Model for an Organization 4-3 Three-Steps of the Assimilation Process ………... 934-4 Technology-Organization-Environment Framework …………... 96
4-5 Assimilation Studies Based on Innovation and Technological Diffusion Literature ………. 99
4-6 Dairy Farm Management and Activities ………... 103
4-7 Operational Management Functions ………... 104
4-8 Model Construct Definitions ………... 109
4-9 Study Hypotheses ………... 125
4-10 Components and Functions of the Dairy Management Information System ………... 131
4-11 Latent and Manifest Variables, Indicator Coding, and Concept …….. 132
4-12 Descriptive Statistics ………... 135
4-13 Reliability and Convergent Validity of the Measurement Model …... 4-14 Discriminant Validity: Reliability and Interconstruct Correlations for Reflective Indicators ………... 142
4-15 Item-to-Construct Cross Loadings ……….. 143
4-16 Results of the Structural Model Analysis ………... 146
List of Figures
Chapter 1: Overview
1-1 General Structure And Model Concepts For The Dissertation ……….. 6
Chapter 3: Factors affecting Adoption of a Dairy Management
Information System: An Exploratory Case Study
3-1 Adoption Innovation Curve ………... 383-2 Theoretical Model ………... 39
3-3 Developed Research Model and Resulting Analysis ……… 74
Chapter 4: Factors affecting Assimilation of a Dairy Management
Information System: An Empirical Study
4-1 Dairy Farm Supply Chain ………... 1054-2 Milk Production Cycle ………... 107
4-3 Theoretical Model ………... 108
4-4 Results of PLS Structural Model Analysis ………... 145
Chapter 5: Conclusions
5-1 Integrate Model ………. 170Chapter 1
Overview
Technology is dominated by two types of people: those who understand what they do not manage, and those who manage what they do not understand. –Archibald Putt, 2006
1.1 Research Background
Information technology (IT) can have a beneficial impact on the public. This impact has developed importance in areas such as education, health and medical services, and agriculture. How does IT impact agriculture? Technology enables what is referred to as precision agriculture (PA) (Wang et al., 2006). PA makes it possible to obtain effective data in real time (Zhang et al., 2002). In the context of dairy management, precision livestock farming (PLF) is a relatively new field originating from the increased use of IT that supports livestock management (Banhazi et al., 2007; Mertens et al., 2011). PLF was introduced to ensure that every process within a livestock activity is controlled and optimized within narrow limits (Banhazi and Black, 2009). Precision dairy farming (PDF) is an additional area that supports dairy operational activities with the use of IT (Schulze et. al., 2007). This optimization, in the case of PDF, can protect the consumer and animal, and ensure quality control within the dairy farm (Schulze et. al., 2007). For the intent of this dissertation, the implementation of an information system for dairy management (DMIS) can be equated to the recent implementation of PLF and PDF systems. Dairy farmers are now able to apply information systems (IS) software to manage milk through technology that monitors specific components such as fat, protein, blood, and other toxics with a predictable output. Other dairy functions such as cow activity, feeding and weighing can also be watched closely. An abbreviation list for this dissertation is provided in Appendix A.
1.2 Problem Statement
Why is it important to study the adoption and assimilation of information technology in agriculture and dairy management? Why has agriculture been slow to adopt and assimilate information technology? The literature shows that the adoption and assimilation of IT in agricultural production is minimal (Thomas and Callahan, 2002). Farmers did not adopt and assimilate IT during the 1980s and 1990s (Schmidt et al., 1994). Farmers have shown a low rate of IT adoption (Morris et al., 1995). Similarly, studies in New Zealand indicate that dairy farms have not adopted or have been slow to adopt new technologies that could benefit their milk production (Crawford et al., 1989; Deane, 1993; Edwards and Parker, 1994; Stantiall and Parker, 1997). Many cattle operations have also been slow to adopt and assimilate IT (Blezinger, 2001). Post-adoption behavior studies indicate similar results. Potential IT applications are underutilized by users (Jasperson et al., 2005). Users apply a minimal amount of applications, operate at a low level of use, and rarely initiate extended use of system components. Organizations need to accumulate collective intrinsic knowledge, and understand post-adoption behavior over time to fully utilize and assimilate IT.
The viability of IT depends on the continued use of the IT (Bhattacherjee, 2001; Karahanna et al., 1999). The assimilation of IT applications during post-adoption can increase overtime by intensification and routinization. The assimilation of IT can also decrease overtime with resistance, or treated with a lack of interest (Hartwick and Barki, 1994; Hiltz and Turoff, 1981; Kay and Thomas, 1995; Thompson et al. 1991, 1994) or enthusiasm (Thong et al., 2006). Overall, this can lead into decreased usage or disuse of the technology. Therefore, assimilation and post-adoption studies are ambiguous. One limitation is the research design. A cross-sectional design can be appropriate for pre-adoption research. However, a longitudinal design may be more appropriate for assimilation and post-adoption research.
expertise to apply “business best practices.” Rather, managers use intuition, experience and gut feeling (art versus science) to support their decisions in management and operational processes. It has not been easy to encourage farmers to accept and change the way that they manage information. However, business success, efficient production and the quality of agriculture and dairy products are dependent on reliable information. Ideally, dairy farms should be managed “like a business.” This is also apparent by the preference to assimilate and use technical solutions over business solutions (i.e., farming technology versus decision-making systems). However, business success and the ability to adopt and assimilate a reliable system can depend on factors such as the size of the farm, and the age and years of industry experience of the user.
1.3 Small and Medium-sized Enterprises
Typically, most farms are small and medium-sized enterprises (SMEs). They are operated by farming experts rather than business managers. For example, the United States dairy industry does have large-size corporate farms with 1000-2000 cows per farm.1 There was a 25.2% increase for this group from 2000-2006. In contrast, 28% of the dairy operations have less than 30 cows per farm. There was a 31% decrease for this group from 2000-2006. The changes in the size of dairy farms in the United States are shown in see Table 1-1. By definition, The United States government considers farms with 200 or fewer cows per farm as small-size operations.2 Although there has been some consolidation of small herd-size farms in recent years, most dairy farms in the United States (like other countries) are relatively small-size.
1
http://www.ers.usda.gov/publications/err47/err47b.pdf [Last accessed 06/27/2011]
2
Table 1-1 Changes in the Size Structure of U.S. Dairy Farms, 2000-2006
Herd size Farms (2000) % Farms (2006) % % Change
1-29 30,810 29.3 21,280 28.3 -31.0 30-49 22,110 21.0 14,145 18.8 -36.0 50-99 31,360 29.8 22,215 29.6 -29.2 100-199 12,865 12.2 9,780 13.0 -24.0 200-499 5,350 5.1 4,577 6.1 -14.4 500-999 1,700 1.6 1,700 2.3 +-0.0 1,000-1,999 695 0.7 870 1.1 +25.2 2,000+ 280 0.3 573 0.8 +104.6 Total 105,170 100.0 75,140 100.0 -25.5
Adapted from MacDonald et al., 2007
Similarly in the United Kingdom, over 11,000 dairy farms are SMEs with an average herd-size of 113 cows per farm.3 A majority of farms in Ireland have 50-60 cows per farm.4 Canada has a herd-size average just over 60 cows per farm (Painter 2007). Nearly all dairy farms in South Korea are family-operated. They have a herd-size of less than a 100 cows per farm (Berger, Forthcoming). In contrast to most countries, farms in New Zealand are much larger and average over 300 cows per farm (Painter, 2007). In addition, a survey of thirty dairy farm equipment dealers from seventeen countries that service over 2000 farms indicate that 69.5% of these farms have less than 200 cows per farm. Only 2.8% are corporate farms with greater than 2000 cows per farm (Berger, Forthcoming). Therefore, our assumption is that most dairy farms are small-size and managed by farmers rather than business managers regardless of developed or developing country.
3
http://www.wspa.org.uk/wspaswork/factoryfarming/UK_dairy_farming.aspx [Last accessed 06/27/2011]
4
1.4 Dissertation Objectives and Research Questions
The organization for this dissertation consists of three parts. A literature review is investigated on the adoption, potential functions and applications for precision agriculture and precision livestock farming in Chapter 2. Automated systems in dairy management are also reviewed. Second, an exploratory case study that investigates the post-adoption of a dairy management information system in Korea is conducted in Chapter 3. South Korea will be referred to as Korea for the remainder of this dissertation. Third, a quantitative study that examines the assimilation of a dairy management information system is conducted in Chapter 4. The survey for the quantitative study is developed from results of the exploratory case study. The assimilation of a DMIS from a Technology-Organization-Environment Framework (Tornatsky and Fleischer, 1990) design is investigated. The objectives of this dissertation are to investigate post-adoption factors for a DMIS currently used in Korea, and investigate factors for the assimilation of the same DMIS from an extended use and level of automation approach. The research questions for this dissertation are:
1. To what extent does the relationship of environmental, technological, and organizational factors drive/inhibit post-adoption of a dairy management information system in Korea?
2. To what extent does the assimilation of a dairy management information system in extended use activities drive the level of process automation on dairy farms?
3. To what extent does the relationship between technological, organizational, and environmental factors drive the assimilation of a dairy management information system in extended use activities on dairy farms?
1.5 Organization of the Dissertation
Businesses do not utilize the full potential of IT applications and system components (Jasperson et al., 2005). The adoption and assimilation of IT in agriculture has had varied results. This dissertation applies two related studies that focus on the adoption of a DMIS by early adopters in Korea, and the assimilation of the same DMIS in extended use activities and the level of process automation. Figure 1-1 shows the general structure and conceptual models developed in Chapters 3 and 4 of the dissertation.
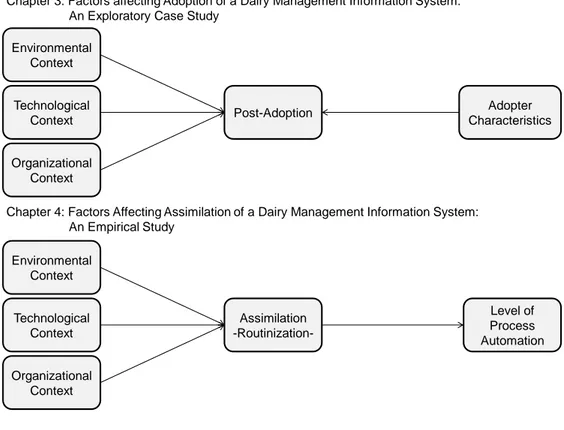
Chapter 3: Factors affecting Adoption of a Dairy Management Information System: An Exploratory Case Study
Chapter 4: Factors Affecting Assimilation of a Dairy Management Information System: An Empirical Study Environmental Context Technological Context Organizational Context Adopter Characteristics Post-Adoption Environmental Context Technological Context Organizational Context Assimilation -Routinization-Level of Process Automation
Figure 1-1 General Structure and Model Concepts for the Dissertation
Chapter 2 provides a literature review of the adoption, potential functions and applications within precision agriculture, precision livestock farming, and
automated systems in dairy management. Chapter 3 provides an exploratory case study based on the motivations for adoption of a dairy management information system by early adopters in Korea. This is an unexplored topic using a qualitative method approach. Initially an interpretive case study, farm visits and interviews were conducted to understand where farmers are coming from. Chapter 3 also provides an explanation and an argument that supports case study research, and reasons for why it is implemented into this dissertation. The result was a set of propositions and general framework, which lead to Chapter 4. Chapter 4 provides a quantitative empirical study of a dairy management information system that extends the Technology-Organization-Environment Framework.
The level of process automation is derived through extended use measures of the system. The results from Chapters 3-4 lead to Chapter 5. Chapter 5 provides final conclusions that draw together the case and quantitative studies. An explanation for how they are related is provided and new integrate framework based on the results is developed. The final sections include the references and Appendices for Chapters 1-5. The reference section is formatted by using the American Psychological Association or APA style guide.567 A list of abbreviations, open-ended interview questions for the case study, dairy management information system components description, Likert-type survey for the quantitative study (English, Taiwanese/Chinese, and Korean) and farmer comments are in the appendices. The final section is an abstract of the dissertation written in Korean.
5
http://www.library.cornell.edu/resrch/citmanage/apa [Last accessed 06/22/12]
6
http://owl.english.purdue.edu/owl/resource/560/01/ [Last accessed 06/22/12]
7
Chapter 2
Literature Review
The first rule of any technology used in a business is that automation applied to an efficient operation will magnify the efficiency. The second is that automation applied to an inefficient operation will magnify the inefficiency.8 –Bill Gates
2.1 Introduction
The management of information in the agriculture and dairy sectors is more complex today in comparison to the 1990s. The reasons for an increase in complexity are the intensification of farming systems and the additional knowledge about plant and animal management, consumer demand for higher quality products, and government regulations. Predictable output for farming systems is desirable since it can reduce perceived financial risk (Baker, 1973). Supply chain outputs can be measured by performance in the quantity or quality produced (Beamon, 1999). For example, companies invest in Total Quality Management or TQM to minimize variance in product quality (Hendricks and Singhal, 1997). In addition, predicting a stable inflow of inputs such as raw material, labor, and energy use (assuming consistent quality, quantity and pricing), and a stable and predictable production process can benefit a company’s manufacturing, marketing, communications, sales, and distribution processes (Zairi, 1997).
Predicting a stable inflow of inputs is relatively easy for most industries. A stable and predictable production process in a modern automated manufacturing environment is often accomplished by using robotics and shop-floor control systems (Grigori et al., 2001). Companies attempt to control their inputs by
8
engaging in Just-in-Time alliances, and integrate production. Inter-organizational Systems (IOS) such as electronic data interchange (EDI), supply chain management (SCM), Web auctions, and automated purchasing agents provide the infrastructure used to improve the procurement of goods (Premkumar, 2000). Controlling inputs is more challenging for industries that rely on natural or perishable resources (e.g., food processing). Industries have also adopted different levels of sophistication and automation in their production and distribution processes. For example, the automobile industry (Gorlach and Wessel, 2008) and the hardware and networking components of the hi-tech industry (Marino and Dominguez, 1997) are highly automated. In contrast, the agriculture industry is well known to be technically inferior (Thomas and Callahan, 2002). For example, social and economic limitations such as low-skilled manual labor and the lack of capital investment with low value for their products are barriers for adoption of IT in agriculture. However, decision-making on the farm depends on an increased volume of data from sensors that record the growing environment and physiological conditions of the plant or animal.
Technology for agriculture enables what is referred to as precision agriculture (PA) (Wang et al., 2006). PA makes it possible to obtain effective data in real time (Zhang et al., 2002). Precision livestock farming (PLF) is a relatively new discipline for farm animals. PLF originates from the increased use of information technology (IT) that supports livestock management and dairy management activities (Banhazi et al., 2007; Mertens et al., 2011). PLF was introduced to ensure that every process within a livestock activity is controlled and optimized within narrow limits (Banhazi and Black, 2009). Information systems have a potential to help the production of agriculture and dairy products because of the increased complexity in decision-making and the availability of data.
2.2 The Agricultural Technology Revolution
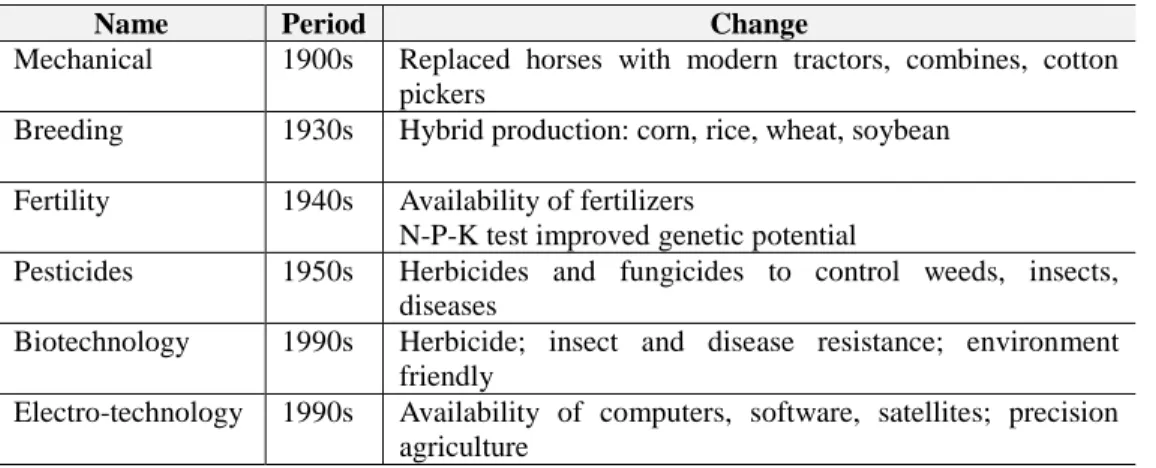
Agriculture has been through a number of changes like most industries. Agriculture in the twentieth century went from a labor intensive to a capital intensive operation.9 Traditional methods have been replaced by more mechanized and automated systems. The twentieth century has seen the mechanical, breeding, fertility, pesticide, biotechnology, and present electro-technology revolutions. Table 2-1 outlines a history of crop production revolutions for the United States. The electro-technology revolution has lead to PA and PLF.
Table 2-1 Crop Production Revolutions for the U.S. during the Twentieth Century
Name Period Change
Mechanical 1900s Replaced horses with modern tractors, combines, cotton pickers
Breeding 1930s Hybrid production: corn, rice, wheat, soybean Fertility 1940s Availability of fertilizers
N-P-K test improved genetic potential
Pesticides 1950s Herbicides and fungicides to control weeds, insects, diseases
Biotechnology 1990s Herbicide; insect and disease resistance; environment friendly
Electro-technology 1990s Availability of computers, software, satellites; precision agriculture
http://www.answers.com/topic/high-technology-farming
2.3 Precision Agriculture
2.3.1 Awareness and Adoption of Precision Agriculture
PA technologies have been available since the early 1990s. However, the pace of adoption in the United States has been moderate. A large number of producers are not familiar with PA technologies. User education and computer literacy, full-time
9
farming, and farm size positively influenced PA awareness, while age had a negative effect from an awareness point of view (Daberkow and McBride, 2003). Grain and oilseed farms (corn, soybean and small grains) and specialty crops (fruits, vegetables and nuts), and Heartland and Northern Great Plains located farms were more likely aware of PA technologies. Farm size, full-time farming and computer literacy positively influenced the likelihood of PA adoption from an adoption point of view (Daberkow and McBride, 2003). Furthermore, grain and oilseed farms, and Heartland located farms were more likely to adopt PA. In a sample of Ohio farm operators, adoption intensity and probability of PA occurred by factors such as farm size, farmer demographics, soil quality, urban influences, farmer status of debt, and location of the farm within the state (Isgin et al., 2008). Farm and farmer characteristics that influence the importance farmers place on PA for improving the nitrogen fertilization of cotton have been investigated (Torbett et al., 2008). Yield monitoring, management zone and grid soil sampling, and real time sensing increased farmers’ perceptions of the importance of PA for improving nitrogen fertilizer efficiency. In addition, farmers who implemented geospatial mapping were more likely than other farmers to find the importance of PA. Older cotton farmers with large land in production were more likely to place greater importance on PA for improving nitrogen efficiency. There are many factors that increase the likelihood of adoption. Similarly, there are also barriers that decrease the likelihood of adoption.
2.3.2 Barriers to Adopt and Automate Precision Agriculture
Initially, PA technology was used to improve the application of fertilizers. The rates and blend of nutrients required for that particular crop and environment are varied. The adoption of PA varies significantly by crop type, cropping system, and geographic location and country. Several barriers for the adoption of PA such as socio-economical, agronomical, and technological have been investigated (Robert, 2002). The socio-economic barriers are related to costs and lack of technical skills.
Agronomical barriers are related to the access to information which includes recommendations for site-specific fertilizer, qualified agronomic services, analysis procedures, and the misuse of information. Technological barriers are related to machinery, sensors, GPS, software and remote sensing issues. Determinants that can remove barriers to adopt PA are realized benefits in profitability and productivity, sustainability, crop quality, food safety, environmental protection, quality of life on the farm and rural economic development (Robert, 2002). However, the development of decision support systems (DDS) that can effectively help in the decision-making process could remove barriers for adopting PA (McBratney et al., 2005). Barriers for automation are similar for adoption.
Barriers for automation in agriculture are also an issue and can result from numerous factors. Table 2-2 lists and briefly defines these barriers.
Table 2-2: Barriers limiting Automation Systems in Agriculture
Barrier Brief Explanation
Mechanical technology: not robust Variety of environments with human intervention Mechanical technology: costly Machine repair; loss of production; low availability
of parts
Knowledge to create dexterity Lack of know-how to create skills of trained worker Legal risk User’s legal liability; insurance against damage Seasonality of agricultural
production
Idle time, loss productivity and anticipated payback time
Near properties follow same crop calendar
Infeasible to share use and cost of an automated machine
Limited capability Capable of automating only one agricultural task Modifying agronomic practices to
simplify design of automated machinery impractical
Develop affordable products that operate in current agronomic environment rather than develop products that require major changes in the work environment to succeed
Adapted from Kassler, 2001
Automated process-data acquisition may be restricted by hardware and software compatibility, different data formats, lack of how to reuse data, and amount of data (Steinberger et al., 2009). An agricultural process-data service where the software can be adapted to the specific farms and users was implemented. Data are recorded
on an ISOBUS communication system and transferred to a server, and analyzed. There are barriers limiting automated systems in agriculture. Eight barriers are identified that have prevented or delayed the implementation of automation systems in agriculture (Kassler, 2001).
2.3.3 Precision Agriculture Applications
There are many PA technologies and innovations that are either tested or in commercial use. Some PA technologies are sophisticated and based on remote-sensing and satellite images, and simulation modeling and supply chain database management. Others are more practical and fundamental such as aerator systems, and tracking soil compaction and analyzing soil nitrogen content. Examples of PA technologies are investigated in the following sections.
Farm Level Applications
A smart sprayer with an intelligent sensing and spraying system that integrates real-time machine vision sensing system and individual nozzle controlling with a commercial map-driven-ready (GPS) herbicide sprayer was developed and tested (Tian, 2002). The smart sprayer can estimate weed density and size, realize site-specific weed control, and effectively reduce the amount of herbicide applied to the crops in variable lighting conditions. Different sensors within a soil sensor system for measuring soil compaction were also developed and tested (Hemmat and Adamchuk, 2008). The sensors are able to simultaneously map soil mechanical resistance at different depths, water content, and fluid permeability. These factors can improve the knowledge of soil physical states and variability within the soil, which can potentially increase farm efficiency.
Geographic Information Systems
conditions. Different types of aeration systems were developed using AERO (Lopes et al., 2008). AERO was designed for a grain aerator system. It functions by equalizing the temperature inside the storage bin for cooling grain mass and maintaining the moisture content of the grain under safe conditions. They also achieved significant energy saving with the AERO controller. Geographic information system (GIS) has been applied. GIS was utilized to generate a comprehensive view of crop fields and assist in agro-technical decision-making (Nemenyi et al., 2003). A mixed application for two different farm simulation systems was formulated. Each farm simulation system has advantages and disadvantages, resulting in complexity for using either of the two systems. A quantified management-induced reduction in nitrogen losses with a Nitrogen Trading Tool (NTT) was developed at the farm level (Delgado et al., 2008). GIS and a Nitrogen Losses and Environmental Assessment Package (NLEAP) simulation model were assessed by using Windows XP. In addition, sites from a humid environment, manure management and irrigated cropland areas were assessed. Nitrogen management practices increased savings in reactive nitrogen with a potential to trade nitrogen credits. NLEAP is used to identify the best scenario for environmental conservation and nitrogen credit earning for trade. NLEAP has a potential for maximized yield savings in reactive nitrogen.
Database Applications
An Internet-based coffee information system (CINFO) provides farmers with information on where and how to produce coffee. CINFO has special features that provide traders with information on product availability and specific traits (Niederhauser et al., 2008). CINFO is a unique specialty coffee supplies chain. The system can identify individual groups of product for how and when they were produced, and processed and distributed to the consumer. Product quality and variation can be monitored systematically. Product quality feedback as perceived by the customer can be addressed. CINFO can also be linked to other databases for
identifying sites suitable for that particular need. Data-flows for a variety of PA techniques have also been modeled (Nash et al., 2009). The model demonstrates the relationships between datasets and for the optimization and automation of information management.
2.4 Precision Livestock Farming
2.4.1 Information Systems in Dairy Management
Information systems have the potential to help the dairy farmer with complex decisions in dairy farm activities. A framework to support the creation of information systems and a reference base for the analyses and improvement of existing information systems in dairy management was developed (Pietersma et al., 1998). The framework consists of management and control activities such as decision making, implementation, and assessment. The framework is divided by strategic, tactical, operational, and regulatory levels and management areas such as breeding, health, nutrition, environment, milk production, fixed assets, labor, and finance. They found a large amount of information exchange among management and control activities, and between farm environment and external representatives. In addition, PLF systems can be divided by diagnostic and management activities (Maltz, 2010). One sensor can monitor a physiological event and support decision-making. The framework includes sensors that generate data, a model for the data interpretation, management decision-making process, and execution of the decision.
2.4.2 Potential Functions of Precision Livestock Farming
PLF is based on the concept that IT would have an impact on dairy livestock production. One objective of PLF is to monitor animals continuously throughout their life with online technology. PLF uses the transfer of electronic information and applies it to control and optimize production and management processes. PLF
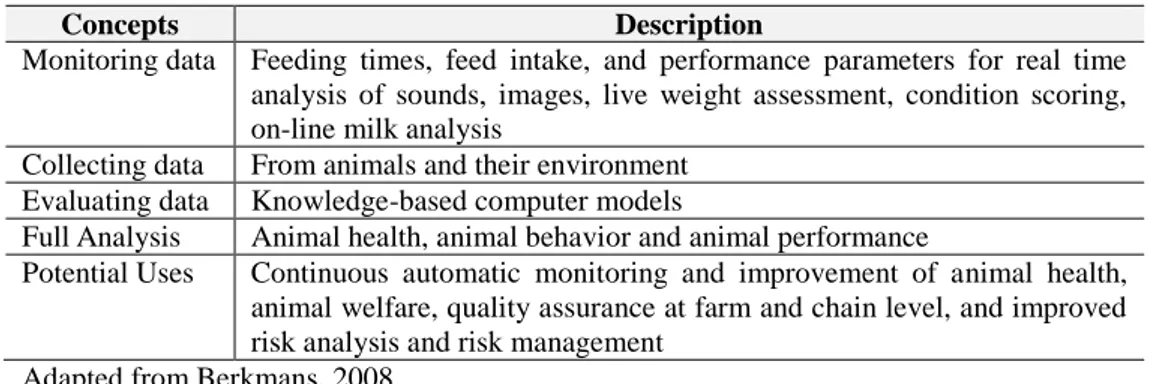
is also applied to automated control for supporting biological production processes such as feeding strategies, growth rate control, activity control (Aerts et al., 2003a, b; Halachmi et al., 2002; Morag et al., 2001), and body weight scales, milk composition analysis, behavior, digestion, and heart rate (Maltz, 2010). A summary of the potential functions that can be achieved by PLF is provided in Table 2-3 (Berkmans, 2008),
Table 2-3 Functions Achieved by Precision Livestock Farming
Concepts Description
Monitoring data Feeding times, feed intake, and performance parameters for real time analysis of sounds, images, live weight assessment, condition scoring, on-line milk analysis
Collecting data From animals and their environment Evaluating data Knowledge-based computer models
Full Analysis Animal health, animal behavior and animal performance
Potential Uses Continuous automatic monitoring and improvement of animal health, animal welfare, quality assurance at farm and chain level, and improved risk analysis and risk management
Adapted from Berkmans, 2008
PLF can also monitor the change or trend in herd activity. This can help in the prediction of health disorders and disease incidence, and not simply comparing individual cow activity or yield. Daily walking, cow activity and milk yields have been used as predictors of metabolic and digestive disorders (Edwards and Tozer, 2004). The management and control of biological processes is what differentiates IS used in PLF in comparison to IS for a typical business. For example, Enterprise Resource Planning (ERP) systems integrate internal and external information such as finance, accounting, manufacturing, sales and customer service throughout an organization. ERP automates these activities.10 These differences show that PLF systems are unique for management and control of biological processes.
10
2.4.3 Adoption of Precision Livestock Farming
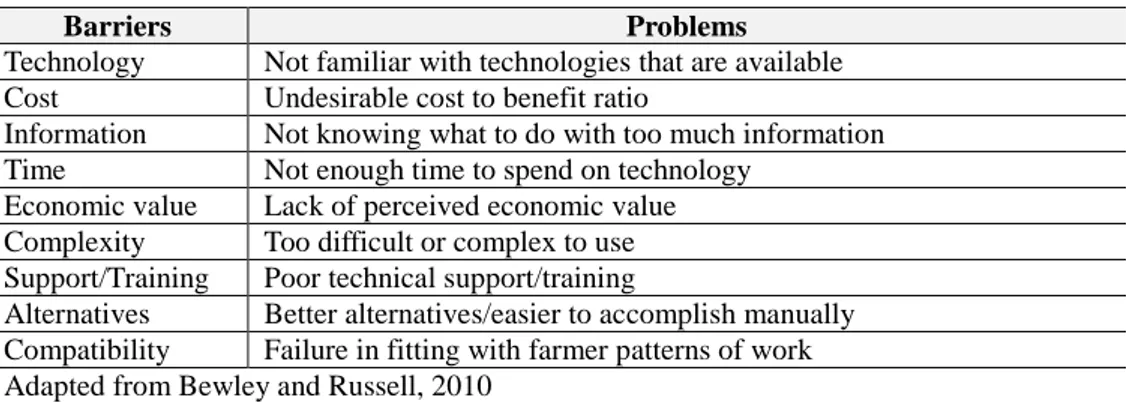
PLF technologies for animal status monitoring and management are expanding. However, availability in the dairy industry has been sparse (Gelb et al., 2001, Huirne et al., 1997). Factors influencing technology adoption are the economic returns for investing in new technology, impact on resources used in the production process, management necessary for implementation, risk aversion, and organizational goals, constraints, interest and motivation (Dijkhuizen et al., 1997; Van Asseldonk, 1999). Factors for the slow adoption of PLF technology have been suggested and are shown in Table 2-4 (Bewley and Russell, 2010).
Table 2-4 Factors for the Slow Adoption of Precision Livestock Farming Technology
Barriers Problems
Technology Not familiar with technologies that are available Cost Undesirable cost to benefit ratio
Information Not knowing what to do with too much information Time Not enough time to spend on technology
Economic value Lack of perceived economic value Complexity Too difficult or complex to use Support/Training Poor technical support/training
Alternatives Better alternatives/easier to accomplish manually Compatibility Failure in fitting with farmer patterns of work Adapted from Bewley and Russell, 2010
Table 2-5 Barriers and Challenges for the Adoption of Precision Livestock Farming Technology
Barriers Challenges
Technology Robust, low-cost sensing systems; data-based models for significant biological and physical processes; control systems managing; physical/biological processes
Applications Growth, disease and behavior of livestock; based on biological principles Marketing Demonstrated at a commercial scale for manufacturer confidence by
livestock farmers
Bioethics Viewed unfavorably by consumers as a technology that encourages instrumental use of animals and potentially compromising welfare
There are also many barriers for the adoption of PLF. Barriers can range from the technology itself to applications of the system, marketing efforts and bioethical issues. Four barriers and challenges for the adoption of PLF technology are suggested and shown in Table 2-5 (Wathes et al., 2008).
2.4.4 Applications of Precision Livestock Farming
Dairy Sensor Monitoring
Electronic animal identification is sensor technology that has been available since the mid-1970s. It is commonly known as radiofrequency identification (RFID). The third generation of RFID has introduced automated monitoring of animal health and reproduction status. This is essential for animal longevity. Neural networks with a fast learning algorithms, and multivariate time series analyses are necessary for mating behavior (ostreus) detection (Eradus and Jansen, 1999). A problem for detecting mating behavior is that the sensors are efficient, however not necessarily more accurate than human observers (Lehrer et al., 1992). Mating behavior detection is commonly detected by human observers. On large dairy farms, this could be difficult because of the short feeding and milking periods (Eradus et al., 1992). Pedometers are used for mating behavior detection and received better results than human detection. Pedometers have a detection rate of 80-90% (Firk et al., 2002). However, error rates are at 17-55% and specificities at 96-98%, which indicates a large number of false positive readings. This has resulted as a barrier for adoption of pedometers. Detection percentages increased as much as 95% when there was an increase between the number of steps measured by pedometers, mating behavior factors and the time of ovulation (Roelofs et al., 2005). Pedometer measurements can detect mating behavior accurately. They appear to predict ovulation for improving fertilization rates. The monitoring of calf birthing (parturition), breast disease (mastitis), and the breakdown of energy, protein, and mineral metabolism are also major concerns for the dairy farmer. A primary event
can be monitored to detect secondary and tertiary events such as conductivity,11 milk yield and temperature changes (Mottram, 1997). However, sensor data have a high number of false positives. Therefore, sensor data limits current veterinary and nutritional models.
Dairy Lameness
Lameness in dairy herds is caused by a variety of foot ailments that initially begin as abrasions and trauma to the hoof. Foot ailments can occur with 20.4% of the animals. Therefore foot ailments result in reduced animal activity, milk production, and animal comfort (USDA, 2002). A RFID sensor that measures animal lying time detects the vertical position of the leg to detect lameness. The electronic sensor utilizes nano-watt technology, onboard memory, and a wireless transmitter for storing and transferring data. The sensor is within 2.2% of the value measured by a human observer. The sensor may be a more reliable measure in comparison to human observers (Darr and Epperson, 2009).
Environmental Detection
The exposure of airborne contaminants can have a detrimental effect to livestock. Various technologies can detect real-time measurements of pollutants and control the level of airborne contaminants to an acceptable level (Watt et al., 2010). However, measuring airborne contaminants in the livestock environment has not provided precise and reliable emission estimates (Cambra-López et al., 2010).
2.5 Automated Agricultural Systems
Automated agricultural technology can provide an abundant amount of food that is affordable, nutritious, high quality and safe. Automated technology can improve
11
Conductivity is measured as a screening test for breast disease (mastitis) (Fernando et.al. 1982). Conductivity is used for tracking teat or breast (udder) health (Woolford et al., 1998).
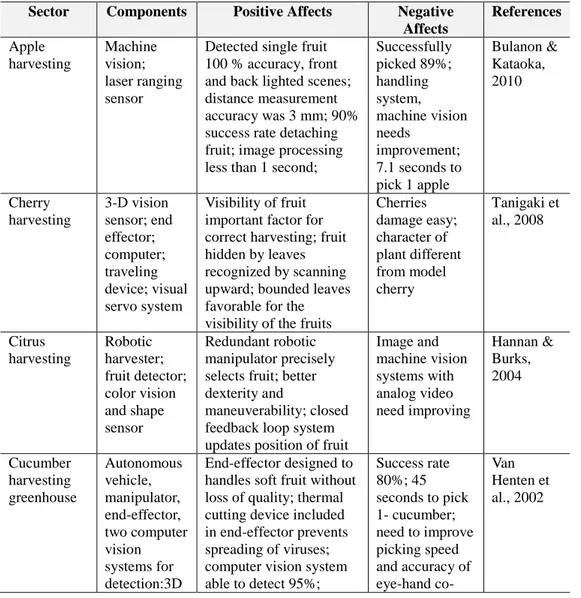
productivity and enhance the health and job satisfaction of employees. However, serious challenges exist in automating farm operations and activities (Grift et al., 2008). Presently, the performance of automated methods has been insufficient in comparison to traditional methods. Many technologies have not progressed beyond the prototype or pilot trial stage for this reason. Agriculture and livestock automated technologies are shown in Table 2-6.
Table 2-6 Agriculture and Livestock Automated Technology
Sector Components Positive Affects Negative
Affects References Apple harvesting Machine vision; laser ranging sensor
Detected single fruit 100 % accuracy, front and back lighted scenes; distance measurement accuracy was 3 mm; 90% success rate detaching fruit; image processing less than 1 second;
Successfully picked 89%; handling system, machine vision needs improvement; 7.1 seconds to pick 1 apple Bulanon & Kataoka, 2010 Cherry harvesting 3-D vision sensor; end effector; computer; traveling device; visual servo system Visibility of fruit important factor for correct harvesting; fruit hidden by leaves recognized by scanning upward; bounded leaves favorable for the visibility of the fruits
Cherries damage easy; character of plant different from model cherry Tanigaki et al., 2008 Citrus harvesting Robotic harvester; fruit detector; color vision and shape sensor Redundant robotic manipulator precisely selects fruit; better dexterity and
maneuverability; closed feedback loop system updates position of fruit
Image and machine vision systems with analog video need improving Hannan & Burks, 2004 Cucumber harvesting greenhouse Autonomous vehicle, manipulator, end-effector, two computer vision systems for detection:3D End-effector designed to handles soft fruit without loss of quality; thermal cutting device included in end-effector prevents spreading of viruses; computer vision system able to detect 95%; Success rate 80%; 45 seconds to pick 1- cucumber; need to improve picking speed and accuracy of eye-hand co-Van Henten et al., 2002
imaging; weight and ripeness of the determined; collision-free eye-hand co-ordination ordination Eggplant harvesting Machine vision, manipulator control, end-effector units; visual feedback fuzzy control model to actuate a manipulator Perform automatically basic harvesting operation, recognition, approach, and picking tasks; fundamental design of robotic harvesting was
developed; control model enabled manipulator end to approach fruit at 300 mm 62.5% harvesting rate; end-effector cut the peduncle at higher position from fruit base; harvesting execution time 64.1 seconds Hayashi et al., 2002 Mushroom harvesting Harvester: location, sizing, selection, picking, trimming, conveying and transfer; machine vision and image analysis Applies appropriate picking order; handling techniques for
conveying, trimming and transferring mushrooms using flexible fingers, high-speed; knives and padded pneumatic gripper system; 81.6% picking efficiency; lower bruising, damage, soil
Commercial farm trial; 9-mushrooms/ minute picking speed; vacuum produced faint damage during grasping Reed et al., 2001 Cherry petty-tomato, cucumber, grape harvesting Manipulators, end-effecters, visual sensors and traveling devices
System modeled after Japanese agriculture; bioproduction space similar to Japan’s agricultural system, few operators work in small space, robots for
bioproduction in space is considered desirable in near future Performance of robot components sometimes inferior to humans Kondo et al., 1996 Pig identification and rearing Mobile PDA reader , GPRS; mobile PDA embedded system
Embedded PDA identify special pig bar ear tag and general data matrix bar ear tag by mobile reader; record input data including bacterins, feed additives, animal drugs forbidden medicines; submitted to the center database through GPRS; Low speed transmitting GPRS or may not work; if installed SIM card only used to collect and send data without calling functions, Xiong et al., 2009
tracking and tracing from origin to consumption
monthly fee will not exceed 5 Yuan Sheep and goat flock management Decision support systems; SUPPRO VI.0; Visual Basic 6.0: MsAccess
Breeding value and animal breeding evaluations; matching unknown father to younglings; correct animal yields; high usability of software modules Software challenges; hereditary value not calculated; small flock size with inbreeding; software uses constant values to avoid negative heritability values; inbreeding cannot be calculated; SUPPRO VI.0 does not work on other platforms Onder et al., 2009 Dairy milking Milking stall, robot arm, teat sensor, milk equipment & udder cleaner
Increases milking from 2-3/day; increase of 1000 kg/lactation; lower physical and mental load on farmer; savings on physical labor; labor reduction Farmer working with complicated equipment; labor organizations Rossing et al., 1997
The food and horticulture sectors also play an important function for agribusiness. These two sectors can have an impact on the agriculture industry. Food and horticulture technologies are shown in Table 2-7.
Table 2-7 Other Examples of Automation in the Food Industry
Industry Automation Technology References
Food Analysis of foods Surface plasmon resonance sys.
Tothill, 2001 Horticulture Grading of ornamental
pot plants
Artificial neural network Timmermans & Hulzebosch, 1996 Agriculture Steering system for a
cereal harvester
Laser beam, photodetector
Hieronymus, 2000 Agriculture Identification of LBS/DIN system with Auernhammer et
to Office implements GPS and an implement indicator (IMI) al., 2000 Self-propelled, unmanned windrower GPS data Rider, 1998
Livestock Robotic milking machines
Monitoring and control systems
Ordolff, 1997 Livestock Cow udder geometry
system
Database Kimm & Heyden,
2000 Adapted from Cox, 2002
Swine Industry
The swine industry is a highly developed sector of livestock management that utilizes advanced IT. Potential areas for advanced development of pig management have been developed. These advances are shown in Table 2-8 (Banhazi and Black, 2007, Durack, 2002).
Table 2-8 Potential Areas of Development for Pig Management
Management Tools and Systems References
Environmental On-farm measurement and documentation
Banhazi, 2005; Silva et al., 2007 Housing Advanced climate control Banhazi et al., 2008
Animal welfare and behavior assessment
Shao & Xin, 2008 Production Real time individual pig weighing Kollis et al., 2007
Real time feed and water consumption
Madsen & Kristensen, 2005; Madsen et al, 2005
Disease monitoring Maatje et al., 1997; Eradus & Jansen, 1999
Integrated performance analysis of units
Heinonen et al., 2001; Pomar & Pomar, 2005
Online KPIs monitoring and comparison with modeled performance norms
Tukey, 1997
Supply Chain Slaughter house Information flow Petersen et al., 2002 Individual animal identification Naas, 2001; 2002 Automated record keeping Holst, 1999
Real time supply management Dobos et al., 2004; Guerrin, 2004 Adapted from Banhazi and Black, 2007
There are many measures that are taken within pig management. Environmental management, housing management, production management, and supply chain management are monitored.
2.6 Automatic Milking Systems
Automatic Milking System (AMS) can be defined as a system that automates all the functions of cow management and the milking process. There is a mix of manual and machine systems. The importance is placed on the cow’s enticement to be milked in a self-service manner several times a day by a robotic system without direct human supervision (De Koning and Rodenburg, 2004). In contrast, conventional milking systems (CMS) can be defined as a system where humans bring the cows to be milked at regular times (usually twice a day). Key factors for AMS are an efficient cow traffic system and available feed. These factors directly influence animal welfare problems such as behavioral or physiological condition of the cow. Table 2-9 is a summary of the advantages and disadvantages of AMS (Svennersten-Sjaunja and Pettersson, 2007). Increased chronic stress and the lack of a hygienic management program can have a negative effect on the functions of AMS.
Table 2-9 Advantages and Disadvantages of Automated Milking Systems
Function Advantages Disadvantages
Milking frequency
Predictable routine; reducing heavy milking workload; milking more than twice daily without extra labor costs (Dijkhuizen et al., 1997); gentler to the teats (Berglund et al. 2002)
High frequency milking that end abnormally increases udder health problems and reduce milk quality; depends on cow traffic conditions; reduction in lactation length (Hurnik, 1992); irregular intervals between milkings’ and failure of teat cup attachment (Bach and Busto, 2005); over-milking has negative effects on teat end quality: hardness and discoloration (Hillerton et al., 2002) Milking
process
Consistent; successful milking requires both
Dependent on the milker; cows are fed concentrate during milking to reduce milking
cisternal and alveolar
milk obtained
(Bruckmaier and Blum, 1998)
time and increase milk flow and udder emptying (Samuelsson et al., 1993); teat localization and teat cup attachment disturbed by a malfunctioning robotic arm
Milk fat quality
No differences between AMS and CMS for gross composition, such as fat and protein contents (Svennersten-Sjaunja et al., 2000)
Levels of milk FFA were increased (Justesen and Rasmussen, 2000; Klungel et al., 2000; de Koning et al., 2003) causing rancid flavors (Tuckey and Stadhouders, 1967) in dairy products; decreases ability to convert milk into processed dairy products (Sapru et al., 1997) Milk
hygiene
Enforces improved hygiene management
TBC increased in bulk milk (Klungel et al., 2000; Rasmussen et.al., 2002); bacteria may originate from teat skin or insufficient cleaning of the MU and inadequate cooling of the milk (Rasmussen et al., 2002) Milk somatic cell count (SCC) No increase incidence of intra-mammary infections and SCC or deterioration of teat tissue when cow health status and herd management are good (Zecconi et al., 2003).
Cows leak milk between milkings’ more frequently (Persson-Waller et al., 2003), higher risk for mastitis
Cow traffic Great potential for control and decision-making in individual management systems (Stefanowska et al., 1999, Melin et al., 2005)
Free traffic result in lowest milking frequency compared with forced or semi-forced traffic systems (Forsberg et al.,2002; Harms, 2004); forced traffic cows spent more time standing in the feeding area (Ketelaar-de Lauwere et al., 1998) and have lower milk yields
Animal welfare
Stress and heart rate measurements (Hagen et al., 2005) nor significant differences in behavioral or physiological responses of cows during milking was not observed during milking (Hopster et al., 2002)
Increased chronic stress, measured as heart rate variability (Hagen et al.,2005); wide individual variation to adapt (Weiss et al., 2004); missed milking negatively influenced cow behavior: time spent lying and frequent urinating (Stefanowska et al., 2000)
Maintenance Presence of technical staff
High; relies on a more skilled operator available on short notice; herd manager troubleshoots