Uric acid level and kidney
function: a cross‑sectional study
of the Korean national health
and nutrition examination survey
(2016–2017)
Hye Jin Joo
1,2, Gyu Ri Kim
2,3, Dong‑Woo Choi
1,2, Jae Hong Joo
1,2& Eun‑Cheol Park
2,3* Kidney disease is expected to become the fifth leading cause of premature death globally by 2040. Uric acid level is a risk factor for kidney disease. The current study aims to investigate the association between uric acid levels and kidney function in the Korean population. The data of 11,042 participants of the 2016–2017 Korea National Health and Nutrition Examination Survey were analysed. The estimated glomerular filtration rate was calculated using the modification of diet in renal disease formula for Koreans. For each sex, uric acid levels were divided into five subsequent categories of increasing levels (Q1, Q2, Q3, Q4, and hyperuricemia). The association between uric acid level and kidney function was investigated using multiple logistic regression. The results showed that the higher the uric acid levels, the greater the odds of reduced kidney function in both sexes. In men, the adjusted odds ratios (95% confidence intervals) for reduced eGFR comparing the hyperuricemia group to the lowest serum uric acid quartile was 5.55 (3.27–9.44), and in women, the odds ratios (95% confidence intervals) was 7.52 (4.39–12.87). Normal weight or underweight in men and overweight in women, as well as diabetes mellitus, hypertension, and physical inactivity were highly associated with reduced kidney function. Our study revealed a dose–response relationship between uric acid levels and kidney function. Therefore, high uric acid level should be considered as a factor that is potentially related to kidney dysfunction in the Korean population.Kidney disease is a common non-communicable condition that currently affects around 850 million people worldwide. Kidney disease is expected to become the fifth leading cause of premature deaths globally by 2040. One in 10 adults has chronic kidney disease (CKD), and every year, millions die prematurely from complica-tions related to CKD1,2. CKD is a cause of substantial healthcare expenditure, and the global burden of CKD is
increasing3. CKD requires hemodialysis or kidney transplantation, reduces quality of life, and involves a high
cost for the patient4. Additionally, the risk of cardiovascular complications such as heart attack, stroke, and
myocardial infarction is increased in CKD patients5,6.
The kidneys play a major role in filtering body waste and toxins from the blood and discharging them into the urine as well as in maintaining the body’s moisture, electrolyte, and acidity levels and controlling blood pressure. If these kidney functions are impaired and waste is not removed from the blood, a variety of uremic symptoms occur, some which may be life-threatening. Importantly, the kidney has a limited capacity to recover from chronic damage. The kidney performs major functions in the body, and attention should be paid to the fact that by the time symptoms manifest, kidney function is often already reduced by approximately 50%. In the face of this global public health problem, it is important to prevent the side effects of CKD by identifying and managing modifiable risk factors, such as diabetes or high blood pressure7,8.
As the population ages, the number of CKD patients is expected to increase at an accelerated pace, but unfor-tunately the lack of early diagnosis leads to the loss of opportunities for prevention9. The main indicator of kidney
function is the blood creatinine level; creatinine accumulates in the blood, leading to elevated creatinine levels
OPEN
1Department of Public Health, Graduate School, Yonsei University, Seoul, Republic of Korea. 2Institute of Health
Services Research, Yonsei University, Seoul, Republic of Korea. 3Department of Preventive Medicine and Institute
of Health Services Research, Yonsei University College of Medicine, 50 Yonsei-ro, Seodaemun-gu, Seoul 03722, Republic of Korea. *email: [email protected]
when kidney function is reduced. Kidney function can be best measured using the glomerular filtration rate (GFR), which is a measure of blood filtration by the kidneys. GFR can be easily estimated (eGFR) by measuring the blood creatinine level and considering age, ethnicity, and sex.
Diabetes, hypertension, glomerulonephritis, obesity, and aging have been consistently reported as the risk factors for CKD10–12. The situation with respect to uric acid level, however, is remained widely unexplored.
Previ-ously, a few studies have been conducted to investigate the relationship between serum uric acid levels and CKD suggesting that a high uric acid level could play a potential role in onset or progression of kidney disease13–15.
According to a study examining the association between serum uric acid levels and kidney disease in Korean men, elevated serum uric acid levels were independently associated with an increased likelihood of CKD16.
In addition, a recent study examining the association between gout and the risk of advanced CKD found that patients with gout had a higher incidence of advanced CKD than those without17.
Although studies on the relationship between uric acid levels and kidney function have shown controversial results for a long time, an insufficient number of studies have been performed in the Korean population. Fur-thermore, previous study has focused mainly on hyperuricemia18,19. Thus, the present study aimed to validate
the association between serum uric acid level and CKD and clarify what other factors might play a potential role in developing CKD in the general South Korean population.
Materials and methods
Data collection and study population.
Data were derived from the Korea National Health and Nutri-tion ExaminaNutri-tion Survey (2016–2017)18. KNHANES is a cross-sectional study design of nationallyrepresenta-tive to evaluate the health and nutritional status of the Korean population aged 1 year and over. This survey is conducted annually by the Korean Centers for Disease Control and Prevention (KCDC). KNHANES employs a stratified and multistage cluster sampling design based on geographic area, gender, and age, to select household units. KNHANES contains reliable data on the general population of Korea, and is a valuable resource for devel-opment and evaluation health policies and programs in Korea.
The initial study population comprised 16,277 individuals. Among them, 16,232 subjects were selected, and those who were diagnosed with kidney failure by doctor were excluded. In addition, the subjects with missing data on uric acid levels, sex, age, socioeconomic status, or health-related factors were excluded from the study, resulting in a final sample of 11,042 individuals for analysis. KNHANES data is publicly accessible and ethi-cal approval is not required for the use of the data. In addition, as the respondent’s information is completely anonymous, there is no need for prior consent for research purposes.
Measurement of kidney function using the eGFR for the Korean population.
The main objective of this study was assessment of kidney function. GFR is an essential aspect of kidney function evaluation. This measurement determines the level of creatinine in the blood and calculates a kidney function score that indicates how well the kidneys are functioning. Glomerular filtration rate indicates the amount of blood filtered per min-ute by the glomeruli. If kidney function decreases due to injury or disease, the filtration rate decreases, and waste products begin to accumulate in the blood. Clinically, the eGFR is mainly used to detect kidney status. eGFR is calculated on the basis of a serum creatinine test. Creatinine is a muscle waste product that is filtered out of the blood by the kidneys and is released into the urine at a relatively constant rate.The eGFR was calculated using the modification of diet in renal disease (MDRD) formula. In 2010, a Korean MDRD formula was developed, which was reported to measure the glomerular filtration rate of Koreans more accurately than the conventional MDRD formula. The Korean MDRD formula for the eGFR is as follows: 107.904 × (Creatinine in mg/dL)−1.009 × (age)−0.02 × (0.667 if female)19. Therefore, in this study, kidney function was
confirmed using the Korean MDRD formula. The normal range of glomerular filtration rate is about 90–120 mL per minute. A reduction of the GFR can be interpreted as impaired kidney function. According to the eGFR formula, participants with a GFR of less than 90 mL were considered to have reduced kidney function. In order to identify malfunction of kidney function, the dependent variable was designed in the form of a binary divi-sion with a cut-off of 90 mL (i.e., decreased function group: < 90 mL/min/1.73 m2, normal group: ≥ 90 mL/
min/1.73 m2)2.
Uric acid levels.
The main exposure of interest was serum uric acid levels (SUA). Venous blood samples were collected in the morning after an overnight fast. In the KNHANES, SUA was measured by means of a Hitachi automatic analyzer 7600-210 using a colorimetric enzymatic method. SUA levels were then divided into five categories in both sexes: one group for hyperuricemia (> 7.00 mg/dL for men; > 6.00 mg/dL for women20,21),and four groups (Q1, Q2, Q3, and Q4) within the reference range according to sex-specific quartiles. The SUA quartiles were as follows: < 4.80 mg/dL, 4.80–5.49 mg/dL, 5.50–6.09 mg/dL, 6.10–6.99 mg/dL for men; and < 3.70 mg/dL, 3.70–4.19 mg/dL, 4.20–4.79 mg/dL, 4.80–5.99 mg/dL for women. The groups under 4.80 mg/dL (men) and 3.70 mg/dL (women) were set as the reference groups.
Covariates.
The following covariates were included in the fully adjusted models because they could be asso-ciated with kidney function and uric acid level: age (< 40, 40–49, 50–59, 60–69, ≥ 70), household income group (low, medium–low, medium–high, or high), educational level (high school or under, university or above), region (metropolitan or rural), and occupational categories (white collar, pink collar, blue collar, or unemployed). Household income groups classified as quartiles were calculated by dividing household income by the square root of the number of household members, a standard method recommended by the Organisation for Economic Cooperation and Development22. Occupations were categorised according to the Korean version of the StandardInter-Kidney function: eGFR (mL/min per 1.73 m2)ª
Men (n = 4848) Women (n = 6194)
TOTAL Decreased functionc Normal functiond
P value
TOTAL Decreased function Normal function
P value
N % N % N % N % N % N %
Uric acid level (mg/dL)b < 0.0001 < 0.0001
Q1 951 19.6 63 6.6 888 93.4 1367 22.1 270 19.8 1097 80.2 Q2 949 19.6 88 9.3 861 90.7 1318 21.3 341 25.9 977 74.1 Q3 945 19.5 102 10.8 843 89.2 1506 24.3 535 35.5 971 64.5 Q4 1081 22.3 166 15.4 915 84.6 1600 25.8 689 43.1 911 56.9 Hyperuricemia 922 19.0 229 24.8 693 75.2 403 6.5 249 61.8 154 38.2 BMIe < 0.0001 0.001 Underweight or Normal (< 23.0) 1610 33.2 166 10.3 1444 89.7 3031 48.9 950 31.3 2081 68.7 Overweight (23.0–24.9) 1267 26.1 173 13.7 1094 86.3 1267 20.5 456 36.0 811 64.0 Obese (≥ 25.0) 1971 40.7 309 15.7 1662 84.3 1896 30.6 678 35.8 1218 64.2 Waist circumference < 0.0001 Normal 2133 44.0 226 10.6 1907 89.4 4457 72.0 1430 32.1 3027 67.9 Abdominal obesity 2715 56.0 422 15.5 2293 84.5 1737 28.0 654 37.7 1083 62.3 Age < 0.0001 < 0.0001 < 40 1403 28.9 116 8.3 1287 91.7 1739 28.1 426 24.5 1313 75.5 40–49 911 18.8 95 10.4 816 89.6 1175 19.0 346 29.4 829 70.6 50–59 906 18.7 85 9.4 821 90.6 1206 19.5 378 31.3 828 68.7 60–69 842 17.4 133 15.8 709 84.2 1072 17.3 422 39.4 650 60.6 ≥ 70 786 16.2 219 27.9 567 72.1 1002 16.2 512 51.1 490 48.9 Household income < 0.0001 < 0.0001 Low 828 17.1 166 20.0 662 80.0 1233 19.9 515 41.8 718 58.2 Mid-low 1157 23.9 154 13.3 1003 86.7 1523 24.6 491 32.2 1032 67.8 Mid-high 1373 28.3 165 12.0 1208 88.0 1699 27.4 501 29.5 1198 70.5 High 1490 30.7 163 10.9 1327 89.1 1739 28.1 577 33.2 1162 66.8 Educational level 0.0002 < 0.0001 ≤ High school 2394 49.4 364 15.2 2030 84.8 3704 59.8 1353 36.5 2351 63.5 ≥ College 2454 50.6 284 11.6 2170 88.4 2490 40.2 731 29.4 1759 70.6 Region 0.278 0.012 Metropolitan 2138 44.1 273 12.8 1865 87.2 2725 44.0 963 35.3 1762 64.7 Rural 2710 55.9 375 13.8 2335 86.2 3469 56.0 1121 32.3 2348 67.7 Occupational categoriesf < 0.0001 < 0.0001 White 1417 29.2 159 11.2 1258 88.8 1346 21.7 410 30.5 936 69.5 Pink 483 10.0 30 6.2 453 93.8 890 14.4 251 28.2 639 71.8 Blue 1620 33.4 199 12.3 1421 87.7 960 15.5 305 31.8 655 68.2 Unemployed 1328 27.4 260 19.6 1068 80.4 2998 48.4 1118 37.3 1880 62.7 Diabetes mellitus < 0.0001 < 0.0001 Yes 513 10.6 121 23.6 392 76.4 539 8.7 262 48.6 277 51.4 No 4335 89.4 527 12.2 3808 87.8 5655 91.3 1822 32.2 3833 67.8 Hypertension < 0.0001 < 0.0001 Yes 1278 26.4 307 24.0 971 76.0 1374 22.2 648 47.2 726 52.8 No 3570 73.6 341 9.6 3229 90.4 4820 77.8 1436 29.8 3384 70.2 Dyslipidemia < 0.0001 < 0.0001 Yes 757 15.6 143 18.9 614 81.1 1215 19.6 509 41.9 706 58.1 No 4091 84.4 505 12.3 3586 87.7 4979 80.4 1575 31.6 3404 68.4 Smoking status < 0.0001 0.316 Current smoker 1712 35.3 178 10.4 1534 89.6 303 4.9 90 29.7 213 70.3 Ex-smoker 2004 41.3 326 16.3 1678 83.7 353 5.7 122 34.6 231 65.4 Non-smoker 1132 23.3 144 12.7 988 87.3 5538 89.4 1872 33.8 3666 66.2 Drinking status < 0.0001 < 0.0001 Frequently 1772 36.6 204 11.5 1568 88.5 708 11.4 184 26.0 524 74.0 Occasionally 2256 46.5 286 12.7 1970 87.3 3350 54.1 1077 32.1 2273 67.9 Never 820 16.9 158 19.3 662 80.7 2136 34.5 823 38.5 1313 61.5 Physical activity 0.044 0.071 Continued
national Labor Organization23. We restructured the classification into four categories: white (office work), pink
(sales and service), blue (agriculture, forestry, fishery, and armed forces occupations), and unemployed. Health-related covariates included body mass index (normal or underweight, overweight, or obese), waist circumference (normal circumference or abdominal obesity), diabetes mellitus, hypertension, dyslipidaemia, smoking status (non-smoker, ex-smoker, or current smoker), frequency of drinking (never, occasionally, or frequently), physical activity (active or inactive). Waist circumference was divided using the Korean abdominal obesity criteria, which is 90 cm for men and 85 cm for women24. The diagnoses of diabetes mellitus, hypertension,
and dyslipidaemia were confirmed by an experienced physician. Physical activity was assessed by the ability of the subject to engage in a moderate-intensity activity for more than 150 min, a high intensity activity for more than 75 min, or a combination of both moderate and high intensity-activity (1 min of high intensity and 2 min of moderate intensity) per week25.
Statistical analysis.
Owing to the considerable sex differences in physical functions such as the capac-ity of female hormones to effectively reduce uric acid levels, all analyses have been stratified by sex. Sampling weights were applied in all data analyses to perform multistage stratified probability sampling of KNHANES. Descriptive analysis was performed to examine the distribution of the general characteristics of the study popu-lation. We calculated the frequency and percentages for each variable through the chi-square test. The statistical significance level was set as p-value of lower than 0.05. To identify the association between uric acid levels and kidney function, a multiple logistic regression analysis was performed after adjusting sociodemographic and health-related covariates. Odds ratios (ORs) and 95% confidence intervals (CIs) were calculated in order to perform comparisons between subjects with uric acid levels below 4.80 mg/dL (males) or 3.70 mg/dL (females) and subjects with different levels of uric acid (males: 4.80–5.49 mg/dL, 5.50–6.09 mg/dL, 6.10–6.99 mg/dL, over 7.00 mg/dL; females: 3.70–4.19 mg/dL, 4.20–4.79 mg/dL, 4.80–5.99 mg/dL, over 6.00 mg/dL). Subgroup analysis was performed by body mass index (BMI), waist circumference, age, previously diagnosed diabetes, previously diagnosed hypertension, previously diagnosed dyslipidaemia. In addition, multicollinearity was tested using the variance inflation factors. All statistical analyses were performed using SAS 9.4 software (SAS Institute, Cary, NC, USA).Results
Table 1 presents the general characteristics of the gender-stratified study population. Overall, 922 (19.0%) of the 4,848 men and 403 (6.5%) of the 6194 women included in the study were considered hyperuricemic respectively. In general, among both men and women, higher uric acid levels were associated with lower kidney function (p < 0.001 for both men and women). Specifically, the percentages of decreased kidney function among men were 6.6%, 9.3%, 10.8%, 15.4%, and 24.8% in the < 4.80, 4.80–5.49, 5.50–6.09, 6.10–6.99, and ≥ 7.00 mg/dL groups, respectively, while among women, the proportions of decreased kidney function were 19.8, 25.9, 35.5, 43.1, and 61.8% in the < 3.70, 3.70–4.19, 4.20–4.79, 4.80–5.99, and ≥ 6.00 mg/dL groups, respectively.
Table 2 shows the logistic regression analysis results for both men and women, adjusted for all covariates. We observed a dose–response relationship between uric acid levels and kidney function in both men and women. In particular, compared with the reference group, the odds ratios (95% CIs) for kidney dysfunction in men were
Table 1. General characteristics of the study population. ªGlomerular filtration rate for the Korean
population, estimated using the Modification of Diet in Renal Disease equation (mL/min per 1.73
m2) = 107.904 × (Creatinine in mg/dL)−1.009 × (age)−0.02 × 0.667 [if female]. b Q1: < 4.80 mg/dL, < 3.70 mg/dL; Q2:
4.80–5.49 mg/dL, 3.70–4.19 mg/dL; Q3: 5.50–6.09 mg/dL, 4.20–4.79 mg/dL; Q4: 6.10–6.99 mg/dL, 4.80– 5.99 mg/dL; Hyperuricemia: ≥ 7.00 mg/dL, ≥ 6.00 mg/dL, respectively. c Decreased function = eGFR < 90 mL/
min per 1.73 m2; dNormal function = eGFR 90 ≥ mL/min per 1.73 m2. e BMI body mass index; Obesity status
defined by BMI based on the 2018 Clinical Practice Guidelines for Overweight and Obesity in Korea. f Three
groups (white, pink, and blue) based on the International Standard Classification of Occupations Codes. Unemployed group includes housewives.
Kidney function: eGFR (mL/min per 1.73 m2)ª
Men (n = 4848) Women (n = 6194)
TOTAL Decreased functionc Normal functiond
P value
TOTAL Decreased function Normal function
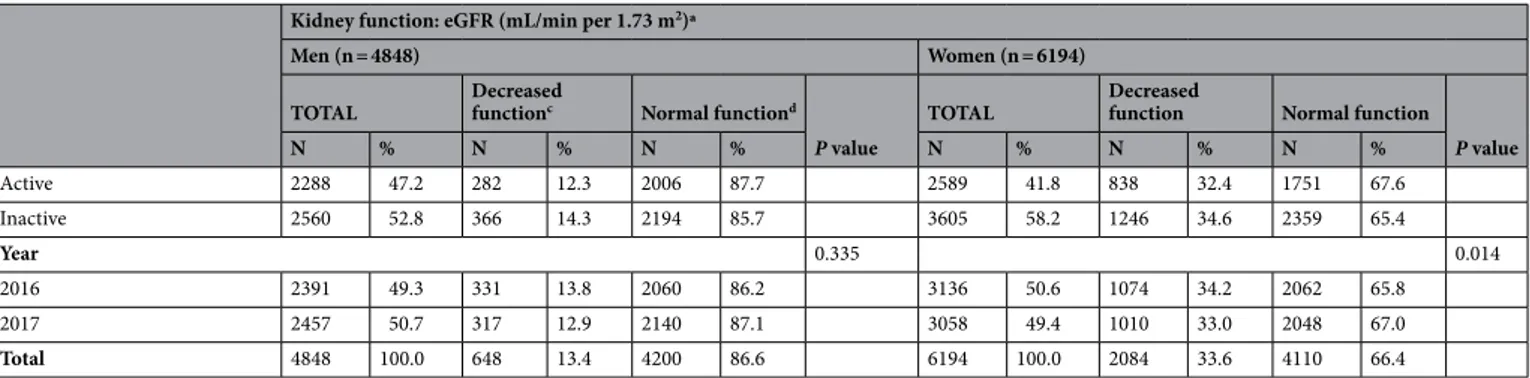
P value N % N % N % N % N % N % Active 2288 47.2 282 12.3 2006 87.7 2589 41.8 838 32.4 1751 67.6 Inactive 2560 52.8 366 14.3 2194 85.7 3605 58.2 1246 34.6 2359 65.4 Year 0.335 0.014 2016 2391 49.3 331 13.8 2060 86.2 3136 50.6 1074 34.2 2062 65.8 2017 2457 50.7 317 12.9 2140 87.1 3058 49.4 1010 33.0 2048 67.0 Total 4848 100.0 648 13.4 4200 86.6 6194 100.0 2084 33.6 4110 66.4
Variables
Kidney function: eGFR (mL/min per 1.73 m2)ª
Men Women
Adjusted ORb 95% CI Adjusted ORb 95% CI Uric acid level (mg/dL)c
Q1 1.00 1.00 Q2 1.49 (0.92–2.39) 1.41 (1.12–1.77) Q3 1.70 (1.10–2.64) 2.24 (1.82–2.76) Q4 3.02 (1.96–4.67) 3.12 (2.52–3.86) Hyperuricemia 5.49 (3.64–8.29) 5.79 (4.37–7.66) BMId Normal or underweight (< 23.0) 1.00 1.00 Overweight (23.0–24.9) 1.45 (1.05–2.00) 0.87 (0.73–1.04) Obese (≥ 25.0) 1.61 (1.17–2.22) 0.74 (0.60–0.90) Waist circumference Normal 1.00 1.00 Abdominal obesity 0.80 (0.60–1.05) 0.90 (0.73–1.11) Age < 40 1.00 1.00 40–49 1.58 (1.15–2.18) 1.42 (1.17–1.72) 50–59 1.36 (0.93–1.98) 1.61 (1.31–1.98) 60–69 2.30 (1.55–3.43) 2.24 (1.75–2.88) ≥ 70 4.63 (3.11–6.90) 3.14 (2.37–4.17) Household income Low 1.00 1.00 Mid-low 0.94 (0.66–1.34) 0.91 (0.74–1.12) Mid-high 0.92 (0.66–1.29) 0.93 (0.75–1.15) High 0.77 (0.55–1.08) 1.09 (0.87–1.36) Educational level ≤ Highschool 1.00 1.00 ≥ College 1.37 (1.04–1.79) 1.05 (0.88–1.25) Region Metropolitan 1.00 1.00 Rural 1.04 (0.84–1.29) 0.80 (0.70–0.92) Occupational categoriese White 1.05 (0.77–1.44) 1.06 (0.87–1.28) Pink 0.52 (0.33–0.81) 0.81 (0.66–0.99) Blue 0.87 (0.66–1.14) 0.89 (0.73–1.09) Unemployed 1.00 1.00 Diabetes Yes 1.30 (0.98–1.74) 1.38 (1.08–1.77) No 1.00 1.00 Hypertension Yes 2.19 (1.70–2.82) 1.28 (1.04–1.56) No 1.00 1.00 Dyslipidemia Yes 0.92 (0.70–1.23) 0.96 (0.80–1.14) No 1.00 1.00 Smoking status Current smoker 1.03 (0.78–1.37) 1.37 (1.03–1.83) Ex-smoker 0.93 (0.69–1.25) 0.92 (0.69–1.24) Non-smoker 1.00 1.00 Drinking status Frequently 0.91 (0.70–1.18) 0.99 (0.86–1.14) Occasionally 0.67 (0.49–0.92) 0.83 (0.64–1.08) Never 1.00 1.00 Physical activity Active 1.00 1.00 Continued
as follows: OR = 1.49 [95% CI 0.92–2.39] for 4.80–5.49 mg/dL; OR = 1.70 [95% CI 1.10–2.64] for 5.50–6.09 mg/ dL; OR = 3.02 [95% CI 1.96–4.67] for 6.10–6.99 mg/dL; OR = 5.49 [95% CI 3.64–8.29] for ≥ 7.00 mg/dL. Among women, the odds ratios (95% Cis) across the uric acid level groups in women were as follows: OR = 1.41 [95% CI 1.12–1.77] for 3.70–4.19 mg/dL; OR = 2.24 [95% CI 1.82–2.76] for 4.20–4.79 mg/dL; OR = 3.12 [95% CI 2.52–3.86] for 4.80–5.99 mg/dL; OR = 5.79 [95% CI 4.37–7.66] for ≥ 6.00 mg/dL. In other words, the higher the uric acid levels, the higher the odds ratios for reduced eGFR. The odds ratio was significant in all groups for both sexes except for men in the 4.80–5.49 mg/dL group. The hyperuricemia groups in both genders showed the highest risk of kidney function reduction.
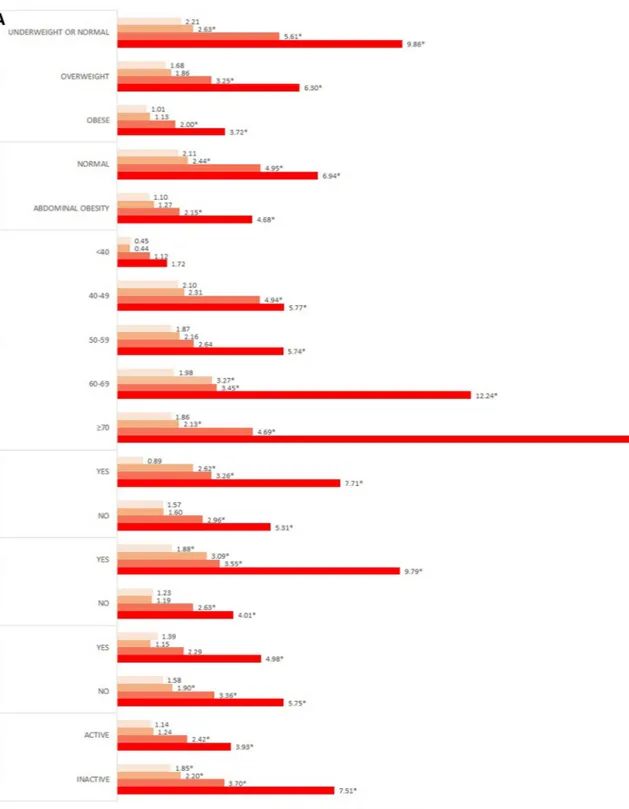
Fig. 1A and B present the results of the subgroup analysis stratified by gender. For BMI, both genders main-tained the dose–response relationship in all BMI categories. Among men, the ORs of the normal or underweight group were significantly higher than those of the other groups. In particular, the OR of the hyperuricemia group was 9.86 times higher than that of normal subjects. In contrast, among women, the OR of the hyperuricemia subjects in the overweight group was 6.94 times higher than that of normal subjects.
In the subgroup analysis according to waist circumference and BMI, a dose–response relationship was observed in both the normal and the abdominal obesity groups. Among women, those who had abdominal obesity and hyperuricemia were 6.48 times more likely than normal controls to show decreased kidney func-tion. The likelihood of decreased kidney function in both men and women increased with advancing age. Men who were previously diagnosed with diabetes or hypertension showed significantly higher ORs than did normal subjects; in particular, men with hyperuricemia were 7.71, and 9.79 times higher than the reference group. Women who were previously diagnosed with diabetes, hypertension, and dyslipidaemia had a dose–response relationship between uric acid levels and decreased kidney function. Particularly, in the hyperuricemia group, ORs were the highest at 9.13, 9.89, and 10.88 times. Moreover, subjects with limited physical activity were more likely to have decreased kidney function.
Discussion
The purpose of this study was to examine the association between uric acid levels and kidney function in the Korean population using the Korean MDRD formula using representative KNHANES data. We also conducted a subgroup analysis according to BMI, waist circumference, diabetes, hypertension, dyslipidemia, and physical activity, which are factors related to kidney disease.
In this study, we measured the GFR using the MDRD formula for the Korean population to evaluate kidney function. While the direct measurement of GFR is considered to be the most accurate way to detect changes in kidney function, direct measurement requires special skills and involves complex measurements. Therefore, the eGFR is often used in clinical practice. The MDRD formula was derived from studies on the relationship between protein intake and kidney failure progression in patients with CKD in the United States. However, since the MDRD formula was derived mainly from research conducted in populations of European descent, the accuracy of the formula was not verified for other races26,27. In 2010, a Korean MDRD formula was developed,
allowing for more accurate GFR measurement in Koreans than that with the conventional MDRD formula19.
We observed a dose–response relationship between uric acid levels and kidney function in both sexes. Our results indicate that an increasing uric acid level is significantly associated with an increased odds ratio of decreased kidney function. These results are similar to those of earlier studies confirming that high uric acid levels are a risk factor for kidney dysfunction15,27–29. Animal studies have also shown that elevated blood uric
acid levels can cause kidney damage26,30.
Table 2. Odds ratio for decreased kidney function. ªModification of Diet in Renal Disease estimated
glomerular filtration rate for Korean population (mL/min per 1.73 m2) = 107.904 × (Creatinine in mg/
dL)−1.009 × (age)−0.02 × 0.667 [if female]. b OR adjusted for all sociodemographic, economic, health-related
factors considered in the study. Q1: < 4.80 mg/dL, < 3.70 mg/dL; Q2: 4.80–5.49 mg/dL, 3.70–4.19 mg/dL; Q3: 5.50–6.09 mg/dL, 4.20–4.79 mg/dL; Q4: 6.10–6.99 mg/dL, 4.80–5.99 mg/dL; Hyperuricemia: ≥ 7.00 mg/ dL, ≥ 6.00 mg/dL, respectively. d BMI body mass index; Obesity status defined by BMI based on 2018 Clinical
Practice Guidelines for Overweight and Obesity in Korea. e Three groups (white, pink, blue) based on the
International Standard Classification Occupations codes. Unemployed group includes housewives.
Variables
Kidney function: eGFR (mL/min per 1.73 m2)ª
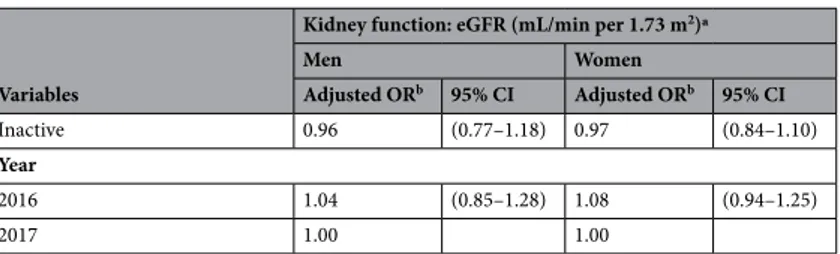
Men Women Adjusted ORb 95% CI Adjusted ORb 95% CI Inactive 0.96 (0.77–1.18) 0.97 (0.84–1.10) Year 2016 1.04 (0.85–1.28) 1.08 (0.94–1.25) 2017 1.00 1.00
Figure 1. Subgroup analysis presenting odds ratio for decreased kidney function stratified by covariates in (A)
men, (B) women. †Analysis was adjusted for all sociodemographic, economic, health-related factors considered
Although there is controversy about the association between uric acid levels and CKD, there are several pos-sible mechanisms by which higher uric acid levels could play a role in the development of CKD. According to previous studies, increased levels of uric acid, especially hyperuricemia, can contribute to endothelial dysfunction by inducing antiproliferative effects on the endothelium and inhibiting the production of nitric oxide31–33. Over
time, damage to the lining of the blood vessels can lead to CKD34. A cohort study indicated that early treatment
of hyperuricemia could potentially control CKD35.
Women had a slightly higher risk of kidney dysfunction than men, which is consistent with the findings of previous studies20,36,37. However, other studies have reported that gout and hyperuricemia affect men more
commonly38. This is possibly related to the female hormone estrogen, which increases uric acid clearance; indeed,
premenopausal women have lower uric acid levels than men, and uric acid levels in women start to rise in the fifth decade of life38–40. In particular, kidney function was significantly reduced in both men and women in the
hyperuricemia group. Patients with CKD often have hyperuricemia29,41,42. A recent study revealed that even
asymptomatic hyperuricemia that does not develop into gout can affect kidney function unless it is treated with uric acid-lowering drugs43.
BMI and waist circumference are known to affect uric acid levels44. Our subgroup analysis revealed that
women with overweight and abdominal obesity have a more pronounced association with kidney disease. Previ-ous studies have also shown that people with obesity have a higher risk of kidney disease45. In addition, uric acid
levels and the likelihood of kidney disease development increased with age, as in previous research studies46.
Diabetes, hypertension, and dyslipidemia are also powerful risk factors for kidney disease6,34,47. In addition,
physical activity was found to be positively associated with kidney function48,49.
This study has several limitations that should be considered when interpreting the results. First, cross-sec-tional data cannot be used to infer any causal relationships. However, unlike a previous cross-seccross-sec-tional study that utilized hospitalized patients50, our study explored the relationship between uric acid level and kidney
func-tion using nafunc-tionally representative samples of South Korea. Further research is still needed to characterize the longitudinal relationship between uric acid levels and kidney diseases in the South Korean population. Second, factors related to health and behavior, including previously diagnosed diseases, were self-reported. Thus, the possibility of recall bias cannot be discarded, despite the efforts of the surveying agency to reduce such bias. Third, although we adjusted for covariates related to uric acid levels and kidney function, the confounding effect cannot be completely excluded because other confounding variables might exist. Particularly, we did not consider the use of uric acid-lowering drugs such as allopurinol and febuxostat. Fourth, additional formulas, such as the Chronic Kidney Disease Epidemiology Collaboration (CKD-EPI) equation, are available for measuring the eGFR. However, this study did not compare the differences in results using different formulas.
Despite these limitations, our research has several strengths. The use of nationally representative data allows our results to be generalized to the general adult population of South Korea. To the best of our knowledge, few studies has been conducted to investigate the association between uric acid levels and kidney function in the Korean population. Thus, this study is meaningful in that it investigated the correlation between uric acid levels and kidney function according to sex. Furthermore, blood samples were collected using standardized laboratory procedures, thus ensuring an accurate estimate of serum creatinine and uric acid levels.
Conclusion
Our study demonstrated a significant inverse association between high uric acid level and kidney function in the South Korean population. In particular, in the analysis stratified by obesity status, the association was stronger in BMI ≥ 23 group and abdominally obese participants compared with the normal group. Our research shows that uric acid level has a potential role in developing kidney disease. This could help health policymakers and professionals to implement strategies of prevention and intervention for CKD, such as blood screening for patients at a high risk of CKD.
Received: 10 February 2020; Accepted: 13 November 2020
References
1. Nasri, H. World Kidney Day 2014; Chronic kidney disease and aging: a global health alert. Iran. J. Public Health 43, 126–127 (2014). 2. Couser, W. G., Remuzzi, G., Mendis, S. & Tonelli, M. The contribution of chronic kidney disease to the global burden of major
noncommunicable diseases. Kidney Int. 80, 1258–1270. https ://doi.org/10.1038/ki.2011.368 (2011).
3. Feehally, J. Health burden of kidney disease recognized by UN. Nat. Rev. Nephrol. 8, 12–13. https ://doi.org/10.1038/nrnep h.2011.191
(2012).
4. Oh, T. R. et al. Association between health related quality of life and progression of chronic kidney disease. Sci. Rep. 9, 19595. https ://doi.org/10.1038/s4159 8-019-56102 -w (2019).
5. Jha, V. et al. Chronic kidney disease: global dimension and perspectives. Lancet 382, 260–272. https ://doi.org/10.1016/S0140 -6736(13)60687 -X (2013).
6. Gansevoort, R. T. et al. Chronic kidney disease and cardiovascular risk: epidemiology, mechanisms, and prevention. Lancet 382, 339–352. https ://doi.org/10.1016/S0140 -6736(13)60595 -4 (2013).
7. Remuzzi, G., Ruggenenti, P. & Perico, N. Chronic renal diseases: renoprotective benefits of renin–angiotensin system inhibition.
Ann. Intern. medicine 136, 604–615 (2002).
8. Fox, C. S. et al. Predictors of new-onset kidney disease in a community-based population. JAMA 291, 844–850 (2004). 9. Levey, A. S. et al. National Kidney Foundation practice guidelines for chronic kidney disease: evaluation, classification, and
strati-fication. Ann. Intern. Med. 139, 137–147 (2003).
10. Haroun, M. K. et al. Risk factors for chronic kidney disease: a prospective study of 23,534 men and women in Washington county, Maryland. J. Am. Soc. Nephrol. 14, 2934–2941. https ://doi.org/10.1097/01.Asn.00000 95249 .99803 .85 (2003).
11. Kazancioğlu, R. Risk factors for chronic kidney disease: an update. Kidney Int. Suppl. 3, 368–371. https ://doi.org/10.1038/kisup .2013.79 (2013).
12. Kim, S. et al. The prevalence of chronic kidney disease (CKD) and the associated factors to CKD in urban Korea: a population-based cross-sectional epidemiologic study. J. Korean Med. Sci. 24(Suppl), S11–S21. https ://doi.org/10.3346/jkms.2009.24.S1.S11
(2009).
13. Bellomo, G. et al. Association of uric acid with change in kidney function in healthy normotensive individuals. Am. J. Kidney Dis. 56, 264–272. https ://doi.org/10.1053/j.ajkd.2010.01.019 (2010).
14. Oh, T. R. et al. Hyperuricemia has increased the risk of progression of chronic kidney disease: propensity score matching analysis from the KNOW-CKD study. Sci. Rep. 9, 6681. https ://doi.org/10.1038/s4159 8-019-43241 -3 (2019).
15. Obermayr, R. P. et al. Elevated uric acid increases the risk for kidney disease. J. Am. Soc. Nephrol. 19, 2407–2413. https ://doi. org/10.1681/asn.20080 10080 (2008).
16. Ryoo, J.-H., Choi, J.-M., Oh, C.-M. & Kim, M.-G. The association between uric acid and chronic kidney disease in Korean men: a 4-year follow-up study. J. Korean Med. Sci. 28, 855–860 (2013).
17. Stack, A. G. et al. Gout and the risk of advanced chronic kidney disease in the UK health system: a national cohort study. BMJ
Open 9, e031550. https ://doi.org/10.1136/bmjop en-2019-03155 0 (2019).
18. Kweon, S. et al. Data resource profile: the Korea national health and nutrition examination survey (KNHANES). Int. J. Epidemiol. 43, 69–77. https ://doi.org/10.1093/ije/dyt22 8 (2014).
19. Lee, C. S. et al. Ethnic coefficients for glomerular filtration rate estimation by the modification of diet in renal disease study equa-tions in the Korean population. J. Korean Med. Sci. 25, 1616–1625 (2010).
20. Fang, J. & Alderman, M. H. Serum uric acid and cardiovascular mortalitythe NHANES I epidemiologic follow-up study, 1971–1992.
JAMA 283, 2404–2410. https ://doi.org/10.1001/jama.283.18.2404 (2000).
21. Bae, J. S. et al. The impact of serum uric acid level on arterial stiffness and carotid atherosclerosis: the Korean multi-rural com-munities cohort study. Atherosclerosis 231, 145–151. https ://doi.org/10.1016/j.ather oscle rosis .2013.08.017 (2013).
22. Oh, S. S., Jang, J.-E., Lee, D.-W., Park, E.-C. & Jang, S.-I. Cigarette type or smoking history: Which has a greater impact on the metabolic syndrome and its components?. Sci. Rep. 10, 10467. https ://doi.org/10.1038/s4159 8-020-67524 -2 (2020).
23. Korea, S. Korean standard classification of occupations. (2000).
24. Lee, S. et al. Cut-off points of waist circumference for defining abdominal obesity in the Korean population. Korean J. Obes. 15, 1–9 (2006).
25. An, K.-Y. Physical activity level in Korean adults: the Korea national health and nutrition examination survey 2017. Epidemiol.
Health 41, e2019047–e2019047. https ://doi.org/10.4178/epih.e2019 047 (2019).
26. Teo, B. W. et al. GFR estimating equations in a multiethnic Asian population. Am. J. Kidney Dis. 58, 56–63. https ://doi.org/10.1053/j. ajkd.2011.02.393 (2011).
27. Satirapoj, B. et al. Relationship between serum uric acid levels with chronic kidney disease in a Southeast Asian population.
Nephrology (Carlton) 15, 253–258. https ://doi.org/10.1111/j.1440-1797.2009.01179 .x (2010).
28. Mohandas, R. & Johnson, R. J. Uric acid levels increase risk for new-onset kidney disease. J. Am. Soc. Nephrol. 19, 2251–2253. https ://doi.org/10.1681/ASN.20080 91012 (2008).
29. Chonchol, M. et al. Relationship of uric acid with progression of kidney disease. Am. J. Kidney Dis. 50, 239–247. https ://doi. org/10.1053/j.ajkd.2007.05.013 (2007).
30. Mazzali, M. et al. Hyperuricemia induces a primary renal arteriolopathy in rats by a blood pressure-independent mechanism. Am.
J. Physiol. Renal Physiol. 282, F991–F997. https ://doi.org/10.1152/ajpre nal.00283 .2001 (2002).
31. Khosla, U. M. et al. Hyperuricemia induces endothelial dysfunction. Kidney Int. 67, 1739–1742. https ://doi.org/10.111 1/j.1523-1755.2005.00273 .x (2005).
32. Kanellis, J. & Kang, D.-H. Uric acid as a mediator of endothelial dysfunction, inflammation, and vascular disease. Semin. Nephrol. 25, 39–42. https ://doi.org/10.1016/j.semne phrol .2004.09.007 (2005).
33. Kang, D.-H. et al. A role for uric acid in the progression of renal disease. J. Am. Soc. Nephrol. 13, 2888–2897 (2002).
34. Malyszko, J. Mechanism of endothelial dysfunction in chronic kidney disease. Clin. Chim. Acta 411, 1412–1420. https ://doi. org/10.1016/j.cca.2010.06.019 (2010).
35. Mok, Y. et al. Serum uric acid and chronic kidney disease: the Severance cohort study. Nephrol. Dial. Transpl. 27, 1831–1835. https ://doi.org/10.1093/ndt/gfr53 0 (2011).
36. Levine, W., Dyer, A. R., Shekelle, R. B., Schoenberger, J. A. & Stamler, J. Serum uric acid and 11.5-year mortality of middle-aged women: findings of the Chicago heart association detection project in industry. J. Clin. Epidemiol. 42, 257–267. https ://doi. org/10.1016/0895-4356(89)90061 -9 (1989).
37. Carrero, J.-J., Hecking, M., Ulasi, I., Sola, L. & Thomas, B. Chronic kidney disease, gender, and access to care: a global perspective.
Semin. Nephrol. 37, 296–308. https ://doi.org/10.1016/j.semne phrol .2017.02.009 (2017).
38. Akizuki, S. Serum uric acid levels among thirty-four thousand people in Japan. Ann. Rheumat. Dis. 41, 272–274. https ://doi. org/10.1136/ard.41.3.272 (1982).
39. Nan, H. et al. The prevalence of hyperuricemia in a population of the coastal city of Qingdao, China. J. Rheumatol. 33, 1346–1350 (2006).
40. Mikkelsen, W. M., Dodge, H. J., Valkenburg, H. & Himes, S. The distribution of serum uric acid values in a population unselected as to gout or hyperuricemia: Tecumseh, Michigan 1959–1960. Am. J. Med. 39, 242–251. https ://doi.org/10.1016/0002-9343(65)90048 -3 (1965).
41. Ohno, I. Relationship between hyperuricemia and chronic kidney disease. Nucleosides Nucleotides Nucleic Acids 30, 1039–1044.
https ://doi.org/10.1080/15257 770.2011.61148 4 (2011).
42. Li, L. et al. Is hyperuricemia an independent risk factor for new-onset chronic kidney disease?: a systematic review and meta-analysis based on observational cohort studies. BMC Nephrol. 15, 122. https ://doi.org/10.1186/1471-2369-15-122 (2014). 43. Sato, Y. et al. The case for uric acid-lowering treatment in patients with hyperuricaemia and CKD. Nat. Rev. Nephrol. 15, 767–775.
https ://doi.org/10.1038/s4158 1-019-0174-z (2019).
44. Ritz, E. Metabolic syndrome and kidney disease. Blood Purif. 26, 59–62. https ://doi.org/10.1159/00011 0566 (2008).
45. Postorino, M., Marino, C., Tripepi, G. & Zoccali, C. Abdominal obesity and all-cause and cardiovascular mortality in end-stage renal disease. J. Am. Coll. Cardiol. 53, 1265–1272. https ://doi.org/10.1016/j.jacc.2008.12.040 (2009).
46. Lai, S. W., Tan, C. K. & Ng, K. C. Epidemiology of hyperuricemia in the elderly. Yale J. Biol. Med. 74, 151–157 (2001).
47. Bakris, G. L. & Ritz, E. The message for World Kidney Day 2009: hypertension and kidney disease—a marriage that should be prevented. J. Hum. Hypertens. 23, 222–225. https ://doi.org/10.1038/jhh.2008.169 (2009).
48. Hawkins, M. S. et al. Association between physical activity and kidney function: national health and nutrition examination survey.
Med. Sci. Sports Exerc. 43, 1457–1464. https ://doi.org/10.1249/MSS.0b013 e3182 0c013 0 (2011).
49. Beddhu, S., Baird, B. C., Zitterkoph, J., Neilson, J. & Greene, T. Physical activity and mortality in chronic kidney disease (NHANES III). Clin. J. Am. Soc. Nephrol. 4, 1901. https ://doi.org/10.2215/CJN.01970 309 (2009).
50. Jung, D.-H., Lee, Y.-J., Lee, H.-R., Lee, J.-H. & Shim, J.-Y. Association of renal manifestations with serum uric acid in Korean adults with normal uric acid levels. J. Korean Med. Sci. 25, 1766–1770 (2010).
Author contributions
H.J.J., G.R.K., D.-W.C., J.H.J., and E.-C.P. contributed to the study concept and design. H.J.J., G.,R.K. analyzed and interpreted the data. H.J.J. wrote the manuscript. H.J.J., G.R.K., D.-W.C., J.H.J., and E.-C.P. critically revised the manuscript for important intellectual content. All authors approved the final version of the manuscript submitted.
Competing interests
The authors declare no competing interests.
Additional information
Supplementary information is available for this paper at https ://doi.org/10.1038/s4159 8-020-77702 -x.
Correspondence and requests for materials should be addressed to E.-C.P. Reprints and permissions information is available at www.nature.com/reprints.
Publisher’s note Springer Nature remains neutral with regard to jurisdictional claims in published maps and
institutional affiliations.
Open Access This article is licensed under a Creative Commons Attribution 4.0 International
License, which permits use, sharing, adaptation, distribution and reproduction in any medium or format, as long as you give appropriate credit to the original author(s) and the source, provide a link to the Creative Commons licence, and indicate if changes were made. The images or other third party material in this article are included in the article’s Creative Commons licence, unless indicated otherwise in a credit line to the material. If material is not included in the article’s Creative Commons licence and your intended use is not permitted by statutory regulation or exceeds the permitted use, you will need to obtain permission directly from the copyright holder. To view a copy of this licence, visit http://creat iveco mmons .org/licen ses/by/4.0/.