1404
ⓒ The Korean Society of Food Science and Technology
Investigation on the Functional Properties of Chestnut Flours and
Their Potential Utilization in Low-fat Cookies
Ayse N. Inkaya1,Duygu Gocmen1, Serpil Ozturk2, and Hamit Koksel*
Faculty of Engineering, Department of Food Engineering, Hacettepe University, 06800, Beytepe-Ankara, Turkey 1Faculty of Agriculture, Department of Food Engineering, Uludag University, 16059, Gorukle-Bursa, Turkey 2Faculty of Engineering, Department of Food Engineering, Sakarya University, 54187, Esentepe-Sakarya, Turkey
Abstract Chestnut flours (CFs) were produced from 3 chestnut samples (Aydin, Kutahya, and Bursa) by 2 different methods
(boiled and oven-dried: BOD-CF and freeze-dried: FD-CF). Functional properties and effects of CF addition (10, 20, and 30%) on the qualities of regular and low-fat cookie were investigated. The freeze drying significantly increased water solubility of CFs but decreased their water binding capacity. The emulsion capacity and stability of FD-CFs were higher than those of BOD-CFs. At pH 4, 6, 8, and 10 FD-CFs had better gelation properties. Spread ratio (SR) values of BOD-CF supplemented regular or low-fat cookies decreased with increasing CF levels. Hardness values of CF supplemented regular cookies were generally lower compared to control. SR and hardness values of FD-CF supplemented cookies were higher than those of CF supplemented ones. Surface colors of the cookies were darker with FD-CF addition as compared to BOD-CF addition. In low-fat cookies, the sample supplemented with 10% Kutahya BOD-CF had the highest taste-flavor value. FD-CF supplementation generally resulted in higher appearance and taste-flavor scores than BOD-FD-CF supplementation in cookies.
Keywords: chestnut, cookie, emulsion, foaming
Inroduction
Chestnuts (Castanea sativa Mill) are consumed after
roasting or cooking in water. On the other hand, chestnut purees and flours are also used to make jam, pastry, polenta, and special breads (1). Chestnuts are rich in carbohydrates, and are also a good source of essential fatty acids and minerals (K, Mg, Fe, Mn, and Cu). In addition, they contain several vitamins and appreciable levels of fiber (2,3). Chestnuts and chestnut-based foods thus have beneficial nutritional and organoleptic qualities (1). Künsch
et al. (3) recognized these fruits as an excellent source of
starch and found higher values than potatoes, wheat, and walnuts. Due to the low fat content when compared with other tree nuts such as almonds, hazelnuts, and walnuts, chestnut has low caloric value, which makes it an interesting healthy food (2,4).
Chestnut flour (CF) is produced from chestnuts that are dried for several hours in a flow of hot air, shelled, picked over either mechanically or by hand to remove discolored chestnuts, and then crushed with a stone or hammer mill. The CF can be stored for several months at room temperature or several years at 4oC before use and/or sale. The
biochemical composition of CF is similar to that of many cereals. Starch is the main component of CF, while its protein and lipid contents, as well as its mineral and vitamin contents (B1, E, and C), all make CF an excellent substitute for people on a gluten-free diet. The commercial usage of CF has been increasing in bakery industry, especially in European countries. It can be added to cakes,
breads, muffins, cookies, and pancakes as an ingredient (1). The cookies are products made from soft wheat flour and are characterized by a formula high in sugar and shortening and relatively low in water (5). Fat forms one of the basic components of a cookie formulation and is present at relatively high levels. Fat acts as a lubricant and contributes to the plasticity of the cookie dough (6). Mechanical properties of cookies are largely dependent on the fat component of the formulation. The type and amount of fat added to the dough has a strong effect on the viscoelastic properties. Reducing the fat content or substituting liquid oil for solid caused a marked decrease in the stiffness of the dough which implies that fat is a crucial structural component (7). High fat intake is associated with various health disorders such as obesity, cancer, high blood cholesterol, and coronary heart disease (8). In spite of the important roles played by fat, there have been continued efforts to reduce the fat content in food products and replace it with various fat replacers (9).
In recent years, the consumers have been interested in chestnuts because of their nutritional quality and potential health benefits. Cereal flours can be supplemented by chestnut flours to improve nutritional value. In the literature, there is limited amount of information related to the utilization of chestnut flours in bakery products and its functional properties. Therefore, this study was designed to investigate the effects of freeze-drying and oven-drying on the functional properties of chestnut flours and their potential utilization in regular and low-fat cookies. Materials and Methods
Materials Commercial soft wheat flour (Toru Flour Milling Co., Ltd., Bandırma, Turkey) was used in cookie production. Three chestnut samples were obtained from 3
*Corresponding author: Tel: +90 312 297 7107; Fax: + E-mail: [email protected]
Received May 22, 2009; Revised August 14, 2009; Accepted September 14, 2009
different growing regions of Turkey (Aydin, Bursa, and Kutahya). All of the other ingredients were supplied by a cookie processing company (Ulker Co., Ankara, Turkey).
Preparation of chestnut flour Chestnut flours were produced by 2 different methods. In the first method; raw chestnuts were washed and boiled for 10 min and manually peeled in order to separate the kernel from the shell and tan. They were cooled to room temperature and broken into pieces by blender (HR 7620; Philips, Hong Kong, China) and then dried in an oven at 45oC for 40 hr. The
dried samples were ground by a cyclone mill (Simsek Laborteknik, Ankara, Turkey) and sieved through 212-µm
sieve. This product is called ‘boiled and oven-dried chestnut flour’ (BOD-CF). In the second method; raw chestnuts were manually peeled in order to separate the kernel from the shell. They were immersed into 10% NaOH solution for 5 min and then manually peeled in order to separate the kernel from the tan. Subsequently chestnuts were washed with water and broken into pieces by a blender (HR 7620; Philips) and then a coffee grinder. The samples were freeze-dried (Hetosicc, Heto Birkeröd, Denmark) for 10 hr and ground by a cyclone mill (Simsek Laborteknik) and sieved through 212-µm sieve. This
product is called ‘freeze-dried chestnut flour’ (FD-CF). The dried samples were placed in glass jars and kept in a refrigerator prior to analyses.
Analytical methods Moisture, ash, protein, and wet gluten contents of the soft wheat flour were determined according to AACCI Approved Methods 44-01, 08-01, 46-12, and 38-10, respectively (10). Moisture (Method 925-40), ash (Method 950-49), protein (Method 950-48), total lipid (Method 948-22), and total reducing sugar (Method 950.50) contents of CF were determined using the AOAC Standard Methods (11). The tests were performed at least in triplicate and mean values are reported.
Functional properties of CF The water solubility and water binding capacity values of the CF samples were determined according to Singh and Singh (12) as modified by Koksel et al. (13). Emulsion capacity and emulsion
stability values of the CF samples were determined according to Ahmedna et al. (14) as modified by Bilgi and Celik (15)
and Koksel et al. (13).
Protein solubility properties of CF samples were investigated according to the method of Casella and Whitaker (16) with slight modifications. Protein solubility was tested at pH 6 at the concentration of 10%(w/v). The pH of suspension was adjusted to 6 and the suspension was stirred at room temperature for 1 hr on a magnetic stirrer. Then, they were centrifuged (Heraeus Labofuge, Manau, Germany) at 1,600×g for 40 min at 20oC and the supernatant
was filtered through a Whatman No. 1 filter paper (Whatman International Ltd., Kent, UK). The amount of soluble protein in the filtrate was determined by Lowry et al. (17) with bovine serum albumin (BSA) as the standard.
Foaming properties of the CF samples were determined according to Ibanoglu and Ibanoglu (18) and Yalcin et al.
(19). Foaming properties were determined at pH 6 at the concentration of 10%(w/v). The pH of suspension was adjusted with 0.5 M HCl or 0.5 M NaOH while the
mixture was stirred constantly for 1 hr at room temperature and they were centrifuged (Heraeus Labofuge) at 1,600×g
for 40 min at 20oC. The supernatant was filtered through a
Whatman No. 1. The samples were foamed in a glass sintered column of 21-cm in length and 5-cm in internal diameter. The sintered glass filter (Schott, Mainz, Germany) had a pore size range as 16-40µm. A 10 mL sample solution was
sparged with dry air at a constant flow rate 0.5 L/min for 10 sec. After turning off the air, foam height was measured. Foaming capacity was described as foam volume (cm3).
Foam stability is expressed as the time (sec) for the initial foam volume to reduce into its half value.
Gelation properties were determined according to Coffman and Garcia (20), and Adebowale and Lawal (21). CF dispersions (10mL) in distilled water with the concentrations of 2, 4, 6, 8, 10, 12, 14, 16, 18, and 20%(w/v) were prepared at 2.0-10.0 pH range. The dispersions were heated in a boiling water bath for 1 hr, followed by rapid cooling in a cold water bath and they were left to set at 4oC
for 2 hr. The lowest gelation concentration was determined as the concentration at which the sample from the inverted tube did not fall or slip.
The results are reported as means of duplicate analyses.
Preparation and quality evaluation of cookies The qualities of regular and low-fat cookies supplemented with BOD-CF and FD-CF were determined by AACCI Method No. 10-54, Baking Quality of Cookie Flour-Micro Wire-Cut Formulation (10). CFs were used to replace flour in the formulation at the levels of 10, 20, and 30%(w/w). In the formulation of the regular cookies, fat was used at the level of 32% (flour basis, w/w) and fat content was reduced by 30% (from 32 to 22.4%) in the low-fat cookies. Control samples including no CF were also prepared. Four cookies were prepared per bake. The baked cookies were left to be cool, wrapped, and allowed to stand at room temperature prior to analyses.
The quality parameters of the cookies were evaluated in terms of diameter (D), thickness (T), spread ratio (D/T), color, and hardness values. After cooling of the cookies for 30 min, diameter and thickness measurements were taken using a caliper. CIE color values (L*, a*, and b*) were measured with a Minolta spectrophotometer CM-3600d (Osaka, Japan). The L* value indicates the lightness, 0-100 representing dark to light. The a* value gives the degree of the red-green color, with a higher positive a* value indicating more red. The b* value indicates the degree of the yellow-blue color, with a higher positive b* value indicating more yellow. A texture analyzer (TA Plus; Lloyd Instruments, Fareham, UK) equipped with a 3-point bending jig was used for texture analysis and the maximum force (N) required to break the cookie sample was determined 24 hr after baking. A load cell of 1,000 N was used and the span between the supports was 40 mm. The sensory characteristics of the cookies were screened by a 13-member panel. The instructions were given in full to panelists beforehand. The samples were labeled randomly with 2-digit numbers and evaluated under incandescent light in terms of appearance, taste-flavor, and mouthfeel of the cookies. All of the parameters were evaluated by a score of 1-9, 9 being the most desirable. Final judgment was obtained by averaging the scores given by all panelists.
Statistical evaluation Data were analyzed for variance
using the one-way analysis of variance (ANOVA). When significant differences were found (p<0.05), the least
significant difference (LSD) test was used to determine the differences among means. Paired t-test was carried out to
compare the properties of BOD-CF and FD-CF supplemented cookies.
Results and Discussion
Properties of wheat flour and chestnut flours The
commercial soft wheat flour used in this study consisted of 12.8% moisture, 10.0% protein, 0.55% ash, 23.7% wet gluten, and its sedimentation value was 18 mL.
Chemical compositions of the chestnut flour (CF) samples are presented in Table 1. The composition of CFs produced from chestnuts grown in different regions and dried under different conditions showed significant differences (p<0.05).
The chemical compositions of the CFs are generally close to the previously published data (22,23). The protein contents of the CF samples in the present study varied between 3.8 and 5.3%. The protein content of all FD-CF samples were significantly lower than those of all BOD-CF samples (p<0.05). The protein contents of the CFs
determined by Sacchetti and Pinnavaia (22) and Sacchetti
et al. (23) were 8.25 and 6.92%, respectively. These values
were higher than the ones in the present study. The lipid contents of the CFs obtained in this study were found to be between 2.70-3.11%. These values were within the same range reported by Sacchetti and Pinnavaia (22) and Sacchetti et al. (23). Ash contents measured in the present
study were higher than those obtained by Sacchetti and Pinnavaia (22), and Sacchetti et al. (23). The reducing
sugar contents of all samples were determined to be lower than the levels measured by Correia et al. (24) but were
similar to those obtained by Sacchetti and Pinnavaia (22) and Sacchetti et al. (23). The reducing sugar contents of the
FD-CF samples were significantly higher than those of the BOD-CF (p<0.05) . This might be due to the loss of simple
sugars during boiling stage of the BOD-CF production. The minor differences in chemical composition of the CF samples with the ones reported in the literature might be due to the differences of chestnut genotypes, growing locations, and chestnut flour processing method.
Functional properties of chestnut flours Water solubility
(WS), water binding capacity (WBC), emulsion capacity (EC), emulsion stability (ES), foaming capacity, and foam stability values of the chestnut flour samples (CFs) are presented in Table 2. The WS values of the CFs varied from 16.4 to 31.8%. The WS values of the FD-CFs were significantly higher than those of the BOD-CFs (p<0.05).
The lyophilization treatment used in FD-CF production increased the water solubility of the CFs. The WBC values of BOD-CFs were significantly higher than those of FD-CFs (p<0.05). This can be attributed to the boiling step
used in BOD-CF production which might cause substantial changes in the properties of starch and proteins. As starch gelatinizes, its water binding capacity increases significantly (5). Dissociated protein subunits, derived from major proteins by heating, might also have more water binding sites than the native proteins (25).
In many food systems, the interaction between protein and lipids determines their ability to form stable emulsions. Due to their amphiphilic nature, proteins can stabilize emulsions. The emulsifying properties of a protein depends on the rate at which it diffuses into the interface, on its adsorbability at the interface, and on the deformability of its conformation under the influence of interfacial tension (26). The emulsifying properties of proteins contribute much to their functionality in foods (27). In the present study, significant variation was noted in the emulsion capacity (EC) and emulsion stability (ES) values of the
Table 1. Chemical compositions (g/100 g d.b.) of chestnut flours
Sample1) Moisture Protein
(N 5.3) Ash Totallipid Reducingsugar Aydin BOD-CF 9.54c2) 4.3c 3.00b 2.70e 1.44e Aydin FD-CF 9.35d 3.8f 3.03a 3.03b 2.02c Kutahya BOD-CF 7.61f 4.8b 2.68d 3.03b 1.69d Kutahya FD-CF 8.75e 4.0d 2.70d 2.76d 2.39a Bursa BOD-CF 9.99a 5.3a 2.74c 2.81c 1.46e Bursa FD-CF 9.58b 3.9e 2.63e 3.11a 2.30b 1)BOD, boiled and oven-dried;FD, freeze-dried; CF, chestnut flour. 2)Means followed by different letters within each column are signifi-cantly different using the LSD test (p<0.05).
Table 2. Functional properties and gelation concentrations of chestnut flours
Sample1) solubilityWater (%) Water binding capacity (%) Emulsion
capacity Emulsion stability (%) Foaming capacity (cm3) Foam stability (sec) Gelation concentration2) (%) pH 2 pH 4 pH 6 pH 8 pH 10
Aydin BOD-CF 16.4d 172.0a3) 20.5b 10.1b - - 12 8 10 10 10
Aydin FD-CF 28.6b 151.6b 51.4a 55.5a 117.8a 32a 16 4 04 08 08
Kutahya BOD-CF 19.4c 177.5a 15.0c 11.6b - - 12 8 08 10 10
Kutahya FD-CF 29.9ab 124.7c 50.5a 54.8a 117.8a 25b 18 4 04 06 08
Bursa BOD-CF 20.5c 163.3ab 05.7d 04.9c - - 14 8 10 08 10
Bursa FD-CF 31.8a 121.6c 53.2a 53.9a 121.1a 33a NG 6 08 06 08
1)BOD, boiled and oven-dried;FD, freeze-dried; CF, chestnut flour.
2)Minimum gelation concentration expressed as %(w/v); NG, no gelation observed.
CFs produced with different drying methods (p<0.05). The
EC and ES values of the FD-CFs were significantly higher than those of the BOD-CFs (p<0.05), which could be due
to the thermal denaturation of proteins during the boiling step used in BOD-CF production.
In several foods, for example, baked goods, sweets, desserts, and beer, proteins function as foam-forming and foam-stabilizing components. The ideal foam-forming and foam-stabilizing protein is characterized by a low molecular weight, high surface hydrophobicity, good solubility, a small net charge at the pH of the food, and easy denaturability (26). In the present study, FD-CS samples were found to have similar foaming capacity values. Foam stability of Kutahya FD-CF was lower than those of Aydin and Bursa FD-CF samples. BOD-CF samples did not have a measurable foaming capacity, this could be due to heat denaturation of proteins during the BOD-CF production. Soluble protein contents of FD-CF and BOD-CF samples were 3.4 and 0.8 mg/mL, respectively. Lower protein solubility values of BOD-CF samples supported their lack of foaming capacity. A similar effect of heat on different flours has been reported by Akubor et al. (27) and Yusuf et al. (28).
Gelation concentrations of chestnut flours at different pH are presented in Table 2. Lower gelation concentation (GC) values indicate better gelation properties (21). Aydın
FD-CF and Kutahya FD-CF resulted in the lowest GC value (4%) at pH 4 and 6. The highest GC values of all CFs were determined at pH 2. Bursa FD-CF sample did not form a gel at pH 2. BOD-CF samples had better gelation properties at pH 2. On the contrary, FD-CFs demonstrated better gelation properties at pH 4, 6, 8, and 10. A similar pH dependence for gelation capacity has previously been reported by Adebowale and Lawal (21) for different bean samples.
Effects of chestnut flour supplementatin on the quality of regular cookies The diameter, spread ratio (SR), hardness, and color values of regular cookies supplemented with varying levels of BOD-CF and FD-CF are presented in Table 3. SR values of BOD-CF supplemented regular cookies decreased significantly in all chestnut samples at all levels (p<0.05). Only 10% Kutahya BOD-CF
supplementation had no effect on the SR value. Although the SR values of the cookies supplemented with 20 and 30% Aydin and Bursa FD-CF decreased significantly (p<0.05), the SR values of the cookies supplemented with
10% Kutahya and Bursa FD-CF increased significantly (p<0.05). Furthermore, the SR values of FD-CF supplemented
cookies were higher than those of BOD-CF supplemented cookies as determined by the paired t-test (p<0.05).
Table 3. Effects of chestnut flour addition on quality characteristics of regular cookies
Sample1) Addition level
(%) Diameter(cm) Spread ratio Hardness (N) CIE color value 2) L* a* b* Aydin BOD-CF 0 8.07a3) 8.41a 46.0a 70.1a 6.42c 32.0a 10 7.76b 7.68b 41.2ab 68.1b 7.32c 30.6b 20 7.28c 6.93c 37.1ab 66.6c 8.25b 29.0c 30 7.03d 6.39d 30.5b 66.8c 8.39a 27.2d Aydin FD-CF 0 8.07a 8.41a 46.0a 70.1a 6.42c 32.0a 10 8.08a 8.96a 37.1a 65.6b 8.79b 32.3a 20 7.75b 7.45b 41.5a 62.4c 10.42a 31.9a 30 7.51c 7.22b 50.5a 61.5c 10.60a 30.6b Kutahya BOD-CF 0 8.07a 8.41a 46.0a 70.1a 6.42c 32.0a 10 7.77b 8.27a 37.8ab 69.1a 6.41c 30.0b 20 7.30c 7.16b 36.3ab 67.9b 7.42b 29.0c 30 7.10d 6.76c 30.1b 66.7c 8.11a 27.9d Kutahya FD-CF 0 8.07b 8.41b 46.0a 70.1a 6.42c 32.0a 10 8.15a 8.67a 36.1a 66.7b 6.22c 30.3bc 20 8.03bc 8.28b 30.6a 64.5c 7.52b 29.9c 30 7.96c 8.38b 41.4a 60.5d 10.44a 31.1b Bursa BOD-CF 0 8.07a 8.41a 46.0a 70.1a 6.42d 32.0a 10 7.67b 7.83b 43.3ab 67.8b 8.23c 32.3a 20 7.36c 6.94c 43.4ab 66.2c 9.35a 31.1b 30 6.92d 6.41d 34.2b 66.7c 8.70b 28.5c Bursa FD-CF 0 8.07a 8.41b 46.0a 70.1a 6.42c 32.0a 10 8.11a 8.63a 40.5a 66.5b 6.88c 30.3c 20 7.90b 8.14c 43.4a 61.7c 9.69b 31.1b 30 7.91b 8.07c 49.5a 59.0d 10.51a 31.0bc
1)BOD, boiled and oven-dried; FD, freeze-dried; CF, chestnut flour. 2)L*, lightness; a*, redness; b*, yellowness.
Diameter values of the cookies generally followed a similar trend with the SR values.
Among the BOD-CF supplemented samples, only 30% Aydin, Kutahya, and Bursa CF supplementation decreased the hardness values of the cookies significantly (p<0.05).
Other BOD-CF levels had no significant effect on the hardness values of regular cookies. FD-CF supplemantation did not have a deteriorative effect on the hardness values and there was no significant difference between FD-CF supplemantation levels. Furthermore, there was no significant difference between the hardness values of BOD and FD-CF supplemented cookies as determined by the paired t
-test.
The addition of BOD and FD-CF had significant effects on L*, a*, and b* values of regular cookies (p<0.05). In
general, L* and b* values of the cookies supplemented with BOD and FD-CF samples decreased significantly (p<0.05), as the addition level increased. The a* values of
all CF supplemented cookies increased and the a* values of 20 and 30% CF supplemented cookies were higher than that of control. Similar changes in color values were also observed by other investigators who supplemented wheat flour with sugar beet fiber (29, 30), brewers’ spent grain (31), wheat bran, rice bran, oat bran, and barley bran (32). The surface color of the regular cookies supplemented with
FD-CF become darker (L* values decreased and a* values increased) as compared to those of BOD-CF supplemented cookies as determined by the paired t-test (p<0.05). This is
probably due to enzymatic browning reaction occurred in FD-CF samples. Because these samples were not heat treated prior to drying while BOD-CF samples were boiled which is expected to inactivate the polyphenol oxidase enzymes.
Sensory properties of regular cookies prepared with varying levels of BOD-CF and FD-CF are shown in Table 4. BOD-CF supplementation did not have a deteriorative effect on the appearance values except 30% Aydin and Kutahya BOD-CF supplementation levels. On the other hand, the cookies containing 20 and 30% Bursa BOD-CF had the highest appearance values and 30% Bursa BOD-CF addition resulted in significant improving effect on the appearance values. For FD-CF supplemented cookies, none of the supplementation levels had a deteriorative effect on the appearance values. For both BOD and FD-CF supplemented cookies, there were no significant differences in the taste-flavor and mouthfeel values at different supplementation levels indicating that CF addition did not have a deteriorative effect on these sensory properties. Cookies supplemented with FD-CF generally gave higher appearance and lower taste-flavor values than the ones supplemented with BOD-CF as determined by the paired t
-test (p<0.05).
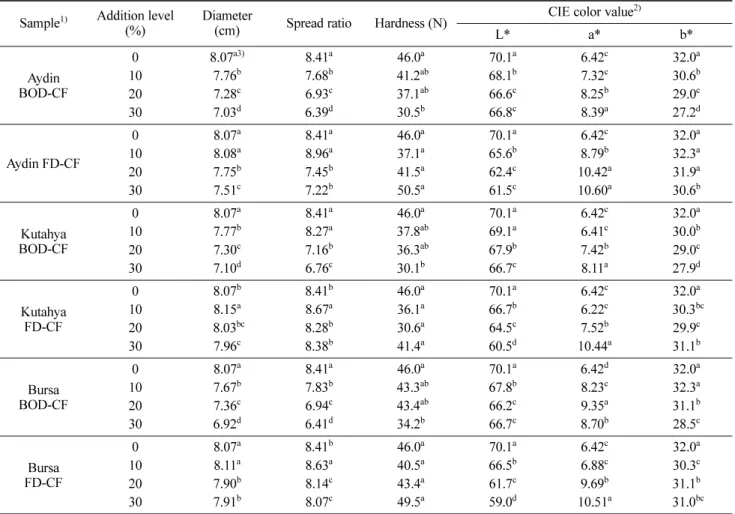
Effects of chestnut flour supplementatin on the quality of low-fat cookies The diameter, SR, hardness, and color values of low-fat cookies supplemented with varying levels of BOD-CF and FD-CF are presented in Table 5. The SR values of BOD-CF supplemented low-fat cookies decreased significantly as compared to control (p<0.05). The SR
values of the cookies supplemented with 20 and 30% Aydin and Bursa BOD-CF decreased significantly (p<0.05),
but the SR of the cookies supplemented with Kutahya BOD-CF did not changed with the addition level. While 10% Aydin FD-CF, 10 and 20% Kutahya FD-CF had no significant effect on the SR values, 20 and 30% Aydin FD-CF, 30% Kutahya FD-CF and 30% Bursa FD-CF significantly decreased the SR values of the low-fat cookies (p<0.05). On the contrary, the SR values significantly
increased with the addition of 10 and 20% Bursa FD-CF as compared to control (p<0.05) and these samples resulted in
the highest SR values among the low-fat cookies supplemented with CF samples. Furthermore, the SR values of FD-CF supplemented low-fat cookies were higher than those of BOD-CF supplemented cookies as determined by the paired t-test (p<0.05). Diameter values
of the cookies generally followed a similar trend with the SR values.
The hardness values of low-fat cookies supplemented with 30% Kutahya and Bursa BOD-CF and 30% Aydin and Kutahya FD-CF decreased significantly. Low-fat cookies supplemented with FD-CF were harder than the cookies supplemented with BOD-CF as determined by the paired t-test (p<0.05).
The addition of BOD and FD-CF had significant effects on L*, a*, and b* values of low-fat cookies (p<0.05). In
general, L* and b* values of the cookies supplemented with BOD and FD-CF decreased significantly (p<0.05), as
Table 4. Effects of chestnut flour addition on sensory properties of regular cookies
Sample1) Addition
level (%) Appearance Taste-flavor Mouthfeel Aydin BOD-CF 0 8.46a2) 8.69a 8.62a 10 8.31a 8.54a 8.46a 20 7.62ab 8.31a 8.46a 30 7.15b 8.46a 8.08a Aydin FD-CF 0 8.46a 8.69a 8.62a 10 8.62a 8.54a 8.77a 20 8.54a 8.54a 8.69a 30 8.31a 8.38a 8.62a Kutahya BOD-CF 0 8.46a 8.69a 8.62a 10 8.23a 8.62a 8.69a 20 8.00a 8.69a 8.69a 30 7.15b 8.77a 8.23a Kutahya FD-CF 0 8.46b 8.69a 8.62a 10 8.85a 8.23a 8.54a 20 8.46b 8.38a 8.69a 30 8.23b 8.46a 8.92a Bursa BOD-CF 0 8.46b 8.69a 8.62a 10 8.39b 8.46a 8.85a 20 8.48ab 8.69a 8.77a 30 8.85a 8.62a 8.38a Bursa FD-CF 0 8.46a 8.69a 8.62a 10 8.85a 8.00a 8.38a 20 8.85a 8.15a 8.38a 30 8.62a 8.46a 8.46a
1)BOD, boiled and oven-dried;FD, freeze-dried; CF, chestnut flour. 2)Means followed by different letters within each column are
the addition level increased. Cookies supplemented with FD-CF gave lower L* and higher a* and b* values as compared to BOD-CF supplemented cookies as determined by the paired t-test (p<0.05).
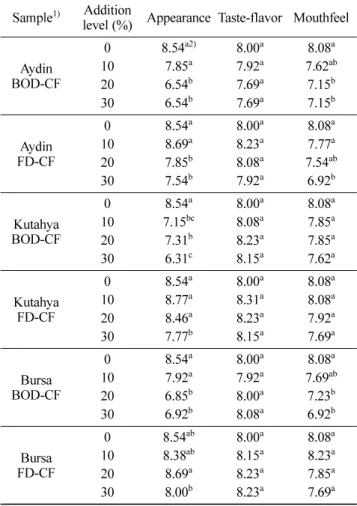
Sensory properties of low-fat cookies prepared with varying levels of BOD-CF and FD-CF are shown in Table 6. The cookies supplemented with 10% Aydin FD-CF, 10% Kutahya FD-CF, and 20% Bursa FD-CF had the highest appearance scores. There were no significant differences in the taste-flavor values for all BOD and FD-CF supplementation levels indicating that FD-CF addition did not have a deteriorative effect on this sensory property. There were also no significant differences in the mouthfeel values of CF supplemented low-fat cookies, except 20 and 30% Aydin and Bursa BOD-CF and 30% Aydin FD-CF supplementation levels. The FD-CF supplemented cookies generally gave higher appearance, taste-flavor, and mouthfeel values than the BOD-CF supplemented cookies as determined by the paired t-test (p<0.05).
The functional properties of CF examined in this study were affected by the drying method. Lyophilized CF showed improved functional properties, in particular, in terms of emulsion properties. Therefore, FD-CF seems to have a potential for utilization as a functional ingredient in bakery products, e.g., cakes, breads, and cookies.
Although the SR values of BOD-CF supplemented regular and low-fat cookies decreased as compared to control, the SR values of the regular cookies supplemented with 10% Kutahya and Bursa-FD-CF samples increased. The SR values of FD-CF supplemented regular and low-fat cookies were higher than those of BOD-CF supplemented ones. Low levels of BOD-CF and all levels of FD-CF had no deteriorative effect on the hardness values of regular cookies. In general, L* and b* values decreased and a* values increased in CF supplemented regular or low-fat cookies with increasing addition level. The surface colors of the cookies supplemented with FD-CF were darker as compared to those of BOD-CF supplemented cookies. This is probably due to enzymatic browning reaction occurred during production of FD-CF samples which were not heat treated. Furthermore, FD-CF samples had higher level of reducing sugar which might cause higher amount Maillard browning during cookie processing. CF addition did not have a deteriorative effect on taste-flavor and some of the addition levels of CF resulted in improving effects on the appearance values of the cookies.
The results confirmed that chestnut flour (CF) is a suitable ingredient for cookie production.CF either had no deteriorative effect or had some improving effects on various properties of the cookies. Sensory evaluation also
Table 5. Effects of chestnut flour addition on quality characteristics of low-fat cookies
Sample1) Addition
level (%) Diameter(cm) Spread ratio Hardness (N) CIE color value 2) L* a* b* Aydin BOD-CF 0 7.69a3) 6.78a 71.1ab 72.0a 7.36a 30.8a 10 7.26b 6.15b 77.0a 71.3b 6.89c 28.2b 20 6.85c 5.61c 70.9ab 70.0c 7.30a 26.9c 30 6.70d 5.36c 64.5b 70.3c 7.05b 25.0d Aydin FD-CF 0 7.69a 6.78a 71.1a 72.0a 7.36a 30.8a 10 7.53b 6.61ab 80.7a 71.2b 8.75a 31.2a 20 7.38c 6.47b 73.9a 66.6c 7.36a 29.3b 30 7.18d 5.98c 53.3b 67.1cb 8.88a 27.3c Kutahya BOD-CF 0 7.69a 6.78a 71.1a 72.0a 7.36b 30.8a 10 7.10b 5.55b 70.3a 72.9a 6.07c 26.9c 20 6.97c 5.62b 71.7a 69.3b 8.08a 28.4b 30 6.72d 5.46b 61.6b 70.0b 7.17b 25.9d Kutahya FD-CF 0 7.69a 6.78a 71.1a 72.0a 7.36b 30.8a 10 7.66a 6.84a 73.2a 71.2b 6.14c 31.2a 20 7.49b 6.51ab 72.4a 65.2c 9.70a 30.9a 30 7.38c 6.42b 58.9b 65.1c 9.51a 29.6b Bursa BOD-CF 0 7.69a 6.78a 71.1a 72.0a 7.36b 30.8a 10 7.49b 6.29b 69.6a 71.1b 6.95c 28.3b 20 6.98c 5.54c 71.2a 68.8c 7.91a 26.7c 30 6.87d 5.63c 40.6b 68.7c 7.72a 25.0d Bursa FD-CF 0 7.69b 6.78c 71.1ab 72.0a 7.36c 30.8b 10 7.79a 7.15a 80.9a 64.8b 9.67a 31.4a 20 7.73b 7.09b 74.4ab 64.7b 9.24b 29.9c 30 7.45c 6.37d 62.2b 62.6c 10.04a 29.4c
1)BOD, boiled and oven-dried;FD, freeze-dried; CF, chestnut flour. 2)L*, lightness; a*, redness; b*, yellowness.
indicated that the most of the CF substitutions gave cookies that were rated as being at least as good as the respective controls.
References
1. Alary R, Buissonade C, Joudrier P, Gautier MF. Detection and discrimination of cereal and leguminous species in chestnut flour by duplex PCR. Eur. Food Res. Tech. 225: 427-434 (2007)
2. Borges O, Goncalves B, Soeiro de Carvalho JL, Correia P, Silva AP. Nutritional quality of chestnut (Castanea sativa mill.) cultivars from Portugal. Food Chem. 106: 976-984 (2008)
3. Künsch K, Scharer H, Conedera M, Sassella A, Jermini M, Jelmini G. Quality assesment of chestnut fruits. Acta Hortic. 494: 119-127 (1999)
4. Salas-Salvado J, Megias I. Health and tree nuts: Scientific evidence of disease prevence. Acta Hortic. 686: 507-513 (2005)
5. Hoseney RC. Principles of Cereal Science and Technology. 2nd ed. American Association of Cereal Chemists, Inc., The Association, St. Paul, MN, USA. pp. 29-64, 275-305 (1998)
6. Maache-Rezzoug Z, Bouvier JM, Allaf K, Patras C. Effect of principal ingredients on rheological behaviour of biscuit dough and quality of biscuits. J. Food Eng. 35: 23-42 (1998)
7. Baltsavias A, Jurgens A, Vliet TV. Rheological properties of short doughs at small deformation. J. Cereal Sci. 26: 289-300 (1997) 8. Akoh CC. Fat replacers. IFT Scientific Status Summary. Food
Technol. -Chicago 52: 47-53 (1998)
9. Sudha ML, Srivastava AK, Vetrimani R, Leelavathi K. Fat
replacement in soft dough biscuits: Its implications on dough rheology and biscuit quality. J. Food Eng. 80: 922-930 (2007) 10. AACC Intl. Approved Methods of the AACC. 10th ed. The
American Association of Cereal Chemists, Inc., St. Paul, MN, USA (2000)
11. AOAC. Official Methods of Analysis of AOAC. 15th ed. The Association of Official Analytical Chemists, Washington, DC, USA (1990)
12. Singh J, Singh N. Studies on the morphological and rheological properties of granular cold water soluble corn and potato starches. Food Hydrocolloid 17: 63-72 (2003)
13. Koksel H, Masatcıoglu T, Kahraman K, Ozturk S, Basman A. Improving effect of lyophilization on functional properties of resistant starch preparations formed by acid hydrolysis and heat treatment. J. Cereal Sci. 47: 275-282 (2008)
14. Ahmedna M, Prinyawiwatkul W, Rao RM. Solubilized wheat protein isolate: Functional properties and potential food applications. J. Agr. Food Chem. 47: 1340-1345 (1999)
15. Bilgi B, Celik S. Solubility and emulsifying properties of barley protein concentrate. Eur. Food Res. Tech. 218: 437-441 (2004) 16. Casella MLA, Whitaker JR. Stabilization of proteins by solvents. J.
Food Biochem. 14: 453-475 (1990)
17. Lowry OH, Rosebrough NJ, Farr AL, Randall RJ. Protein measurement with Folin phenol reagent. J. Biol. Chem. 193: 265-275 (1951)
18. Ibanoglu E, Ibanoglu S. Foaming behaviour of EDTA-treated α
-lactalbumin. Food Chem. 66: 477-481 (1999)
19. Yalcin E, Sakiyan O, Sumnu G, Celik S, Koksel H. Functional properties of microwave-treated wheat gluten. Eur. Food Res. Tech. 227: 1411-1417 (2008)
20. Coffman CW, Garcia VV. Functional properties and amino acid content of protein isolate from mung bean flour. J. Food Technol. 12: 473-484 (1977)
21. Adebowale KO, Lawal OS. Comparative study of the functional properties of bambarra groundnut (Voandzeia subterranean), jack bean (Canavalia ensiformis), and mucuna bean (Mucuna pruriens) flours. Food Res. Int. 37: 355-365 (2004)
22. Sacchetti G, Pinnavaia GG. A ready-to-eat chestnut flour based breakfast cereal production and optimization. Acta Hortic. 494: 61-68 (1999)
23. Sacchetti G, Pinnavaia GG, Guidolin E, Rosa MD. Effects of extrusion temperature and feed composition on the functional, physical, and sensory properties of chestnut and rice flour-based snack-like products. Food Res. Int. 37: 527-534 (2004)
24. Correia P, Leitao A, Beirao-da-Costa ML. The effect of drying temperatures on morphological and chemical properties of dried chestnuts flours. J. Food Eng. 90: 325-332 (2009)
25. Catsimpoola N, Funk SK, Meyer EV. Thermal degradation of glycinin subunits. Cereal Chem. 47: 331-340 (1970)
26. Belitz HD, Grosch W. Aminoacids, peptides, and proteins. pp. 8-91. In: Food Chemistry. 2nd ed. Springer-Verlag, Berlin, Germany (1999)
27. Akubor PI, Isolokwu PC, Ugbane O, Onimawo IA. Proximate composition and functional properties of African breadfruit kernel and flour blends. Food Res. Int. 33: 707-712 (2000)
28. Yusuf AA, Ayedun H, Sanni LO. Chemical composition and functional properties of raw and roasted Nigerian benniseed (Sesamum indicum) and bambara groundnut (Vigna subterranean). Food Chem. 111: 277-282 (2008)
29. Koksel H, Ozboy O. Effects of sugarbeet fiber on cookie quality. Zuckerindustrie 124: 542-544 (1999)
30. Ozturk S, Ozboy-Ozbas O, Javidipour I, Koksel H. Utilization of sugarbeet fiber and zero-trans interesterified and non-interesterified shortenings in cookie production. ZuckerIndustrie 133: 704-709 (2008)
31. Ozturk S, Ozboy O, Cavidoglu I, Koksel H. Effects of brewer’s spent grain on the quality and dietary fiber content of cookies. J. Inst. Brew. 108: 23-27 (2002)
32. Sudha ML, Vetrimani R, Leelavathi K. Influence of fiber from different cereals on the rheological characteristics of wheat flour dough and on biscuit quality. Food Chem. 100: 1365-1370 (2007)
Table 6. Effects of chestnut flour addition on sensory properties of low-fat cookies
Sample1) Addition
level (%) Appearance Taste-flavor Mouthfeel Aydin BOD-CF 0 8.54a2) 8.00a 8.08a 10 7.85a 7.92a 7.62ab 20 6.54b 7.69a 7.15b 30 6.54b 7.69a 7.15b Aydin FD-CF 0 8.54a 8.00a 8.08a 10 8.69a 8.23a 7.77a 20 7.85b 8.08a 7.54ab 30 7.54b 7.92a 6.92b Kutahya BOD-CF 0 8.54a 8.00a 8.08a 10 7.15bc 8.08a 7.85a 20 7.31b 8.23a 7.85a 30 6.31c 8.15a 7.62a Kutahya FD-CF 0 8.54a 8.00a 8.08a 10 8.77a 8.31a 8.08a 20 8.46a 8.23a 7.92a 30 7.77b 8.15a 7.69a Bursa BOD-CF 0 8.54a 8.00a 8.08a 10 7.92a 7.92a 7.69ab 20 6.85b 8.00a 7.23b 30 6.92b 8.08a 6.92b Bursa FD-CF 0 8.54ab 8.00a 8.08a 10 8.38ab 8.15a 8.23a 20 8.69a 8.23a 7.85a 30 8.00b 8.23a 7.69a
1)BOD, boiled and oven-dried;FD, freeze-dried; CF, chestnut flour. 2)Means followed by different letters within each column are