An improved understanding of role of informal caregiver and the costs of diseases are obtained by conducting a case study of the costs associated with end stage renal disease (ESRD). Results indicate the patients’ and caregivers’ perception of the quantity of caregiving varies. In estimating the costs of ESRD, the costs incurred by both patients and their primary informal caregivers are calculated.
Using patients and their primary caregivers at a regional dialysis center in east-central Texas as a case study, estimated total ESRD costs range from $84,000 to $121,000 / year / case. Of the total costs, approximately 2% to 25% can be attributed to informal caregiving. Consideration of informal caregiving costs is, therefore, an important component of the costs of diseases. These estimates are conservative as the costs associated with lifestyle changes and health effects are noted, but no monetary value is placed on them.
Keywords: Informal caregiving, Costs of Disease, Caregiving Costs, End Stage Renal Disease (ESRD)
Disease: Case Study of End Stage Renal
Disease
Won-Ik Jang*
・James W. Mjelde**・S h e rry I. Bame***・F rederick Ta n * * * *
* Won-Ik Jang, Ph.D, Visiting fellow, Korea Institute for Health and Social Affairs. ** James W. Mjelde, Ph.D, Professor, Texas A&M University.
*** Sherry I. Bame, Ph.D, Associate Professor, Texas A&M University. **** Frederick Tan, M.D., Nephrologist, Bryan Nephrology Center.
patients in 2001 (U.S. Renal Data System 2003b, table B.3). Even more dramatic is the 1,066% increase in ESRD patients over 65 during this time. ESRD patients over 65 have increased from 11,800 patients in 1980 to 137,586 patients in 2001 (U.S Renal Data System 2003b, table B.3). Taking account an aging population, the U.S. Renal Data System (2003b) is predicting 2.2 million ESRD patients by 2030. Consistent estimates of the direct medical costs of ESRD have been tracked since 1991 (U.S. Renal Data System 2003c). Total medical expenditures for ESRD have increased from $8.0 billion in 1991 to $22.8 in 2001, almost a tripling of expenditures; for the same period, Medicare’s total budget has only doubled (U.S. Renal Data System 2003b). In 2001, the ESRD program was 6.4% of the Medicare budget, which represents a 33% increase since 1991 (U.S Renal Data System 2003b).
The objectives of this study are to provide 1) an increased understanding of the role of informal caregiving and 2) improved estimates of patients’ and informal caregivers’ costs associated with ESRD. The role of informal caregiver needs to be included in health policy debates. Because of the multitude of studies dealing with rising direct medical costs, the primary focus here is costs beyond direct medical costs. Data used to obtain these objectives is from a case study of ESRD patients and informal caregivers from three counties (Brazos, Grimes, and Robertson) in east-central Texas. To understand the role of informal caregiving, theoretical considerations along with patients’ and caregivers’ perceptions of informal caregiving are presented. Next, estimates of the total per case costs of ESRD are presented. Of particular interest is the partitioning of the costs into patient and informal caregiving c o s t s .
To our knowledge, no previous study has been undertaken that is
Ⅰ. Intro d u c t i o n
Rising health care costs and demographic shifts, including an aging population, are two trends facing health policy makers. Concern over rising health care costs is usually directed towards direct health care spending, which has risen from 8.8% of U.S. gross domestic product in 1980 to 13.3% in 2000 (National Center for Health Statistics, table 111 ) . These costs are predicted to continue to increase. Direct health care expenditures are, however, only part society’s total health costs. C u r r e n t l y, the largest segment of the population that is disabled (from all causes including diseases) is working-age adults (Adler). An aging population will affect the distribution of the disabled. Even with decreasing disability rates among older Americans (Manton and Gu; Waidmann and Manton), an aging population indicates an increasing need for addressing long-term health care. Burwell and Jackson show the percentage of disabled elderly increases by age cohort. Coupling increasing health costs and the move toward non-institutional care, with the potential for increased number of disabled people, the need for informal health care, the provision of informal care by family members and friends, will increase over the next decades.
One disease that has not been immune to these trends is end stage renal disease (ESRD). ESRD, a total and permanent loss of kidney function, is fatal within 72 hours if not continuously treated (National Institute of Diabetes and Digestive and Kidney Diseases). The prevalence of ESRD in U.S. has increased by 608% from 55,384 patients in 1980 to 392,023
Informal Caregiving in the Costs of Disease: Case Study of End Stage Renal Disease 8 3
Ⅲ. Model of Informal Care g i v i n g
Models of informal caregiving have 1) provided theoretical frameworks as to why informal care occurs, and 2) examined the affect of informal caregiving on the patients’ families and households. Becker’s early work on altruistic behavior in households provides one foundation for role of informal caregiving. In Becker’s framework, each spouse’s utility depends on the well being of other family members, such as the other spouse. Altruistic behavior arises because of the interdependence of household members’ utility through the household utility function. Becker claimed the altruistic behavior helps the family achieves a greater utility level than individual selfish behavior. He, however, did not explicitly consider informal care. Based on Becker, Jang illustrates using a two-person household, that when informal care giving occurs, the utility of the household increases over the case of all paid caregiving.
H o u s e h o l d ’s Utility Function
C o n s i d e r, a two-person household in which the household’s utility function is
UF=g(UH, UW) ( 1 )
where UF is the household’s utility function, UH is person one’s utility
function (husband), and UW is person two’s utility function (wife).
Individual family member’s utility functions can be expressed as
UH=f(X
H1, XH2, XW1, XW2), and ( 2 )
UW=f(XW1, XW2, XH1, XH2) ( 3 )
concerned with informal caregiving costs associated with ESRD. A unique aspect of this study is estimating both patients’ and caregivers’ costs. Individuals’ and societies’ costs of ESRD are large. Manns, Ta u b , and Donaldson estimate that in developed counties, 1% to 2% of overall health budgets are spent on ESRD care, although only 0.08% of the population has ESRD. The need for life-long chronic care has a ripple e ffect on the patients and families to cope with the burden of indirect health care expenses as well as opportunity costs. The aim of this study is to enumerate the nature of these unmeasured costs of chronic illness, specifically the case of ESRD.
Ⅱ. Brief Literature Review
This study’s main focuses are on the role of informal caregiving and the costs of ESRD beyond direct medical costs. These costs consist of both patients’ and informal caregiving costs. Little research has focused on patients’ costs other than direct medical costs. Stone and Kemper estimate 14 million working-age parents have a disabled parent or spouse aged 65 or older. The Task Force on Aging Research estimated 90% of the approximately 4.6-million non-institutionalized elderly persons rely on informal care. MetLife (p. 2) states “Nearly 25% of all households have at least one adult who has provided care for an elderly person at some point during the past 12 months.” All estimates indicate, a substantial number of people are incurring costs as they allocation their time and resources to informal care giving.
the sum of XH 2, XW 1, and XW2. Line segment AA’ represents the
h o u s e h o l d ’s initial budget constraint. Any combination of XH 1and X
represented by this line or below could be purchased by the household. The curves represented by U are indifference curves.
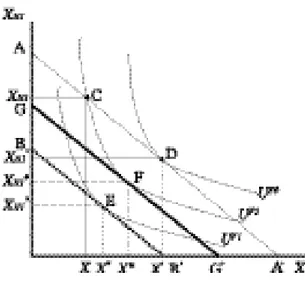
Let the point D be the initial point before any illness in the household. There is a level of variable medical care costs being incurred in absence of an illness. Now, assume the husband is diagnosed with a chronic illness. Medical care consumption (XH 1) now increases for the husband.
I n i t i a l l y, the household moves from point D to the point C in which the minimum amount of medical care necessary to keep the husband alive is all paid. As the household moves from D to C, the utility level of the household decreases. Let the distance between XH 1and XH 1’ represents the
minimum amount of medical care required to keep the husband alive. Under the assumption, the husband wishes to remain alive, the household must spend on medical care the distance between XH 1’ and XH 1to care for
the husband’s chronic illness. Letting the distance XH 1’ to XH 1equal the
distance between A and B, the household’s effective budget line becomes BB’ (dashed line). The effective budget constraint is defined as the h o u s e h o l d ’s budget constraint minus minimum medical care costs necessary to keep the patient alive. Given budget constraint BB’, the h o u s e h o l d ’s utility is maximized at the point E. As shown in figure 1, the household consumes less of X and XH 1and experiences a lower utility
level. Obviously, the shape of the indifference curves determines the final consumption combination. Changes in the utility function caused by the chronic illness may cause changes in the shape of the indifference curves, thus determining the final outcome. In general, consumption of X w i l l decrease and spending on overall medical care will increase. Overall medical care includes the minimum amount of health care (distance AB) Informal Caregiving in the Costs of Disease: Case Study of End Stage Renal Disease 8 7
where XH 1is medical care consumed by husband, XH 2is a composite
good, which includes all other goods consumed by husband including leisure activities, XW 1 is medical care consumed by wife, and XW 2 is a
composite good, which includes all other goods consumed by wife including leisure activities.
Normal assumptions concerning the individual’s utility function are assumed, including 1) goods provide utility, 2) all goods are normal goods, as an individual consume more of a good, his / her utility level increases, and 3) the marginal utility of the good decreases as he / she consumes more. Similar assumptions on the household utility function are imposed as with the individual utility functions. Further, it is assumed the prices of goods consumed are same for the husband and wife and time spent by a spouse for caring a patient is in part an altruistic behavior.
G r a p h i c a l l y, the trade-off between goods in the household is illustrated in utility space in figure 1. Here, X indicates a composite good, which is
8 6 保健社會硏究 第2 4卷 第2號
Utility Maximization of the Household
Each good, XH 1, XH 2, XW 1, and XW 2 is a function of time spent on all
activities. For example, if the husband spends more time working, his income increase, allowing the household to consume more goods. Therefore, each good can be expressed as
XHi=h(TH 1, TH2, TH3, TW1, TW2, TW3), and ( 4 )
XWi=h(TW1, TW2, TW3, TH1, TH2, TH3) ( 5 )
where i = 1, 2 for the two goods, TH 1is the husband’s time associated with
the chronic disease, TH 2is the husband’s time devoted to work, TH 3is the
h u s b a n d ’s time associated with all other activities, TW 1is the wife’s time
associated with the chronic disease, TW 2 is the wife’s time devoted to
work, and TW 3is the wife’s time associated with all other activities. Ti m e
associated with the disease includes all treatment time if the individual has the disease and unpaid caregiving time for the other member of the household. Each individual’s utility function is, therefore, expressed as a function of time by substituting equation (4) into equation (2) and equation (5) into equation (3). Individual’s utility functions become
UH=f(T
H1, TH2, TH3, TW1, TW2, TW3), and ( 6 )
UW=f(T
W1, TW2, TW3, TH1, TH2, TH3) ( 7 )
The total time available to each individual is fixed, such as 24 hours / day or 365 days / year. Mathematically, this can be stated as TH 1+ TH 2+ TH 3=
T and TW 1 + TW 2 + TW 3 = T. Because T is fixed, once TH 1 and TH 2a r e
determined, TH 3is decided. This implies that as the husband (the wife)
spends additional time associated with the disease, activities such as working and / or recreation must be reduced. As he (she) reduces his (her) work, the household income decreases. Consequently, the budget line is shifted downward decreasing the household’s utility level. TH 3can be
expressed as TH 3= T - TH 1- TH 2. A similar relationship can be derived for
and variable health care given by the good XH 1.
N o w, assume the wife, as an unpaid (informal) caregiver, replaces some of the paid caregiver costs. In this case, the household’s eff e c t i v e budget line increases, because the household saves at least some of the money paid to caregivers. A change in the effective budget constraint occurs, because the substitution of unpaid caregiving for paid caregiving to GG’. This substitution only occurs when the benefits from informal caregiving (saved money for professional caregiver, altruistic nature, etc) minus the costs (income loss, time, monetary, etc.) are greater than the net benefits associated with hiring a paid caregiver. Utility is now maximized at point F. The household’s utility, UF 2, is larger than the utility, UF 1,
associated with point E (with no unpaid caregiving). An important eff e c t of the existence of unpaid caregiver is, therefore, to alter the utility of the household to a higher level compared to the case of all paid medical care.
The example shown in figure 1 and associated discussion illustrates that the value of unpaid caregiver should be considered when estimating the costs of diseases. If a working wife becomes an unpaid caregiver to replace paid caregivers, there may be additional income loss to the household, if her caregiving affects her work. Such an income loss causes an additional decrease in the budget line to somewhere between BB’ and GG’. Also, unpaid caregiving changes the consumption of the composite good X.
The patient may have much higher preference for health than any other goods. In this case, a non-typical shape of indifference curve such as “lexicographic ordering” (Malinvaud) may occur in an individual’s preference ordering. The lexicographic ordering occurs when an individual shows very high preference to a good. Here, this preference is akin to the assumption of “wanting to stay alive.”
budget constraint may also change because of income loss because of the disease, consequently, the household’s utility decreases. Unpaid caregiving, however, can replace some paid caregiving, thereby reducing the medical care expenses of the household, increasing the purchase of other goods, and increasing utility of the household. If a family member devotes his / her time to care for a patient, he / she may experience an income loss, and / or changes in his / her personal life such as less sleep, less recreation, and more mental stresses. These changes have economic costs, even if family care is unpaid (Shellenbarg e r ) .
The conceptual framework illustrates the necessity of trade offs in maximizing a household’s utility. If unpaid caregiving is to occur, the household will incur either a loss in income or a loss in leisure time. These losses caused by the illness cause a utility loss to the household, thus should be considered as part of the cost of the illness. In the conceptual framework, illness decreases the utility of the individual and household. The costs of the illness contain the foregone income loss and decrease consumption of non-medical goods. The unpaid caregiving can substitute for some paid medical costs, but this substitution in household may incur either a loss in income or in leisure time. Avoiding double counting of the costs of the illness is important as several utility functions and resource constraints are involved.
The standard economic conclusion (or some modification) is generally reached that for informal caregiving to occur, the net marginal benefits of informal caregiving must be greater than the net marginal benefits of paid caregiving. Stated in other words, the benefits from informal caregiving including altruistic aspect minus the costs of informal caregiving (see sections below) must be greater than the benefits (professional care) minus the costs of paid caregiving for the last unit of informal care. This Informal Caregiving in the Costs of Disease: Case Study of End Stage Renal Disease 9 1
the wife’s time. Substituting these time constraints into equations (6) and (7), one obtains
UH=f(TH1, TH2, TW1, TW2, T), and ( 8 )
UW=f(T
W1, TW2, TH1, TH2, T) ( 9 )
Equations (8) and (9) indicate the husband’s and the wife’s utility functions are function of time spent for activities associated with a disease, work, and implicitly all other activities through the time constraints. Substituting equations (8) and (9) into equation (1), the h o u s e h o l d ’s utility function, equation becomes
UF=g(UH(T
H1, TH2, TW1, TW2, T), UW(TW1, TW2, TH1, TH2, T))=
g(TH1, TH2, TW1, TW2, T) ( 1 0 )
Households maximize their utility subject to an income (I) constraint
I=TH2RH+TW2RW-CSA(TH1, TW1) ( 11 )
where RHis the husband’s and RW is the wife’s wage rate. CSA is the
p a t i e n t ’s minimum medical costs to stay alive, which is a function of times associated with the disease by both the wife and husband. In the case of no chronic illness in the household, C S A equals zero. The h o u s e h o l d’s maximization problem can be solved using the Lagrange multiplier (λ) technique. The constrained maximization problem is
where λis the Lagrange multiplier. Maximization is achieved by satisfying the first-order (F.O.C) and the second-order conditions (S.O.C) ( S i l b e r b e rg). By satisfying the F.O.C and S.O.C, the household achieves a utility maximization subject to budget constraint. If a household member becomes chronically ill, the household’s consumption is changed because of additional expenses of medical care including paid caregiving. The
9 0 保健社會硏究 第2 4卷 第2號
max L = max g(TH1, TH2, TW1, TW2, T) TH1TH2TW1TW2
Ⅴ. Caregiving Perc e p t i o n s
Unlike most previous studies delineating informal caregivers, this study does not focus on socio-demographic characteristics of caregivers, but rather what constitutes care from the patient and informal caregiving perspective and what is the cost of this care. To understand, informal caregiving, there is a need to know what patients and caregivers perceive as caregiving acts (see Jang for socio-demographic characteristics of both patients and caregivers.)
As expected, there are perceptional difference between the patients and their caregivers concerning caregiving. In the questionnaires, an informal caregiver was defined as any person who provides patient care without receiving monetary payment. However, it appears in many cases, patients do not consider family members as caregivers. For example, a patient may have indicated his / her spouse gave the patient a ride to the dialysis c e n t e r, but the patient also indicated he / she does not have an informal c a r e g i v e r. Such responses imply patients may feel either his / her spouse is not an informal caregiver or providing transportation is not caregiving.
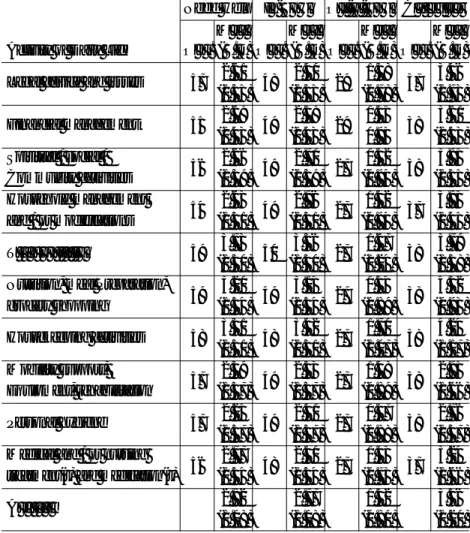
Patients indicated on a 1 - 5 scale (1: never, 3: sometimes, 5: always) the need for care for various activities of daily living because of their ESRD and the amount of care in-town and out-of-town informal caregivers provide (table 1). Similarly, primary informal caregivers were asked to provide on a 1 - 5 scale the amount of caregiving they give for each activity (table 1). For all questions, the range of responses received was one to five. Each question is summarized independent of the other conclusion indicates society’s overall costs of diseases are lower by
informal caregiving. If this was not the case, the informal caregiver would pay for caregiving and informal caregiving would not occur. Now, it looks clear why the value of informal caregiving should be considered as a part of costs of disease, and why it is meaningful to calculate the magnitude of the value of informal caregiving.
Ⅳ. Data Source and Socio-demographic Factors
Primary data used in this study were obtained from ESRD patients and their primary informal caregivers. Questionnaires were distributed to 11 5 ESRD patients undergoing hemodialysis treatments at the Gambro Dialysis Center in College Station, Texas and their primary informal caregivers. Gambro is the only outpatient dialysis location within a 50-mile radius. Data collection occurred between November 15, 2002 and January 17, 2003 (Jang).
Of the 115 questionnaires distributed, 59% of the patients and 34% of the caregivers returned their questionnaires. Fifty percent of the patients’ responding are male. Thirty-four percent of the patients responding are white, 38% are black, and 27% are Hispanic. Average age of the ESRD patients is 59 years. Twenty-six percent of the caregivers are male and 74% are female. Forty-one percent of the caregivers are white, 28% are black, and 31% are Hispanic. The average age of the caregivers is 55 years. The majority of the caregivers are spouses (51%) or children (21%) of the patient, with parents (13%) and siblings (10%) trailing.
questions. All patients or caregivers answering a question are included in the summary, thus the slight differences in the number of observations noted in table 1. This leads to a different number of observations for each daily activity, but all information in used this assumption. In table 1, higher means associated with “need help” indicate patients indicated they need more help for that daily activity. Patients indicated they need the most help for transportation (3.73), housekeeping (3.31), and nutrition, grocery shopping (3.20). Patients responded they receive more help from in-town caregivers (out-of-town caregivers) on housekeeping (3.42, 1.70), transportation (3.36, 1.67), and nutrition, grocery shopping (3.14, 1.44) than for the other items. Similar to the patients’ responses, a higher mean associated with caregiving indicates the caregivers feel they provide a higher level of care for that activity (table 1). Caregivers felt they provide the most care for housekeeping (4.24) and nutrition, grocery shopping (4.32). Personal hygiene caregiving had the lowest average (2.76) among the 10 activities.
Comparing caregivers’ responses to patients’ responses on the 10 activities provides an indication of how patients feel about the amount of caregiving needed relative to caregivers’ perceptions concerning the level of caregiving provided. Although the responses are not 100% comparable and care must be used in interpreting the results, patients indicated less caregiving was needed than caregivers indicated they are provided. This result may imply that a specific caregiving (or behavior) is not a considered caregiving by the patient, but the caregiver feels it is caregiving. For example, patients may feel a meal preparation is not caregiving, however, his / her spouse may feel a meal preparation is a caregiving. Further, the differences may indicate the need for patients to feel independent. Finally, the differences may also indicate caregivers Informal Caregiving in the Costs of Disease: Case Study of End Stage Renal Disease 9 5
9 4 保健社會硏究 第2 4卷 第2號
Table 1. Mean Value Comparisons between Caregiving Demand and Supply
Activity of Daily Life Legal advice and issues
Financial management Spiritual / social / Community activities Household management and / or modifications T r a n s p o r t a t i o n
Nutrition, meal Preparation, grocery shopping
Housekeeping activities Mobility support, Equipment, rehabilitation Personal hygiene Medical and / or nursing treatment(s) and medication(s) A v e r a g e 5 7 5 5 5 6 5 4 5 9 5 9 5 8 5 7 5 7 5 6 2 . 6 1 ( 1 . 3 5 ) 2 . 6 9 ( 1 . 4 3 ) 2 . 6 6 ( 1 . 3 9 ) 2 . 6 3 ( 1 . 5 1 ) 3 . 7 3 ( 1 . 5 0 ) 3 . 2 0 ( 1 . 5 4 ) 3 . 3 1 ( 1 . 5 1 ) 2 . 3 9 ( 1 . 3 7 ) 2 . 2 5 ( 1 . 3 7 ) 2 . 7 7 ( 1 . 5 4 ) 2 . 8 2 ( 1 . 0 8 ) 4 8 4 9 4 9 4 9 5 0 4 9 4 8 4 9 4 9 4 8 2 . 4 0 ( 1 . 3 5 ) 2 . 5 9 ( 1 . 4 3 ) 2 . 7 1 ( 1 . 3 9 ) 2 . 9 6 ( 1 . 5 1 ) 3 . 3 6 ( 1 . 5 0 ) 3 . 1 4 ( 1 . 5 4 ) 3 . 4 2 ( 1 . 5 1 ) 2 . 3 3 ( 1 . 3 7 ) 2 . 4 1 ( 1 . 3 7 ) 2 . 5 0 ( 1 . 5 4 ) 2 . 7 7 ( 1 . 0 8 ) 2 9 2 9 2 7 2 7 2 7 2 7 2 7 2 7 2 7 2 7 1 . 3 8 ( 0 . 7 8 ) 1 . 5 5 0 . 9 5 1 . 5 2 ( 0 . 9 4 ) 1 . 5 2 ( 0 . 9 4 ) 1 . 6 7 ( 1 . 2 4 ) 1 . 4 4 ( 0 . 8 9 ) 1 . 7 0 ( 1 . 0 7 ) 1 . 4 8 ( 0 . 8 9 ) 1 . 3 7 ( 0 . 8 8 ) 1 . 3 3 ( 0 . 7 3 ) 1 . 5 2 ( 0 . 8 0 ) 3 7 3 8 3 8 3 7 3 8 3 8 3 8 3 8 3 8 3 7 3 . 4 6 ( 1 . 7 3 ) 3 . 6 1 ( 1 . 5 3 ) 3 . 9 5 ( 1 . 3 5 ) 3 . 9 5 ( 1 . 4 5 ) 3 . 7 9 ( 1 . 5 8 ) 4 . 3 2 ( 0 . 9 3 ) 4 . 2 4 ( 1 . 1 7 ) 2 . 9 5 ( 1 . 6 6 ) 2 . 7 6 ( 1 . 5 7 ) 3 . 2 4 ( 1 . 6 6 ) 3 . 5 6 ( 1 . 2 0 ) Need Help O b s . M e a n ( S . D ) O b s . M e a n ( S . D ) O b s . M e a n ( S . D ) O b s . M e a n ( S . D ) I n - T o w n O u t - o f - T o w n C a r e g i v e r
Note: 1) Need help: what patients feel about how much caregiving they need (1: never needs, 3: sometimes needed, 5: always needed).
Note: 2) In-town: what patients feel about how much caregiving is provided by in-town informal caregiver. (1: never provided,3: sometimes provided, 5: always provided).
Note: 3) Out-of-town: what patients feel about how much caregiving is provided by out-of-town informal caregiver. (1: never provided,3: sometimes provided, 5: always provided).
Note: 4) Caregivers: what caregivers feel about how much caregiving they provide (1: never provide, 3: sometimes provided, and 5: always provide).
may overstate their role when compared to the patient’s perspective.
Ⅵ. Costs Associated with ESRD
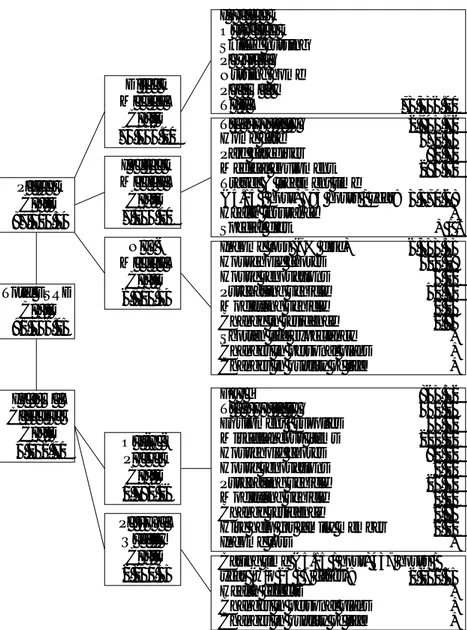
Both the patients’ and informal caregivers’ questionnaires contain questions pertaining to increased costs incurred because of ESRD and associated caregiver. Unlike previous studies, costs associated with both patients and caregivers are presented. Further, an attempt is made to be conservative on the cost estimates. Costs categories are summarized in figure 2.
Costs presented in figure 2 are annual costs for patients and caregivers in 2002 U.S. dollars. For every cost category, a wide-range of costs is obtained, however, because of space limitations, only mean cost values are presented. Sensitivity analyses on cost of time and income loss are presented (table 2). In estimating the costs, care was taken to avoid double counting (see Jang for details on the methodology used in estimating the costs).
Patients’ Direct Medical Costs
The focus of the study is not on direct medical cost; as such the questionnaire did not ask questions concerning direct medical costs. As a proxy for these costs for use in calculating relative and absolute total costs of ESRD, data from the U.S. Renal Data System are used. In 2000, Medicare paid $56,158 / ESRD patient / year in 2000 (U.S. Renal Data System 2003a). Medicare usually covers only 80% of the direct medical cost of an ESRD patient. The remaining 20%, which is paid by the patient, insurance, or written off as bad debt, amounts to $14,039
Figure 2. Total best guess annual costs of end stage renal disease
P a t i e n t C o s t s $ 8 7 , 3 1 3 . 3 4 D i r e c t M e d i c a l C o s t s $ 7 3 , 3 3 6 . 0 0 I n p a t i e n t O u t p a t i e n t Skilled nursing P h y s i c i a n Nursing home P h a r m a c y T o t a l $ 7 3 , 3 3 6 . 0 0 T r a n s p o r t a t i o n $ 2 , 9 4 5 . 7 2 Home care $ 3 7 0 . 5 6 Paid caregiver $ 9 0 . 7 2 Medical equipment $ 2 8 6 . 3 2 Travel & treatment time
($5.15 / hour) 793 hours / year: $ 3 , 3 7 0 . 6 8
Health insurance +
Special diet + /
-Income loss (7% disc) $ 6 , 3 5 3 . 3 5 Household chores $ 5 0 0 . 2 8 House renovations $ 6 . 0 2 Purchasing vehicle $ 5 1 . 7 1 Modifying vehicle $ 0 . 0 3 Change in residence $ 1 . 9 5 Shorten life expectancy + Changes in personal plans + Changes in quality of life +
F o o d $ 8 6 5 . 3 2 T r a n s p o r t a t i o n $ 5 4 2 . 0 4 Equipment / supplies $ 5 5 . 3 2 Miscellaneous items $ 2 1 0 . 0 0 Household chores $ 8 2 . 2 0 House renovations $ 0 . 1 0 Purchasing vehicle $ 2 6 . 3 2 Modifying vehicle $ 0 . 0 0 Change residence $ 0 . 8 6 Hire help for family member $ 0 . 0 0
Income loss +
Caring time ($5.15 / hour) 437 hours / year (w/o 24 / 7 cases): $ 2 , 2 5 0 . 5 5
Health effects +
Changes in personal plans + Changes in quality of life + I n d i r e c t M e d i c a l C o s t s $ 7 , 0 6 4 . 0 0 N o n -M e d i c a l C o s t s $ 6 , 9 1 3 . 3 4 O u t o f -P o c k e t C o s t s $ 1 , 7 8 2 . 1 6 P e r s o n a l Q u a l i t y C o s t s $ 2 , 2 5 0 . 5 5 Total ESRD C o s t s $ 9 1 , 3 4 6 . 0 5 I n f o r m a l C a r e g i v e r C o s t s $ 4 , 0 3 2 . 7 1
Note: 1) Amounts are calculated as annual costs / person.
Note: 1) Amount of income loss, house renovations, vehicle, and changes in residence are annualized.
annually in 2000. Direct medical cost of an ESRD patient is, therefore, approximately $70,197 / year in 2000. The consumer price index (CPI) is used calculate the 2002 direct medical cost of $73,336 / year / patient. Because the CPI is most likely lower than medical cost inflation rate, this cost is a conservative estimate. Although patients may not incur these costs directly, society experiences these costs; as such they are applicable in estimating the true costs ESRD.
Patients’ Indirect Medical Costs
Two major cost variables in this category are transportation cost to the dialysis center and time for travel to the center and for treatment. On average, an ESRD patient spends $2,946 / year on transportation to and from the dialysis center. Because of data collection issues, actual total transportation costs are higher than the average presented in figure 1, because of the inclusion of some transportation costs in the caregivers’ Informal Caregiving in the Costs of Disease: Case Study of End Stage Renal Disease 9 9
9 8 保健社會硏究 第2 4卷 第2號
cost (net benefit) associated with ESRD, and + / - indicates the net cost or benefit is undetermined. In all three cases, the costs are not estimated.
Note: 3) Employer / other social costs are not considered in this calculation.
Note: 4) The best guess: combination of 7% discount rate, rate of $5.15 / hour, and without 24 / 7 cases
Source: Patients’ and Caregivers’ Quaestionnaires
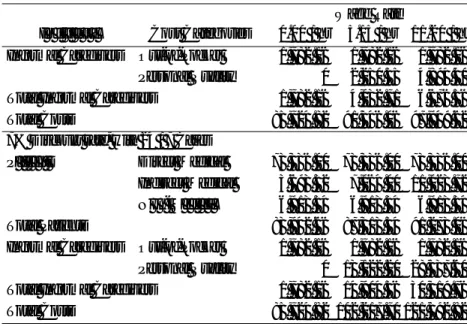
Table 2. Annual ESRD Costs with Three Wage Rates and Two Discount Rates in 2002
I n d i v i d u a l
3% Discount Rate, without 24 / 7 Cases P a t i e n t s
Total Patients Informal Caregivers
Total Informal Caregivers Total Costs Out-of-Pocket Personal Quality Direct Medical Indirect Medical N o n - M e d i c a l
3% Discount Rate, with 24 / 7 Cases P a t i e n t s
Total Patients Informal Caregivers
Total Informal Caregivers Total Costs Out-of-Pocket Personal Quality Direct Medical Indirect Medical N o n - M e d i c a l
7% Discount Rate, without 24 / 7 Cases P a t i e n t s Total Patients Direct Medical Indirect Medical N o n - M e d i c a l Cost Categories $0.00 / hr 7 3 , 3 3 6 . 0 0 3 , 6 9 3 . 3 2 5 , 2 7 4 . 5 8 8 2 , 3 0 3 . 9 0 1 , 7 8 2 . 1 6 0 1 , 7 8 2 . 1 6 8 4 , 0 8 6 . 0 6 7 3 , 3 3 6 . 0 0 3 , 6 9 3 . 3 2 5 , 2 7 4 . 5 8 8 2 , 3 0 3 . 9 0 1 , 7 8 2 . 1 6 0 1 , 7 8 2 . 1 6 8 4 , 0 8 6 . 0 6 7 3 , 3 3 6 . 0 0 3 , 6 9 3 . 3 2 6 , 9 1 3 . 3 4 8 3 , 9 4 2 . 6 6 1 , 7 8 2 . 1 6 0 1 , 7 8 2 . 1 6 8 5 , 7 2 4 . 8 2 7 3 , 3 3 6 . 0 0 3 , 6 9 3 . 3 2 6 , 9 1 3 . 3 4 8 3 , 9 4 2 . 6 6 1 , 7 8 2 . 1 6 0 1 , 7 8 2 . 1 6 8 5 , 7 2 4 . 8 2 7 3 , 3 3 6 . 0 0 7 , 0 6 4 . 0 0 5 , 2 7 4 . 5 8 8 5 , 6 7 4 . 5 8 1 , 7 8 2 . 1 6 2 , 2 5 0 . 5 5 4 , 0 3 2 . 7 1 8 9 , 7 0 7 . 2 9 7 3 , 3 3 6 . 0 0 7 , 0 6 4 . 0 0 5 , 2 7 4 . 5 8 8 5 , 6 7 4 . 5 8 1 , 7 8 2 . 1 6 1 3 , 1 2 2 . 2 0 1 4 , 9 0 4 . 3 6 1 0 0 , 5 7 8 . 9 4 7 3 , 3 3 6 . 0 0 7 , 0 6 4 . 0 0 6 , 9 1 3 . 3 4 8 7 , 3 1 3 . 3 4 1 , 7 8 2 . 1 6 2 , 2 5 0 . 5 5 4 , 0 3 2 . 7 1 9 1 , 3 4 6 . 0 6 7 3 , 3 3 6 . 0 0 7 , 0 6 4 . 0 0 6 , 9 1 3 . 3 4 8 7 , 3 1 3 . 3 4 1 , 7 8 2 . 1 6 1 3 , 1 2 2 . 2 0 1 4 , 9 0 4 . 3 6 1 0 2 , 2 1 7 . 7 0 7 3 , 3 3 6 . 0 0 1 1 , 0 2 3 . 7 2 5 , 2 7 4 . 5 8 8 9 , 6 3 4 . 3 0 1 , 7 8 2 . 1 6 4 , 8 9 4 . 4 0 6 , 6 7 6 . 5 6 9 6 , 3 1 0 . 8 6 7 3 , 3 3 6 . 0 0 1 1 , 0 2 3 . 7 2 5 , 2 7 4 . 5 8 8 9 , 6 3 4 . 3 0 1 , 7 8 2 . 1 6 2 8 , 5 3 7 . 6 0 3 0 , 3 1 9 . 7 6 1 1 9 , 9 5 4 . 0 6 7 3 , 3 3 6 . 0 0 1 1 , 0 2 3 . 7 2 6 , 9 1 3 . 3 4 9 1 , 2 7 3 . 0 6 1 , 7 8 2 . 1 6 4 , 8 9 4 . 4 0 6 , 6 7 6 . 5 6 9 7 , 9 4 9 . 6 2 7 3 , 3 3 6 . 0 0 1 1 , 0 2 3 . 7 2 6 , 9 1 3 . 3 4 9 1 , 2 7 3 . 0 6 1 , 7 8 2 . 1 6 2 8 , 5 3 7 . 6 0 3 0 , 3 1 9 . 7 6 1 2 1 , 5 9 2 . 8 2 Wage Rate $5.15 / hr $11.20 / hr I n d i v i d u a l Cost Categories $0.00 / hr Wage Rate $5.15 / hr $11.20 / hr <Table 2> 계속 Informal Caregivers
Total Informal Caregivers Total Costs
Out-of-Pocket Personal Quality
7% Discount rate, with 24 / 7 Cases P a t i e n t s
Total Patients Informal Caregivers
Total Informal Caregivers Total Costs Out-of-Pocket Personal Quality Direct Medical Indirect Medical N o n - M e d i c a l
diagnosed. Further, several patients have continued to work after diagnosis. For household chores such as lawn mowing, house cleaning, grocery shopping, errands, and other miscellaneous chores, the average total cost is $500.28 / year / patient. Very few patients had to renovate their house, purchase or modify their vehicles, or change residence. This is reflected in the low cost estimates for these variables. Total mean non-medical costs are $6,913 / year / patient, a conservative estimate given the costs not monetarized.
Three costs associated with ESRD which could not be monetarized with a the questionnaire data are costs associated with shorten life e x p e c t a n c y, decreased quality of life, and changes in the patients’ lives, such as changes in vacation plans and job. These changes, however, represent costs, which are incurred because of the disease (Hay and Ernst). Positive values are noted for these variables.
Informal Caregivers’ Out-of-Pocket Costs
Additional expenses for food, transportation, and miscellaneous items are approximately 90% of the caregivers’ out-of-pocket costs. Household chores and purchasing equipment and supplies make up about eight percent of this cost category. Caregivers did not completely answer the questionnaire such that data was available to calculate income loss. Only six of 39 caregivers indicated caregiving affect their employment. Of these six, one indicated he /she retired two years early and two indicated they reduced their working hours (none provided income data). The other three did not state how caregiving affected their employment. As such income loss is not estimated, but noted as a positive cost. This result is similar to the result of Wolf and Soldo who show caring for an elderly patient by married women is not associated with any reduction in employment. Total mean out-of-pocket costs are $1,782 / year / caregiver. section to avoid double counting. Examining both patients’ and
caregivers’ transportation costs provides a better estimate of total transportation costs.
ESRD patients’ in this study spent on average 783 hours / year traveling to the dialysis center and for treatment. To put the number of hours in perspective, 783 hours translates into approximately 98 eight-hour workdays, 19.5 workweeks, or approximately nine percent of the total number of hours in a year. Time is obviously a large cost associated with ESRD. Using the government mandated minimum wage rate (a very conservative estimate of the opportunity costs), an opportunity cost of $3,370 / year / patient is incurred. Costs for home care, paid caregiver, and medical equipment are $370, $90, and $286 / year / patient. Additional expenses for health insurance and special diet were not asked in the patient questionnaires, because it is hard to distinguish whether the expenses for these two categories are caused strictly by ESRD or co-morbidities. Eating a special diet may improve the overall health of the patient, therefore, potentially giving an overall net benefit to this category. Incremental expenses for these two categories are not calculated, but are noted. Overall total indirect medical costs of $7,064 / year / patient are e s t i m a t e d .
Patients’ Non-Medical Costs
The two main cost variables in the non-medical category are income loss and household chores. Patients’ income loss is based on year of retirement, number of years of early retirement caused by ESRD, and income at time of retirement. Calculated income loss is an annualize income loss value. Annualized income loss is $6,353 / year / patient. One reason for a small income loss value is that a number of patients were retired, unemployed, or in low-income jobs at the time ESRD was
annual informal caregivers’ costs are $4,033 / caregiver. Informal caregivers’ percentage of total ESRD costs is 4%, including direct medical costs and 22% excluding direct medical costs.
Sensitivity Analysis
Costs associated with ESRD disease under alternative assumptions are presented in table 2. Sensitivity analysis is preformed on the discount rate (three and seven percent) used to calculate income loss for the patients. Three different wage rates are assumed, $0.00 (no opportunity cost for time), $5.15 (minimum wage rate), and $11.20 (national wage rate for paid caregivers (Arno, Levine, and Memmott)). Total ESRD costs range from $84,086.06 / year / case (3% discount rate and no time opportunity costs) to $121,593 / year / case (7% discount rate, wage rate of $11.2 / h o u r, and including 24 / 7 cases). The scenario of 7% discount rate, minimum wage rate, and excluding 24 / 7 caregiver responses is chosen as the “best guess” because the 7% discount is comparable to discount rates used in federal government benefit costs analysis, thus, aiding comparisons. The minimum wage places a conservative, but positive cost on time. Eliminating the 24 / 7 caregiving time responses provides a more realistic view of actual caregiving time.
Within the different scenarios presented in table 2, several cost components, by design, do not change: patients’ direct medical costs of $73,336 and the caregivers’ out-of-pocket expenses of $1,783. The discount rate and wage rate affects the indirect medical costs (time costs) and the non-medical costs (income loss), whereas the wage rate and caregiving time assumptions affect the caregivers’ personal quality costs (time costs). Patients’ non-medical costs range from $5,275 to $6,913 (table 2). One cause of this range is the different assumptions made in calculating annualized income losses / patient. Based on the discount rate Informal Caregiving in the Costs of Disease: Case Study of End Stage Renal Disease 1 0 3
Informal Caregivers’ Personal Quality Costs
The only cost variable estimated in this category is cost of time for caregiving. Similar to the patients’ costs, the important cost variables, health effects, changes in personnel plans, and quality of life are noted as positive values, but not monetarized. Many caregivers indicated 24 / 7 as the number of hours of caregiving. Obviously, a caregiver is not providing specific care 24 hours a day seven days a week. Estimates in this section use the average number of hours of caregiving omitting the 24 / 7 responses out (see sensitivity analysis section). Under this assumption, caregivers spend an average of 8.4 hours / week (4.4 hours / weekday and 4 hours / weekend) for patient caring or 437 hours / year. The caregiver is, however, available to help the patient most of the day. Using the 24 / 7 responses, a caregiver, on average, spends 49 hours / week (7 hours / weekday and 7 hours / weekend day) or 2,548 hours / y e a r. Time is a large cost associated with patient caring in caregivers’ case. These hours should be considered as the caregivers’ perception of the number of hours of caregiving. Omitting the 24 / 7 responses, the mean time cost using the minimum wage rate as the opportunity cost is $2,250 / year / patient.
Total Costs of ESRD - Best Guess
Using estimates in figure 2, direct and indirect medical costs ($73,336 + $7,064) represent 88% of the total annual ESRD costs ($91,346). As expected, these are by far the largest cost components. Patients’ non-medical costs represent 8% of the total ESRD costs. Because direct medical costs dominate total costs and are usually paid by insurance and government programs, the percentage of patients’ non-medical costs to total costs not including direct medical costs is presented. In this case, the patients’ non-medical costs are 38% of the costs of ESRD. The total 1 0 2 保健社會硏究 第2 4卷 第2號
incorporation of both informal caregivers’ costs and patients’ costs in determining the costs of ESRD.
D i ffering perceptions among patients and caregivers as to what constitutes caregiving also play an important role. The altruistic nature of caregiving may arise because caregiving is “what family members do for other members and what friends do for friends.” As such, it appears some people did not consider all acts of care as caregiving. Another additional interesting point is patients’ perception of caregiving appears to be d i fferent from the caregivers’ perception of caregiving. Overall, it appears caregivers’ felt they provided more help than the patients’ felt they received.
In calculation of ESRD costs, depending on assumptions made concerning the opportunity costs of time, discount rate, and amount of caregiving time, estimated annual total ESRD costs range from $84,086 to $121,593 / year / case. Under the best guess scenario, the annual total ESRD costs are $91,346 / year / case. Of this amount, 88% ($80,400) are direct and indirect medical costs and 7.6% are non-medical costs. Patients’ costs are 96% of the total ESRD costs, whereas costs associated with caregiving are 4%. The best guess informal caregivers’ costs in this case study are approximately $4,000 / year / caregiver. However, the caregivers’ percentage increases up to 25%, depending the assumed discount rate, wage rate, and caregiving time. In addition, there are many non-monetarized cost components such as changes in personal plans, shorten life expectancy, and health affects not included in the above cost estimates. Estimating the monetary values of these items will obviously increase total costs and change the portion of non-medical costs and / or informal caregivers’ costs. Further, costs associated with caregivers who are not the primary informal caregiver are not included. The magnitude of assumed, annualized income losses range between $4,715 (3% discount
rate) and $6,353 (7% discount rate). Patients’ non-medical costs of time are $0 (wage rate of $0.00 / hour), $3,371 (wage rate of $5.15 / hour), or $7,330 (wage rate of $11.2 / hour). The monetarized total patients cost in this study ranges from $82,304 to $91,273 / year / patient (table 2). Overall all scenarios, patients’ non-medical costs range from 4% (11 % ) to 8% (56%) of total costs including (excluding) direct medical costs. Indirect medical costs range from 4% (23%) to 11.5% (48%) of total costs including (excluding) direct medical costs.
Annual average informal caregivers’ personal quality costs range from $0 to $28,537. Two reasons for the range are the wage rate used to value time and assumptions on the amount of caregiving time. Responses of 24 hours seven days a week are use in one scenario in calculating caregiving time and are treated as missing values in the second scenario. It is not unexpected that time would dominate informal caregiving costs, as this is the main resource caregivers have to provide to patients. For the various scenarios presented in table 2, the informal caregivers’ percentage of costs range from 2% (14%) to 25% (65%) including (excluding) direct medical costs in the total costs.
Ⅶ. Discussion / Conclusions
In this study, theoretical development of caregiving, perceptional d i fferences about caregiving between patients and caregivers are presented, and comprehensive annual costs of ESRD are calculated using a case study approach. The most distinguishing feature of this study is the
Reference
A d l e r, Michele. (August 1990), “The Disabled: Their Health Care and Health Insurance,” U.S. Department of Health and Human Services, Accessed November 2003, http://aspe.os.dhhs.gov/daltcp/reports/ d i s a b l e d . h t m
Arno, Peter S., Carol Levine, and Margaret M. Memmott. (March / April 1999), “The Economic Value of Informal Caregiving,” H e a l t h
A f f a i r s , 18(2): 182~188.
B e c k e r, Gary. S. (February 1981), “Altruism in the Family and Selfishness in the Market Place,” E c o n o m i c a , 48(189): 1~15. Burwell, Brain O. and Beth Jackson. (July 1994), “The Disabled Elderly
and Their Use of Long-Term Care,” U.S. Department of Health and Human Services, Accessed November 2003, http://aspe.hhs.gov/ d a l t c p / r e p o r t s / d i s e l d e s . h t m .
Jang, Won-Ik. (December 2003), Costs of Chronic Disease and an
Alternative to Reduce These Costs: Case Study of End Stage Renal Disease (ESRD), Ph.D. Dissertation, Texas A&M University.
Manns, B.J., K.J. Taub, and C. Donaldson. (July 2000), “Economic Evaluation and End-Stage Renal Disease: From Basic to Bedside,”
American Journal of Kidney Diseases, 36(1): 12~28.
Manton, K.G., and X.L. Gu. (May 2001), “Changes in the Prevalence of Chronic Disability in the United States Black and Nonblack Population above 65 from 1982 to 1999,” P roceedings of the
national academy of sciences of the United States of America,
9 8 ( 11): 6354~6359.
MetLife. (November 1999), The MetLife Juggling Act Study; Balancing Informal Caregiving in the Costs of Disease: Case Study of End Stage Renal Disease 1 0 7
these costs is unknown. Finally, secondary effects of caregiving, such as e ffects on caregivers’ employers, are not considered.
The main limitation and opportunity for future research in the calculation of the costs of ESRD is in the procedure used for data collection. The questionnaires were distributed to patients and caregivers when they came to the dialysis center for treatment. Questionnaires were returned at a later date. Face-to-face interviews may have been a better procedure to obtain the case study data. Such a procedure may have eliminated some of the missing observations and trained interviewers could have explained any ambiguities in the questionnaire. In addition, in face-to-face interviews perceptions on definitions for cost categories and caregiving behaviors may be more standardized.
Time costs for all patients and all informal caregivers time are calculated using the same rate. However, the opportunity costs of time between patients and caregivers, between working individuals and retired individuals, and between rich persons and poor persons may be diff e r e n t . Such ethical issues are beyond the scope of this study. ESRD may create externalities, given the institutional arrangements, which pay the majority of the costs associated with the disease. For example, increases in the incidence of ESRD will increase society’s economic burden, which may increase of taxpayers’ financial burden for the disease. Further, insurance rates may increase if the incidence of the disease increases. Examining the costs of diseases in an externality framework may be a fruitful approach. Concerning inferences, the calculated ESRD costs in this study may not be applicable to the other regions. Expanding the study to patients beyond those at a single dialysis unit would make the results more applicable to a wider-based ESRD population.
November 2003, http://aspe.hhs.gov/daltcp/reports/trends.htm. Wolf, Douglas, and Beth Soldo. (Autumn 1994), “Married Wo m e n ’s
Allocation of Time to Employment and Care of Elderly Parents,”
Journal of Human Resourc e s , 29(4): 1259~1276. C a regiving with Work and the Costs Involved, Metropolitan Life
Insurance Company.
National Center for Health Statistics. (November 27, 2003), Trend Ta b l e s , h t t p : / / w w w. c d c . g o v / n c h s / p r o d u c t s / p u b s / p u b d / h u s / 0 3 h u s t o p . h t m . National Institute of Diabetes and Digestive and Kidney Disease. (August
30, 2003), Kidney Failure Glossary, h t t p : / / k i d n e y. n i d d k . n i h . g o v / k u d i s e a s e s / p u b s / p d f / g l o s s a r y. p d f .
S h e l l e n b a rg e r, S. (June 20, 2002), “Wanted: Caregiver for Elderly Woman; Only Family Members Need Apply,” The Wall Stre e t
J o u r n a l , D 1 .
S i l b e r b e rg, E. (1990), The Stru c t u re of Economics: A Mathematical
A n a l y s i s , 2n dEdition, McGraw-Hill, INC.
Stone, R.I., and Peter Kemper. (1990), “Spouses and Children of Disabled Elders: How Large a Constituency for Long-Term Care Reform?,” The Milbank Quart e r l y, 67(3-4): 485~506.
Task Force on Aging Research. (1994), “Threshold of Discovery: Future Directions for Research on Aging,” Final report submitted to the Committee on Labor and Human Resources of the Senate (P.L. 101-557, Section 304).
U.S. Renal Data System. (February 27, 2003a), Annual Data Report
2 0 0 2 , h t t p : / / w w w. u s r d s . o rg / 2 0 0 2 / p d f / k . p d f .
U.S. Renal Data System. (November 30, 2003b), Annual Data Report
2 0 0 3 , h t t p : / / w w w. u s r d s . o rg / 2 0 0 3 / p d f / b _ 0 3 . p d f .
U.S. Renal Data System. (November 30, 2003c), Annual Data Report , h t t p : / / w w w. u s r d s . o rg / a d r. h t m .
Waidmann, Timothy A. and Kenneth G. Manton. (June 18, 1998), “International Evidence on Disability Trends Among the Elderly, ” U.S. Department of Health and Human Services, Accessed
기에는 간병인들에게 나타나는 질적인 변화(건강에 대한 영향, 생활패턴의 변화 등)는 화폐가치로 계산되지 않았다. 하지만 시간에 대한 임금률을 다 르게 적용할 경우 이 비율은 최대 2 5 %까지 증가한다. 또한 무상간병이라 는 활동에 대한 인식에 있어 환자와 간병인들 간에 차이가 나타났다. 예를 들어 신장투석센터까지 데려다주는 행위를 환자들은 간병인 아닌 가족으 로서 해야 할 당연한 행위로 생각하는 반면 간병인들은 그런 행위를 간병 으로 생각한다는 것이다. 따라서 환자들은 자신들이 원하는 만큼의 간병이 제공되지 못한다고 느끼는 반면, 간병인들은 충분한 간병을 제공하고 있다 는 인식의 차이를 확인하였다. 본 연구에서는 지금까지 상대적으로 관심을 가지지 못하였던 말기신장 병의 비용과, 그 중에서도 말기신장병 환자를 간병하는 무상간병인의 노동 가치를 계산해 보았다는데 그 의의가 있다.
Informal Caregiving in the Costs of Disease: Case Study of End Stage Renal Disease 1 1 1
많은 사람들이 그들의 병든 가족, 친지, 또는 친구들을 위해 금전적인 보 상을 받지 않고 간병을 한다. 이들이 환자의 간병을 위해 소요한 시간, 간 병으로 인한 임금손실, 정신적 피해, 그 밖의 생활에서의 변화 등은 질병의 비용을 계산하는데 있어 포함되어야 할 요소들임에 틀림없다. 하지만, 많은 무상간병인들은 자신이 하는 간병의 가치를 평가절하 하는 듯 하다. 말기 신장병(End Stage Renal Disease, ESRD)은 많은 간병을 필요로 하는 질 병의 하나로, 미국의 경우 1 9 9 7년에 말기신장병 환자들의 직접 의료비로만 약 1 5 0억 달러(약 1 8조원)의 예산을 사용하였다. 또한 말기신장병의 발병 건수나, 이로 인한 사망건수는 매년 증가하고 있는 추세이다. 본 연구의 목적은 질병과 관련된 비용을 계산하는데 있어 환자뿐만 아 니라, 그들의 무상간병인이 부담해야 하는 비용까지 포함시켜 광의의 개념 으로써의 비용을 제시하는 것이다. 여기서의 비용이란 말기신장병환자가 부담해야 하는 직・간접 의료비, 임금손실 등을 포함한 환자의 기회비용, 그리고 그 환자의 무상간병인이 간병으로 인해 추가적으로 부담해야 하는 비용 및 간병인의 기회비용을 모두 포함한다. 본 연구에서는 무상간병인의 노동가치를 알아보기 위하여 설문조사를 실시하였다. 설문조사는 2 0 0 2년 1 1월부터 2 0 0 3년 1월까지 3개월에 걸쳐 실 시되었으며 조사지역과 조사대상은 미국 텍사스주 중부의 세개 C o u n t y에 거주하는 1 1 5명의 말기신장병 환자들과 그들의 무상간병인들이다. 조사결과, 말기신장병에 소요되는 전체 비용 $9 1 , 3 4 6(건당) 중에서 무 상간병인이 차지하는 비용은 약 4 . 5 %(약 $4 , 0 0 0)인 것으로 나타났다. 여 1 1 0 保健社會硏究 第2 4卷 第2號
질병비용 중 무상간병인의 비용에 관한 연구:
말기신장병 사례를 중심으로
張元翼・James W. Mjelde・Sherry I. Bame・Frederick Tan