저작자표시-비영리-변경금지 2.0 대한민국 이용자는 아래의 조건을 따르는 경우에 한하여 자유롭게 l 이 저작물을 복제, 배포, 전송, 전시, 공연 및 방송할 수 있습니다. 다음과 같은 조건을 따라야 합니다: l 귀하는, 이 저작물의 재이용이나 배포의 경우, 이 저작물에 적용된 이용허락조건 을 명확하게 나타내어야 합니다. l 저작권자로부터 별도의 허가를 받으면 이러한 조건들은 적용되지 않습니다. 저작권법에 따른 이용자의 권리는 위의 내용에 의하여 영향을 받지 않습니다. 이것은 이용허락규약(Legal Code)을 이해하기 쉽게 요약한 것입니다. Disclaimer 저작자표시. 귀하는 원저작자를 표시하여야 합니다. 비영리. 귀하는 이 저작물을 영리 목적으로 이용할 수 없습니다. 변경금지. 귀하는 이 저작물을 개작, 변형 또는 가공할 수 없습니다.
A Study on Contact-electrification Behaviour of
Metal-Organic Frameworks for Triboelectric
Nanogenerators and Self-powered Sensors
GAURAV KHANDELWAL
Faculty of Applied Energy Systems
Department of Mechatronics Engineering
GRADUATE SCHOOL
JEJU NATIONAL UNIVERSITY
A Study on Contact-electrification Behaviour of Metal-Organic
Frameworks for Triboelectric Nanogenerators and
Self-powered Sensors
Gaurav Khandelwal
(
Supervised by Professor Kim Sang-Jae)A thesis submitted in partial fulfillment of the requirement for the degree of Doctor of Philosophy
2020.06.19
The thesis has been examined and approved
Thesis Director, Professor, Faculty of Wind Energy Engineering Prof. Kim Bumsuk Graduate School, Jeju National University Thesis Committee Member, Professor, Department of Electronic Engineering Prof. Kim Woo Young Jeju National University
Thesis Committee Member, Professor, Department of Chemical Engineering Prof. Lee Hyomin Jeju National University
Thesis Committee Member, Professor, Department of Telecommunication Engineering Prof. Choi Min Seok Jeju National University
Thesis Committee Member, Professor, Department of Mechatronics Engineering Prof. Kim Sang-Jae Jeju National University
June 2020
Faculty of Applied Energy System Department of Mechatronics Engineering
Graduate School Jeju National University
Dedicated
to my Beloved
Family and
Acknowledgment
I take this privilege and pleasure to acknowledge the contributions of individuals who have been inspirational and supportive throughout my work. My work bears the imprint of all those people; I am grateful to. It is a pleasure to convey my gratitude to all of them in my humble acknowledgment.
First of all, I sincerely acknowledge my gratitude to my guide, Prof. Sang Jae Kim, for his excellent guidance, keen interest, continuous encouragement, and affection throughout this study and endowed me with the most precious knowledge to see success in my endeavor. I wish to reciprocate feelings of thanks to each member of Nano Materials and Systems Laboratory (NMSL). I express my sincere thanks to the alumni of the NMSL for their encouragement during the work. I will never forget to express thanks to all my friends, seniors, and juniors for their constant formal and informal support. My thanks are also to all other members (teaching and nonteaching) for their help at all stages of my work.
Last in the line, but first in my mind, I extend my most profound sense of gratitude to my Family and my Beloved wife for supporting in all the conditions and whose belief, love, patience, and blessings made me complete this project.
Thank you
Thesis Overview–I
Thesis Overview-II
Design of metal-organic frameworks based triboelectric nanogenerators for self-powered applications
i
Contents
Contents i Nomenclature vii List of Tables ix List of figures xAbstract – Hangul xxviii
Abstract – English xxxiii
Chapter -I
Introduction
1.1. Background 1
1.2 Fundamentals of TENG 3
1.3 Theoretical origin of TENG 5
1.4 Working modes of TENG 7
1.4.1Vertical contact-separation (C-S) mode 7
1.4.2 Lateral sliding (LS) mode 8
1.4.3Single electrode (SE) mode 8
1.4.4 Freestanding triboelectric-layer (FT) mode 9
1.5 Figure of merits 10
1.6 Materials for TENG 12
1.7 Research progress of TENG 16
1.8 Applications of TENG 17
1.9 Objective and scope of the thesis 19
ii
Chapter -II
Materials and Methods
2.1 Chemicals and reagents 30
2.2. Cell lines 32 2.3 Apparatus 32 2.4 Electrical Characterization 34 2.5 Material Characterization 36 2.5.1 X-ray diffraction 36 2.5.2 Raman spectroscopy 37
2.5.3 Fourier transform infrared spectroscopy 37
2.5.4 Field-emission scanning electron microscopy 38
2.5.5 Energy-dispersive X-ray spectroscopy 39
2.5.6 Atomic force microscopy and Kelvin probe force microscopy 39
2.5.7 3D optical surface profiler 41
2.5.8Thermogravimetric analysis 42
2.5.9 Ultraviolet-visible spectroscopy 42
2.6 Cell line studies 43
2.6.1 Method I 43
2.6.2 Method II 44
iii
Chapter -III
3.1 Trash to Energy: A Facile, Robust and Cheap Approach for Mitigating
Environment Pollutant Using Household Triboelectric Nanogenerator
3.1.1 Introduction 48
3.1.2 Experimental Section 51
3.1.2.1Fabrication of the H-TENG 51
3.1.3 Results and Discussion 52
3.1.4 Conclusion 68
3.2 Phase Inversion Enabled Energy Scavenger: A Multifunctional Triboelectric
Nanogenerator as Benzene Monitoring System
3.2.1 Introduction 78
3.2.2 Experimental 80
3.2.2.1Preparation of PVDF/TiO2 film 80
3.2.2.2Preparation of PVDF/TiO2 by the phase-inversion process 80
3.2.2.3 Preparation of Cellulose acetate film 81
3.2.2.4 Fabrication of triboelectric nanogenerator 81
3.2.3 Results and Discussions 82
3.2.4 Conclusion 96
3.3 All Edible Materials Derived Biocompatible and Biodegradable Triboelectric
Nanogenerator
3.3.1 Introduction 104
3.3.2 Experimental 105
3.3.2.1 Sample preparation for Cell studies 105
3.3.2.2 Cell viability assay (MTT assay) 105
3.3.2.3Cell imaging 106
iv
3.3.2.5 Device fabrication 106
3.3.3 Results and Discussions 106
3.3.4 Conclusion 119
CHAPTER IV
Zeolitic Imidazole Framework: A Metal-Organic Framework Subfamily Members
for Triboelectric Nanogenerator
4.1 Introduction 126
4.2 Experimental 128
4.2.1 Synthesis of ZIFs 128
4.2.2 Fabrication of ZIF-TENG 129
4.3 Results and Discussions 129
4.4 Conclusion 144
CHAPTER V
ZIF-62: A Mixed Linker Metal-organic Framework for Triboelectric
Nanogenerator
5.1 Introduction 152 5.2 Experimental 153 5.2.1 Synthesis of ZIF-62 153 5.2.2 Crystal Structure 153 5.2.3 Device fabrication 1535.3 Results and Discussions 154
v
CHAPTER VI
Metal-organic Framework: A Novel Material for Triboelectric Nanogenerator
based Self-powered Sensors and Systems
6.1 Introduction 172
6.2 Experimental 174
6.2.1 Growth of ZIF-8 174
6.2.2 Fabrication of MOF-TENG 174
6.3 Results and Discussions 174
6.4 Conclusion 193
CHAPTER VII
Metal-biomolecule Nanofibers: A Novel Material for Triboelectric
Nanogenerator and Self-powered Sensors
7.1 Introduction 200
7.2 Experimental 202
7.2.1 Synthesis of Cu-Asp NFs 202
7.2.2 Synthesis of MgO nanosheets 202
7.2.3 Coating on various substrate 202
7.2.4 Fabrication of TENG 202
7.3 Results and Discussions 204
vi
CHAPTER VIII
Summary and Future Perspective
8.1 Summary 225 8.2 Future Perspective 228 Appendix A 230 Appendix B 233 Appendix C 236 Appendix D 237 Declaration 238
vii
Nomenclature
COTS Commercial of-the-shelf
TENG Triboelectric nanogenerator
C-S Contact-separation
LS Lateral sliding
SE Single electrode
FT Freestanding
FOM Figure of merits
CFT Contact freestanding triboelectric
SFT Sliding freestanding triboelectric
SEC Single electrode contact
TECD Triboelectric charge density
MOF Metal organic framework
MBIOF Metal biomolecule framework
XRD X-ray diffraction
FE-SEM Field emission scanning electron microscope
EDS Energy dispersive X-ray spectroscopy
FT-IR Fourier transform infrared
AFM Atomic force microscope
KPFM Kelvin probe force microscope
viii
UV Ultraviolet
LED Light emitting diode
H-TENG Household triboelectric nanogenerator
PP Polypropylene
PE Polyethylene
PU Polyurethance
AC Alternating current
DC Direct current
VOC Volatile organic compound
E-TENG Edible TENG
ZIF Zeolitic imidazole framework
OC Open circuit
CCDC Cambridge crystallographic data centre
ix
List of Tables
Table No. Table Caption Pg. No.
Table 2.1 List of chemicals and reagents used in the research work. 30-32
Table 2.2 The details of the used cell lines. 32
Table 2.3 List of the apparatus used for the research. 32-33
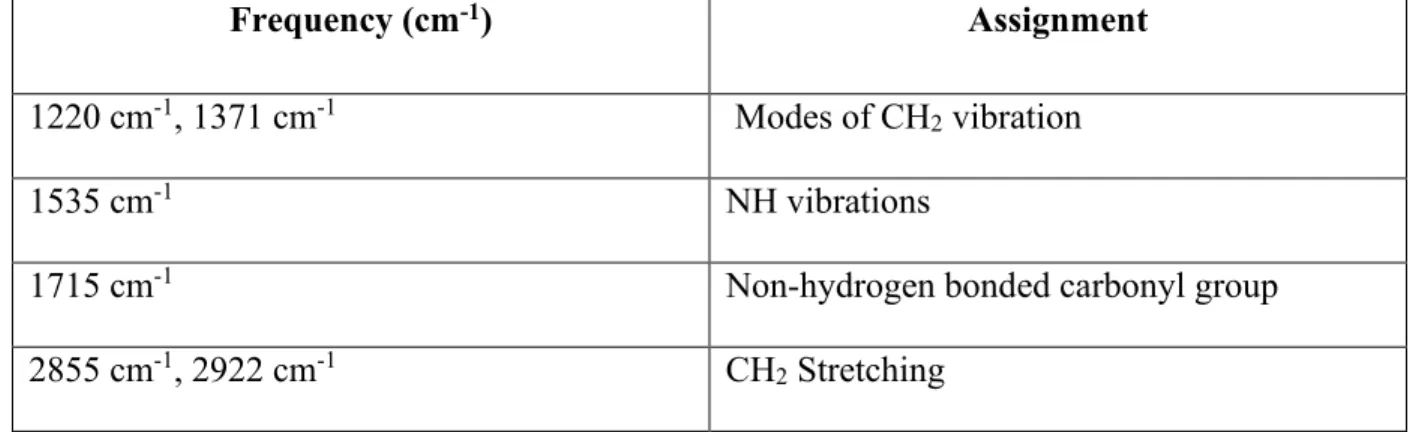
Table 3.1.1 Band assignment of polyethylene revealed from Raman spectra. 54 Table 3.1.2 Band assignment of polypropylene revealed from Raman spectra. 55 Table 3.1.3 Band assignment of polyurethane foam revealed from Raman
spectra.
55
Table 3.1.4 Band assignments of the substrate as revealed from Raman
spectra. 56
Table 3.1.5 Band assignments of polyethylene as revealed from FT-IR spectra. 56 Table 3.1.6 Band assignments of polypropylene as revealed from FT-IR
spectra. 56-57
Table 3.1.7 Band assignments of polyurethane foam as revealed from FT-IR spectra.
57
Table 3.1.8 Band assignments of the substrate as revealed from FT-IR
spectra. 57
Table 4.1 The XRD peak position and indices for ZIF-7, ZIF-9, ZIF-11, and ZIF12.
133
x
List of Figures
Figure No. Figure Caption Pg. No.
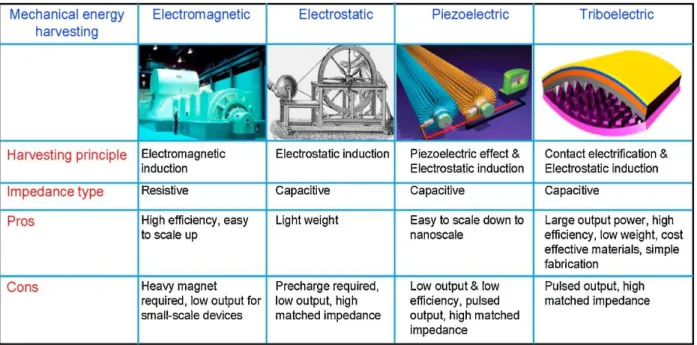
Figure 1.1 The power requirement of the various COTS components 2 Figure 1.2 The comparison of various mechanical energy harvester,
summarizing the principle, advantages, and disadvantages of the harvesting approach.
3
Figure 1.3 (a) Wimshurst machine and Van de Graaff generator. Reproduced with permission [7]. Copyright American Chemical Society. (b) The demonstration of van de Graaff generator at MIT museum.
4
Figure 1.4 (a) The C-S mode TENG for displacement current model. (b) The TENG representation using the capacitor model.
6
Figure 1.5 Working modes of TENG (a) Vertical contact-separation mode. (b) Lateral sliding mode. (c) Single electrode mode and (d) Freestanding triboelectric layer mode.
9
Figure 1.6 The illustration of factors affecting the output of TENG and figure of merits for TENG.
11
Figure 1.7 Triboelectric series developed by AlphaLab. 12
Figure 1.8 Triboelectric series of 2D layered materials. 14
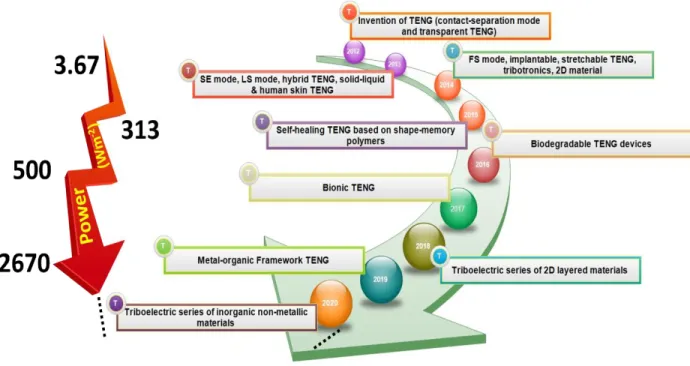
Figure 1.9 The quantified triboelectric series developed by Zou et al. 15 Figure 1.10 The roadmap summarizing the progress in the TENG. 17
xi
Figure 1.11 Applications of TENG. 18
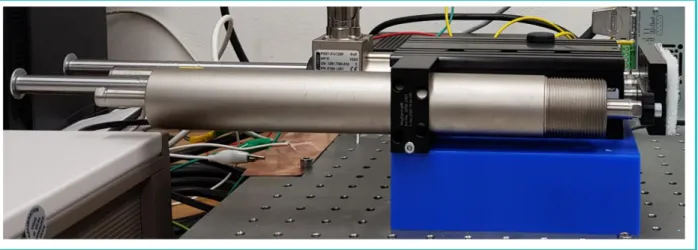
Figure 2.1 Linear motor for applying force to the device during electrical measurement.
34
Figure 2.2 Electrical characterization system. (a) High impedance electrometer. (b) A mixed domain oscilloscope. (c) The electrostatic voltmeter and (d) Low noise current preamplifier.
35
Figure 2.3 PAnalytical Empyrean XRD measurement system. 36
Figure 2.4 Horiba LabRAM HR Raman measurement system. 37
Figure 2.5 Thermo Scientific Nicolet-6700 FT-IR measurement system. 38
Figure 2.6 Tescan MIRA 3 FE-SEM system. 39
Figure 2.7 Bruker Multimode 8 AFM system. 40
Figure 2.8 Nanosystem NV 2200 3D optical surface profiler. 41
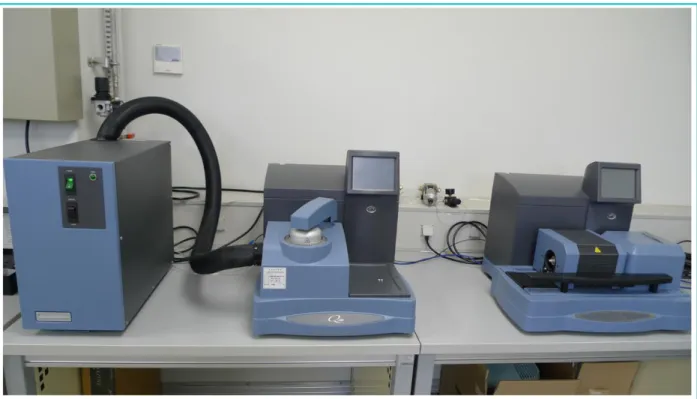
Figure 2.9 TA instruments TGA and DSC system. 42
Figure 2.10 Perkim Elmer Lambda 950, UV-VIS spectrophotometer. 43
Figure 3.1.1 Global statistics for generated plastic waste. (a) The proportion of plastic waste reaching the ocean relative to the total plastic waste produced. (b) The distribution of plastic waste in different countries according to PlasticsEurope, EuPC, EuPR, EPRO and Consultic (2009). (c) Projection of plastic waste production according to Ocean Summit 2015, plastic items collected from coastal areas according to international coastal clean-up data for 2014, and the number of taxa affected by plastic waste that reaches the ocean.
xii
Figure 3.1.2 (a) The recycled waste materials used for the fabrication of household triboelectric nanogenerator (H-TENG). (b) Three-dimensional schematic illustration of the H-TENG. (c) Schematic illustration of the H-TENG fabrication.
52
Figure 3.1.3 Digital images. (a) The contact-seperation distance of the device. (b) The thickness of the materials used in the device1-6.
53
Figure 3.1.4 (a–b) Raman spectra recorded at room temperature for the waste materials and supporting substrate. (c–d) Fourier transform-infrared (FT-IR) spectra recorded at room temperature for the waste materials and supporting substrate. (e) Chemical structures of the materials.
54
Figure 3.1.5 (a) The basic electricity generation mechanism for the H-TENG in the vertical contact-separation configuration. (b–c) Voltage and current measurement results of the H-TENG with a working area of 9 cm2.
59
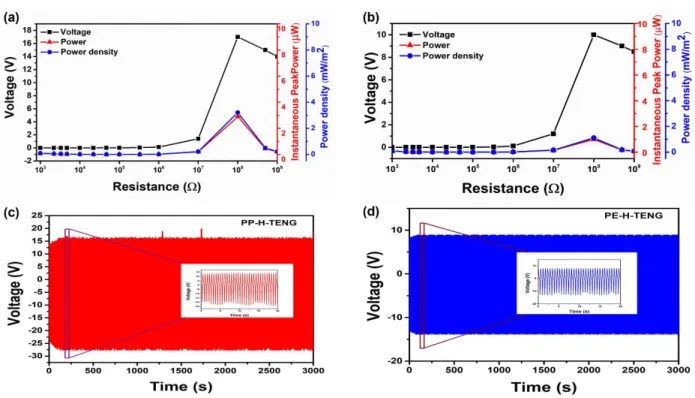
Figure 3.1.6 Electrical performance of the H-TENG as an energy harvester. (a) Output voltage, power and power density of the PP-H-TENG for external load matching. (b) Output voltage, power and power density of the PE-H-TENG for external load matching. (c–d) Output voltages for the PP- and PE-H-TENGs during the application of the external force for 3,000 cycles.
60
Figure 3.1.7 The stability of the device in initial and after 2 months of fabrication (a) PP-H-TENG and (b) PE-H-TENG.
xiii
Figure 3.1.8 Charging and discharging behaviour of the capacitor. (a) Charging of five different capacitors (10, 32, 47, 69 nF, 0.1 µF) by the PP-H-TENG. (b) Charge–discharge behaviour of a 0.1-µF capacitor charged by the PP-H-TENG. (c) Charging of five different capacitors (10, 32, 47, 69 nF, 0.1 µF) by the PE-H-TENG. (d) Charge–discharge behaviour of a 0.1-µF capacitor charged by the PE-H-TENG.
62
Figure 3.1.9 Real-time data for harnessing biomechanical energy by the H-TENG. Use of the (a–b) PP-H-TENG and (c–d)PE-H-TENG to harness the biomechanical energy generated by hand and leg motions. (e) Voltage generated by biomechanical hand and leg motions using the PP- and PE-H-TENGs.
63
Figure 3.1.10 Fitted curve for short circuit current in response to dynamic force ranging from ~ 2 kPa- 12 kPa.
64
Figure 3.1.11 (a) Schematic illustration of an emergency exit door indicator system where light-emitting diodes (LEDs) were connected to two stacked PP-H-TENGs. (b) The emergency indicator system; tapping the system generates triboelectricity that illuminates a directional arrow pointing towards the exit.
65
Figure 3.1.12 (a-c) Schematic illustration for the fabrication of energy harvesting chopping board. (d) Optical images during device pressing, board pressing, potato and tomato cutting. (e) The electrical response of chopping board for device pressing, board pressing, cutting potato and tomato.
xiv
Figure 3.1.13 The voltage output showing stability of chopping board with wetting and drying process.
67
Figure 3.1.14 Intrusion monitoring system. (a) Showing the arrangement of the devices, when a person moves from one device to other output will generate in the corresponding channel. (b) Shows the output for different devices connected to the multi-channel system, if person's feet are on the first device then output generated only in a channel connected to device 1 and so on. (c) The output in the case when the person's feet are on different devices. (d) Optical image for the real-time placement of the devices outside the door.
68
Figure 3.2.1 (a) Three-dimensional schematic representation of TENG in
contact-separation mode. (b) The step by step procedure for the fabrication of TENG. (c) XRD spectra of TiO2
microparticles. (d) FE-SEM micrograph of TiO2
microparticles. (e) FT-IR spectra of the films at different concentration.
82
Figure 3.2.2 The XRD spectrum for PVDF-5-TiO2, PVDF-10-TiO2,PVDF-15-TiO2
phase inversion films confirm that there is no change in the TiO2
microstructure after incorporating in the polymer matrix.
83
Figure 3.2.3 FE-SEM micrograph of (a) PVDF-TiO2 (b) PVDF-5_TiO2 (c)
PVDF-10-TiO2 and (d) PVDF-15-TiO2 films.
85
Figure 3.2.4 The working mechanism of as-fabricated TENG in vertical
contact-separation mode.
xv
Figure 3.2.5 (a, b) The voltage and short-circuit current output for
PVDF-TiO2/CA and PVDF-5-TiO2/CA TENG respectively. (c, d)
The voltage and short-circuit current output for PVDF-5-TiO2/CA, PVDF-10-TiO2/CA, PVDF-15-TiO2/CA TENG.
87
Figure 3.2.6 (a) The load matching analysis for PVDF-10-TiO2/CA TENG.
(b) Stability of the PVDF-10-TiO2/CA TENG for 1500 s. (c)
The voltage profile of capacitor charging (0.1, 0.22 and 1μF). (d) The charge-discharge cycle of 1μF capacitor. (e) The energy stored in various capacitors at different charged voltage. (f) Effect of filler concentration on the power density of TENG.
89
Figure 3.2.7 Biomechanical energy harvesting using (a) hand motion (b) finger tapping and (c) leg motion.
91
Figure 3.2.8 (a) A straightforward, cost-effective wind energy harvesting system. (b) Voltage output of TENG device at different rpm. (c) Charge-discharge cycle for 2.2μF capacitor and (d) The Lit-up of monochrome LCD, LEDs and LED strip using the energy harvested by TENG.
91
Figure 3.2.9 The utilization of TENG for VOCs sensing. (a) The schematic
of in-house designed setup for the generation of VOCs and sensing measurement. (b) The image of the designed setup. (c) The voltage output with the concentration of the benzene. (d,e) The variation in the voltage with the concentration and
xvi
total flow rate respectively. (f,g) The response of the sensor with the concentration and total flow rate. (h) The integration of the benzene sensor with Arduino Uno for buzzing the alarm to evacuate the area.
Figure 3.2.10 The response of the TENG against various VOC vapors (20861
ppm). 95
Figure 3.3.1 (a) Schematic illustration for the device fabrication. (b) The 3D
illustration of the single electrode E-TENG device. (c) The optical image of the fabricated device (i) the resistance offered by the edible silver leaf, (ii) the adherence and bending of the silver leaf coated Laver, (iii) weight of the fabricated device confirming the ultra-light weight of the device.
107
Figure 3.3.2 (a-c) The flexibility of laver in different bending conditions. 108
Figure 3.3.3 The device mechanism in single electrode mode. (a-d) Charge distribution for a complete cycle of output a) comes in complete contact, b) departs from, c) complete far away and d) approach the friction layer.
109
Figure 3.3.4 (a) The FE-SEM image of the Laver. (b) FE-SEM image and
EDS mapping of the edible silver leaf. (c) 2D surface roughness profile of the Laver. (c) 3D surface roughness profile of the Laver. (e) A.F.M image of the Laver which matches with the FE-SEM image. (f) KPFM image for
xvii
potential mapping confirming the positive triboelectric property of the device.
Figure 3.3.5 The output of the device in vertical contact separation mode with Laver-FEP, Laver-PET and Laver-Paper as the materials.
111
Figure 3.3.6 The surface potential on laver on hitting once with the kapton. 112
Figure 3.3.7 The in vitro studies to examine the effects of the Laver and
coated Laver on the viability of HeLa cells. (a) The viability of was examined in the control and in the cells treated for 24 and 48 h by MTT assay. (b-e) The control and treated cells were examined under a phase contrast microscope at 10X magnification. (f-i) The morphological changes in the cell nucleus was examined by DAPI staining under fluorescence microscope at 40X magnification.
113
Figure 3.3.8 The study of the coated Laver and rice sheet in PBS buffer for
0, 1, 2, 4, 5, 6, 15 and 28 d respectively.
114
Figure 3.3.9 The bioresorbability of the E-TENG in the simulated gastric juice. 115
Figure 3.3.10 The detailed electrical performance of the E-TENG device.
(a,b) The voltage and current output when different material comes in frictional contact with the device. The charge profile for the PVC and FEP giving high output. (d) The stability of the device for 1000 cycles. (e) The stability of the device for 5, 10, 15, and 18 days. There is a negligible change in the output up to 10 days. (f) Load matching analysis for the E-TENG
xviii
across various resistances. (g) The capacitor charging for 0.1, 0.22, and 1 μF capacitor using the E-TENG. (h) The energy stored in the capacitor corresponding to 1, 2, and 3 V charging.
Figure 3.3.11 The optical image of the large device a) front view, b) back view. c) The bending of the large device showing the adherence of the silver leaf. d) The voltage and current output of the device.
117
Figure 3.3.12 The powering up of various electronics using 50 μF capacitor for (a) commercial hygrometer, (c) wrist-watch, (e) UV-LEDs, and (g) green LEDs. The capacitor charging and discharging during lit-up of electronics for (b) commercial hygrometer, (d) wrist-watch, (f) UV-LEDs and (h) green UV-LEDs.
118
Figure 4.1 Crystal structure of a) ZIF-7, b) ZIF-9, c) ZIF-11 and d) ZIF-12 (.cif file was downloaded from The Cambridge crystallography data centre, CCDC). E) XRD spectra of ZIFs. F) FT-IR spectra of ZIFs.
130
Figure 4.2 The FE-SEM images of 2) ZIF-7, b) ZIF-9, c) ZIF-11, and d) ZIF-12 with inset showing high magnification image.
132
Figure 4.3 The 2D surface profile image for 2) ZIF-7, b) ZIF-9, c) ZIF-11 and d) ZIF-12. E) temporal surface potential of the ZIFs obtained after 50 contacts with Kapton film. F) The bar plot is summarizing the surface potential profile of the ZIFs.
133
Figure 4.4 The x and y-direction line roughness profile for a) ZIF-7, b) ZIF-9, c) ZIF-11, and d) ZIF-12.
xix
Figure 4.5 a) 3D layer view depiction of ZIF-TENG (inset showing the molecular structure of the materials). b-c) The voltage versus time and current versus time graph for different ZIF-TENG, respectively. d) Charge profile of the different ZIF-TENG devices. e) The summarized results for voltage, current, and charge generated by various ZIF-TENG.
136
Figure 4.6 The schematic representation of the ZIF-TENG working mechanism in contact-separation mode with different stages viz. pressed, releasing, released, and pressing.
138
Figure 4.7 The detailed electrical performance of ZIFs TENG with ethyl cellulose as the opposite layer. a-b) The open-circuit voltage and current for different ZIF-TENG devices. c) The charge profile for the four different ZIF-TENG devices. d) The summarized result for the voltage, current, and charge generated by different ZIF-TENG.
129
Figure 4.8 a) The 1500 s endurance test for ZIF-7 TENG. b) Load matching analysis across various loads for ZIF-7 TENG; the maximum peak power is obtained at 100 MΩ. C) The bar graph depiction for power obtained by different ZIF-TENG. d) The charging graph for various capacitors (0.22, 0.5 and 1 μF) charged using ZIF-7 TENG. e) The charge-discharge cycle of 1 μF capacitor charged by ZIF-7 TENG. f) The energy stored corresponding to 1 and 2 V charging of different capacitors.
xx
Figure 4.9 The 1500 s endurance test for a) ZIF-9, b) ZIF-11, c) ZIF-12 TENG. The load matching analysis for d) ZIF-9, e) ZIF-11, and f) ZIF-12 TENG devices.
141
Figure 4.10 The capacitor charging graph for various capacitors (0.22, 0.5, and 1μF) charged using the output generated by a) ZIF-9, b) ZIF-11, and c) ZIF-12. The charge-discharge cycle for the 1 μF capacitor charged by the output of d) ZIF-9, e) ZIF-11, and f) ZIF-12 TENG devices.
143
Figure 4.11 a) 100 μF capacitor charging using four ZIF-7 TENG devices to drive electronics. The powering up of electronics using 100 μF capacitor for b) calculator, c) UV LEDs, d) commercial hygro-thermometer, e) wristwatch and f) IR LEDs.
144
Figure 5.1 Structural and morphological characterization of ZIF-62. (a) Crystal structure of ZIF-62 (.cif file was retrieved from CCDC). (b) XRD spectra of ZIF-62. (C) FT-IR spectra of ZIF-62. (d) Raman spectra of ZIF-62 and (e) FE-SEM revealing the morphology of the particles and EDS mapping analysis is confirming the presence of different elements.
155
Figure 5.2 (a) KPFM, surface potential image of ZIF-62 with inset
showing the corresponding AFM image. (b) 2D surface roughness profile image of ZIF-62 and (c) 3D exploded view of the ZIF-62 TENG device.
xxi
Figure 5.3 The schematic for the device mechanism in contact-separation
mode showing the different stages that occur during the working (pressed, releasing, released, and pressing).
157
Figure 5.4 Output performance of the ZIF-62 TENG. (a-c) The generated
voltage, current, and charge profile of the ZIF-62 with different opposite layers (Teflon, Kapton, and ethyl cellulose), respectively. (d) Surface potential developed on ZIF-62 after 60 contacts with Teflon, Kapton, and ethyl cellulose film and (e-f) The voltage and current versus time graph for ZIF-62/Teflon TENG at various frequency.
160
Figure 5.5 (a) The open-circuit voltage profile of the ZIF-62 TENG. (b) The endurance test for ZIF-63 TENG performed for 1600 s. (c) The load matching analysis across different loads; the maximum power density, was obtained at 500 MΩ. (d) The capacitor charging profile for 0.1, 0.22, and 1μF capacitor charged by the device. (e) The charge and self-discharge behavior of the 1 μF capacitor. (f) The stored energy in the capacitor corresponding to 1, 2, and 3V charging of various capacitors.
161
Figure 5.6 Fitness tracking and energy harvesting during (a) hand curls, (b) shoulder press, (c) lateral raises, and (d) squats exercises performed in the gym.
163
Figure 5.7 Powering of low-rating electronics via 20 μF capacitor charged by the ZIF-62 TENG device for (a) Commercial thermometer, (b) UV
xxii
LEDs, (c) wristwatch, and (d) calculator along with the capacitor charge-discharge profile during turning on the electronics. Figure 6.1 (a) The structure of ZIF-8 with zinc-nitrogen tetrahedra. (b)
XRD spectra of ZIF-8 (c) Raman spectra of ZIF-8. (d) FT-IR
spectra of ZIF-8. (e) FE-SEM and EDS mapping analysis of the ZIF-8.
175
Figure 6.2 The FE-SEM image of (a) 30-cyc grown ZIF-8 and (b) 50-cyc grown
ZIF-8. 177
Figure 6.3 (a) The AFM image of the 20-cyc ZIF-8 resembles with the
FE-SEM analysis. (b) The KPFM of 20-cyc ZIF-8 is confirming the positive VCPD. (c-e) 2D surface profile images
for 20-cyc, 30-cyc, and 50-cyc ZIF-8 respectively. (f) 3-D schematic illustration of the designed MOF-TENG.
179
Figure 6.4 The surface potential mapping using KPFM for (a) 30-cyc ZIF-8 and (b) 50-cyc ZIF-8.
180
Figure 6.5 The 3D profile, X-direction, and Y-direction line roughness profile of the (a-c) 20-cyc ZIF-8. (d-f) 30-cyc ZIF-8 and (g-i) 50-cyc ZIF-8.
181
Figure 6.6 The schematic illustration of mechanism in contact-separation mode with different stages viz. releasing, released, pressing and pressed.
182
Figure 6.7 The detailed electrical performance analysis of MOF-TENG
(a) The voltage v/s time graph for different cycle grown ZIF-8. (b) The current v/s time graph for different cycle grown
xxiii
ZIF-8. (c) The stability analysis for the 1400 s. (d) Load matching analysis performed at different loads (e) The charging of the different capacitor (0.22 µF, 1 µF, 2.2 µF) up to 2V. (f) The charging and discharging cycle of 2.2 µF capacitor.
Figure 6.8 The continuity check analysis using multimeter for (a) 10-cyc ZIF-8 (b) 20-cyc ZIF-8 (c) 30-cyc ZIF-8 and (d) 50-cyc ZIF-8. The 10 cycles are not sufficient to grow the ZIF-8 over the substrate.
185
Figure 6.9 (a) The voltage of 15-cyc and 18-cyc grown ZIF-8. (b) The current profile of 15-cyc and 18-cyc grown ZIF-8.
186
Figure 6.10 The stability of the device to ensure the durability for long-term
use. 186
Figure 6.11 (a) The capacitor charging circuit (b) the energy stored in different capacitors for 1 V and 2 V charging (c) the voltage v/s time graph for 100 µF capacitor charging.
187
Figure 6.12 (a) The lit-up of the temperature sensor for 10s with 100 µF
capacitor. (b) The designed self-powered UV counterfeit system is showing the three different areas for the security feature under UV light.
187
Figure 6.13 (a) The circuit for wireless charging. (b) The time consumed for direct and wireless charging with the battery charging profile and the transferred voltage profile.
xxiv
Figure 6.14 (a) The mechanism for the interaction of tetracycline with ZIF-8 via electrostatic and π-π interaction. The voltage v/s time graph for the different concentration of tetracycline. The voltage decreases with the increase in tetracycline concentration ascribed to lowered tribo positive nature of the ZIF-8. (c) The bar graph for peak to peak voltage variation with the concentration of the tetracycline. (d) The % response of the device for various concentration with a correlation coefficient (R2) of 0.982.
190
Figure 6.15 The MOF-TENG can be refresh by simple washing. The data with sensing and refreshing confirms the reusability of the device. The output has negligible change after washing with methanol.
191
Figure 6.16 The response of other species. The tetracycline shows the maximum response followed by phenol confirming the selectivity of the device.
192
Figure 7.1 Figure 7.1. (a) XRD spectra of the Cu-Asp NFs. (b) FT-IR
spectra of Cu-Asp NFs with zoom image showing little peak 1620 cm-1. (c) UV-Vis absorbance spectra of Cu-Asp NFs. (d)
TGA analysis of the Cu-Asp NFs exhibiting three weight loses. (e) FE-SEM image of the Cu-Asp NFs confirming the morphology. (f) AFM image of the Cu-Asp NFs, where several NFs are stacked together.
203
Figure 7.2 (a) FE-SEM image of the synthesized MgO nanosheets with high magnification image shown in inset. (b) EDS mapping
xxv
confirming the presence of only Mg and O. (c) XRD spectra of MgO nanosheets confirming the purity and the cubic structure of the nanosheets.
Figure 7.3 MTT cell viability assay of MgO and Cu-Asp NFs (MBIOF) on (a) Dermal fibroblast cells and (b) Mammary epithelial cells.
205
Figure 7.4 Phase contrast microscopy image of MgO and Cu-Asp NF treated dermal fibroblast cells for 24 h and 48 h.
206
Figure 7.5 Phase contrast microscopy image of MgO and Cu-Asp NF treated mammary epithelial cells for 24 h and 48 h.
207
Figure 7.6 (a-b) FE-SEM and AFM image of the Cu-Asp NF coated Al foil respectively. (c) 2D optical profile image of the coated NFs. (d) The KPFM image for the coated NFs. (e) 3D schematic illustration of freestanding layer mode MBIOF-TENG.
208
Figure 7.7 (a) The voltage output with different contacting material in C-S mode TENG. (b) C-Schematic illustrating the assigned position of Cu-Asp NFs in the triboelectric series.
210
Figure 7.8 Electrical performance of the MBIOF-TENG. (a-b) Voltage and current output of the MBIOF-TENG respectively. (c) Open circuit voltage and the transferred charge for MBIOF-TENG. (d) Endurance test for 2000 s to demonstrate the
xxvi
stability of the device. (e-f) Voltage and current output respectively at different frequencies.
Figure 7.9 (a-b) Voltage and current output stability of MBIOF-TENG for a period of 30 days. (c) Voltage output across a range of resistance. (d) Power and power density of MBIOF-TENG across various resistances. (e) Capacitor charging of 0.22, 1 and 2.2 µF capacitors using MBIOF-TENG via a rectifier bridge. (f) Charge and self-discharge of 2.2 µF capacitor.
212
Figure 7.10 FE-SEM image before and after device operation for MBIOF-TENG.
213
Figure 7.11 The working mechanism of the MBIOF-TENG showing different stages exists during the operation.
214
Figure 7.12 Output performance of cMBIOF-TENG. (a) 3D schematic illustration of the contact-separation device (cMBIOF-TENG). (b-d) Voltage, current and transferred charge of the cMBIOF-TENG with Teflon, PDMS and PI as the opposite layer. (e) Open-circuit voltage of the cMBIOF-TENG with Teflon as the opposite layer. (f) Stability of the device for 1000 s.
215
Figure 7.13 (a) Voltage output across different load. (b) Power and power density of the cMBIOF-TENG across different load. (c) 0.22 µF and 1 µF capacitor charging using cMBIOF-TENG. (d)
xxvii
Effect of humidity on the output performance of cMBIOF-TENG.
Figure 7.14 (a-b) Stability of the single electrode lateral sliding mode device with Kapton and Teflon as opposite sliding layer. (c-d) FE-SEM image of the coated layer before and after device operation.
218
Figure 7.15 The self-powered hydrogen peroxide sensor. (a) The effect of different hydrogen peroxide concentration on the output of the cMBIOF-TENG. (b) The response of the device with inset showing interference studies. (c) The mechanism of the sensor. (d) The Raman spectra of the Cu-Asp layer and (e) The Raman spectra after adding the hydrogen peroxide on the Cu-Asp layer.
xxviii 추상적 세계 에너지 수요의 증가는 전 세계의 에너지 부족을 야기한다. 에너지 위기는 이 문제를 부분적으로 해결하기 위한 대체에너지 개발에 초점을 맞추게 되었다. 저전력 전자 시장은 수명이 정해져 있는 폐기 및 재활용이 어려운 배터리가 주를 이루고 있다. 이 문제를 피하기 위해 2012 년 기계 에너지 변환을 위한 Triboelectric Nanogenerator(TENG)가 제안되었다. TENG 는 접촉 대전 및 정전기 유도의 결합에 의해 에너지를 생성한다. 서로 다른 특성을 가진 두 물질이 서로 마찰 접촉하여 접촉하는 물질에 반대 전하가 발생하는 경우 접촉 대전 (마찰 전기 효과)이 발생한다. 마찰 전기 효과는 일상 생활에서 자연스럽게 관찰할 수 있다. 마찰 전기 효과는 다양한 산업에서 부정적인 영향으로 간주되었다. 그럼에도 불구하고 마찰 기계 뒤이어 TENG 인 Van de Graaff 발전기의 개발은 마찰 전기 효과의 중요성을 입증했다. TENG 는 저렴하고, 설계하기 쉬우며, 고출력, 고효율, 다양한 재료 및 장치 설계 등의 고유한 장점을 제공한다. TENG 발명 이후, 이식 가능한 전자 기기, 약물 전달, 신경 자극, 물 분해, 화학 센서, 생물학 및 물리적 센서 등을 포함한 광범위한 응용 분야에 활용되었다. TENG 제작에 재료를 선택하기 위한 참고 자료로 마찰전기 시리즈가 검토되고 있다. 마찰전기 시리즈 끝에 있는 재료는 TENG 고성능 설계를 위한 최선의 선택이 될 수 있다. 중합체 및 소수의 금속이 마찰 전기 시리즈 계열에 중요한 부분을 차지하고 있으나 이는 변형이 어려워 많은 용도에 적합하지 않다. TENG 의 안정성, 기능성, 출력 성능 및 적용 가능성은 대부분 활성 물질에 의존한다. 조정할 수 있는 특성을 가진 다기능 재료를 포함하도록 마찰 전기 시리즈를 확장할 필요가 있다.
xxix TENG 적용을 위한 마찰 전기 시리즈의 확장이 가장 중요하다. 이를 위해 본 논문은 TENG 및 자체 구동 동력 센서의 제작을 위한 금속-유기 미세/나노 구조를 조사한다. Metal-organic framework(MOF)는 큰 표면적, 다공성, 크기 조정성, 기능성 등의 예외적 특성을 제공하여 TENG 의 이상적인 후보물질이다. 또한, MOF 는 위상을 변경하지 않고 화학적 변형을 달성할 수 있다. 금속-생체분자는 생체적합성의 장점을 가진 또 다른 부류다. TENG 장치의 세가지 다른 측면, 즉 지속 가능성, 자체 동력 감지 및 생분해성 장치를 다룬다. 이러한 측면은 TENG 기기 설계, 메커니즘 등의 기본 사항을 이해하기 위해 필요하다. 값싸고 설계하기 쉬운 지속가능한 가정용 TENG(H-TENG)은 어떠한 과학적인 도구를 사용하지 않고 가정용 쓰레기를 활용하여 제작되었다. 다양한 플라스틱 포장재, 폴리백은 음극 마찰 전기층의 용도로 사용되는 반면, 사용한 세척 스펀지는 반대 층의 역할을 한다. 쿠킹 호일은 전극으로 활용했고, 폐기된 CFL 에서 나온 구리선이 연결선 역할을 한다. 이 기기는 자체 제작이 가능하며 5 분 이내 제작할 수 있다. 또한 이 장치는 장력 센서, 비상 방향 시스템, 판자 및 침입 모니터링을 나타냈다.
두 번째 측면, 즉 TENG 을 기반으로 하는 자가 동력 센서로서 polyvinylidene fluoride
(PVDF)층을 포함하는 이산화 티타늄(TiO2) 마이크로 입자에 대한 위상 발전 기술을
사용하여 나타냈다. PVDF-TiO2 및 cellulose acetate 가 각각 음성 및 양성 마찰 전기 층으로
사용되었다. 이 장치는 전기 성능에 대해 상세히 특정되어 전압 및 전류의 7 배,10 배 향상을 확인하였다. 마지막으로, 이 장치는 독성 벤젠 증기의 특이적이고 선택적인 감지를 나타냈다. 마찰 전기 센서는 Arduino Uno 와 결합하여 벤젠 증기가 있는 곳에서 경고
xxx 메시지와 경보를 발생시킨다. 생분해성 전원은 이식 가능한 전자장치 및 신경 자극, 세포 조절, 약물 전달 등과 같은 응용 분야에 중추적인 역할을 한다. 또한, 생분해성 기기는 플라스틱 폐기물이 없으므로 지속 가능하다. 단일 전극 모드에서 식용 생분해성 TENG 는 식용 물질 (E-TENG)을 사용하여 제작되었다. 한국의 김(Laver)은 마찰층에 사용되는데, 먹을 수 있는 잎은 TENG 기기의 기판으로서 전극과 라이스 시트의 역할을 한다. MTT 분석, DAPI 염색 및 세포 영상화는 TENG 장치의 생체 적합성을 확인한다. E-TENG 는 PBS 완충제뿐만 아니라 위액에서도 생물학적 영향을 미친다. E-TENG 에서 생산된 출력을 활용하여 다양한 전자장치에 전원을 공급한다. 다음 단계는 마찰 전기 시리즈의 확장을 위한 다기능 재료의 연구를 포함한다. 이것은 제 4 장에 MOF 의 하위인 zeolitic imidazole framework(ZIF)구성들을 풀도록 동기를 제공한다. ZIF 는 MOF 의 다른 장점들과 함께 뛰어난 환경 안정성을 제공한다. 금속을 연결하는 단일 리간드를 갖는 ZIF-7, ZIF-9, ZIF-11 및 ZIF-12 는 ZIF 계열 구성들의 접촉 전기거동에 대해 분석한다. 표면 전위 측정은 Kapton 에 관한 ZIF 계열 구성들의 긍정적인 마찰 전기 거동을 나타낸다. ZIF 제품군은 of VZIF-9-VZIF-11 < VZIF-12 < VZIF-7.의 출력 트렌드를
따른다. ZIF-TENG 장치는 손목시계, 계산기 등에 전원을 공급하기 위해 사용된다. 처음으로 콘덴서를 통한 Kapton 과 ethyl cellulose 컨버스 층으로 상세하게 전기적 특성을 분석하여 TENG 제작을 위한 MOF 를 밝혔다. .
ZIF 구성들의 긍정적인 결과는 5 장에서 리간드가 혼합된 더 많은 ZIF 계열 구성원의 분석으로 이어졌다. ZIF-62 는 금속 이온 Zn+2 가 benzimidazole (bIm) 및 imidazolate (Im)에
xxxi
배위 된 혼합리간드 골격을 갖는 구성품 중 하나이다. ZIF-62 출력 성능은 ZIF-7 과 유사하지만, ZIF-62 장치는 내구성 테스트에서 더 안정적이고 오래 지속된다. The kelvin probe force microscopy (KPFM) 과 표면 전위 연구는 Teflon, polyimide 에 관한 ZIF-62 의 양성 전위 개발을 검증한다. 조립된 장치는 다양한 신체 활동을 관찰하여 생리학적 감지에 최종적으로 사용되었다. 상기 연구에서 ZIF 계열 구성들은 부서지기 쉽고 기판 위에서 성장하기 어려워 기기적용을 제한한다. 유연하고 제자리에서 성장하는 물질이 선택적이고 특정한 자체 구동 센서에 더 적합하다. 이를 위해 ZIF 구성중 하나가 6 장에서 마찰 전기 동작 및 자체 구동 센서서 가장 널리 연구되었다. ZIF-8 은 다양한 기판에서 쉽게 성장할 수 있다는 고유한 장점이 있다. ZIF-8 은 유연한 전도성 기질에서 다양한 사이클로 성장한다. ZIF-8 은 형태학, 표면전위, 표면 거칠기와 같은 표면 형태로 광범위하게 특성화 되었다. ZIF-8 은 다른 제품군에 비해 우수한 출력 성능을 보였으며, 자체 통화 위조 시스템 및 tetracycline sensor 에서 나타났다. 자가 구동식 tetracycline sensor 는 간단한 세척으로 구체적이고 선택적이며 재사용 가능하다. 유연한 금속-생체 분자는 고유한 안정성을 제공하며, 확장이 쉽고 다기능 특성으로 생체에 적합하다고 보고된다. 금속-생체 분자 나노섬유(Cu-Asp)는 생체 적합성, 표면 및 구조적 특성화를 위해 연구된다. 오버헤드 프로젝터 필름, ITO 코팅 PET, 알루미늄 호일, 카프톤 필름 등 다양한 기판에 간단한 바 코팅 방법을 사용해 스케일 업을 보여준다. Cu-Asp 나노 섬유는 전통적인 마찰 전기 시리즈로 배열되었다. 독립형 레이어 모드 MBIOF-TENG 는 장기 안정성과 함께 뛰어난 출력 성능을 보였다. 또한, 이 물질은 접촉 분리 모드
xxxii
TENG (cMBIOF-TENG)에서도 연구되었다. 습도의 영향을 분석하였다. 코팅된 층의 안정성은 단일 전극 측면 슬라이딩 모드 TENG 의 안정성을 제작하고 측정함으로써 나타났다. 마지막으로 감도가 2.3 V/Mm 인 자체 구동 과산화수소 센서가 시연되었다.
xxxiii
Abstract
The rise in global energy demand introduces the energy shortage all over the globe. The energy crisis led to a focus on the development of alternative energy sources to solve the issue partially. The low power electronics market is dominated by the battery, which has a fixed lifetime, challenging to discard and recycle. To circumvent the issue, a triboelectric nanogenerator (TENG) for mechanical energy conversion was proposed in 2012. The TENG generates energy by the conjoining effect of contact electrification and electrostatic induction. The contact electrification (triboelectric effect) occurs when two materials with distinct properties come in frictional contact with each other, resulting in the development of opposite charges on the material in contact. The triboelectric effect is natural to observe in our day to day life as it is ubiquitous. The triboelectric effect was considered as a negative effect in various industries. Still, the development of the Van de Graff generator, friction machine followed by TENG, proved the importance of the triboelectric effect. The TENG offers unique advantages of being cheap, easy to design, high power, high efficiency, a wide choice of materials and device design, etc. Since its invention, TENG was utilized for a wide range of applications, including implantable electronics, drug delivery, nerve stimulation, water splitting, chemical sensors, biological and physical sensors, etc. attributed to its advantages. The triboelectric series is considered as a reference to select the material for the fabrication of the TENG. The materials lie at the far end of the triboelectric series can be the best choice for the designing of high performance TENG. The polymers and few metals are dominating the triboelectric series, which are challenging to modify and thus are not suitable for many applications. The stability, functionality, output performance, and applicability of TENG to a large extent, rely on active materials. The triboelectric series need to be expanded to include the multifunctional materials with tunable properties.
xxxiv
The expansion of the triboelectric series for the application of TENG is of utmost importance. For this purpose, this thesis investigates the metal-organic micro/nanostructures for the fabrication of TENG and self-powered sensors. Metal-organic framework (MOF) is one such class of material that offers exception properties like high surface area, porosity, size tunability, functionality, thus making them an ideal candidate for the TENG. Moreover, MOF can achieve chemical modifications without altering the topology. The metal-biomolecules are another such class that has an advantage of biocompatibility.
Chapter III covers the three different aspects of the TENG devices, i.e., sustainability,
self-powered sensing, and biodegradable devices. These aspects are necessary to understand the basics of TENG device design, mechanism, etc. The cheap, easy to design sustainable household TENG (H-TENG) was fabricated by utilizing the household trash without the use of any scientific instrument. The various plastic packaging’s, poly bags serve the purpose of the negative triboelectric layer while used cleaning sponge act as the opposite layer. The cooking foil was utilized as the electrode, and copper wire from discarded CFL serves as the connection wires. The device takes <5 min for its fabrication and can be built in-house. Furthermore, the device was demonstrated as a force sensor, emergency direction system, chopping board, and intrusion monitoring. The second aspect, i.e., self-powered sensors based on TENG, was demonstrated by using the phase inversion technology for the titanium dioxide (TiO2) microparticles incorporated
polyvinylidene fluoride (PVDF) layer. The PVDF-TiO2 and cellulose acetate were used as negative
and positive triboelectric layers, respectively. The device was characterized in detail for its electrical performance, which confirms the 7- and 10-times enhancement in voltage and current. Finally, the device was demonstrated for the specific and selective sensing of the toxic benzene vapors. The triboelectric sensor was coupled with the Arduino Uno to trigger the warning message
xxxv
and alarm in the presence of benzene vapors. The biodegradable power source is pivotal for implantable electronics and applications like nerve stimulation, cell modulation, drug delivery, etc. Moreover, biodegradable devices are sustainable with the generation of zero plastic waste. The edible, biodegradable TENG in single-electrode mode was fabricated by utilizing edible materials (E-TENG). The Korean ghim (Laver) serves the purpose of the frictional layer; the edible silver leaf was acting as electrode and rice sheet as the substrate in the TENG device. The MTT assay, DAPI staining, and cell imaging confirm the biocompatible behavior of the TENG device. The E-TENG was bioresorbable in gastric juice as well as PBS buffer. The output generated by E-E-TENG was utilized to power up various electronics.
The next step involves the study of the multifunctional materials for the expansion of the triboelectric series. This motivates Chapter IV to unravel the MOF subfamily zeolitic imidazole
framework (ZIF) members. The ZIF offers excellent environmental stability along with the other advantages of the MOF. For the purpose ZIF family members ZIF-7, ZIF-9, ZIF-11, and ZIF-12 with single ligand connecting the metal are explored for their contact electrification behavior. The surface potential measurement divulges the positive triboelectric behavior of ZIF family members concerning Kapton. The ZIF family members follow an output trend of VZIF-9-VZIF-11 < VZIF-12 <
VZIF-7. The ZIF-TENG device was utilized to power up the wristwatch, calculator, etc. via capacitor
The detailed electrical characterization with Kapton and ethyl cellulose as the converse layer for the first time unfold the MOFs for the fabrication of TENG.
The positive results of ZIF members led to the exploration of more ZIF family members with mixed ligand in Chapter V. The ZIF-62 is one such member that has mixed-ligand
xxxvi
ZIF-62 output performance is similar to the ZIF-7, but the ZIF-62 device is more stable and long-lasting in the endurance test. The kelvin probe force microscopy (KPFM) and surface potential studies confirm the development of positive potential on the ZIF-62 concerning Teflon, polyimide. The as-fabricated device was finally utilized for physiological sensing by monitoring the different gym exercises.
The above studies ZIF family members are brittle and difficult to grow directly on the substrate, restricting the device application. The flexible and in-situ grown materials are more suitable for the selective and specific self-powered sensors. For the purpose, one of the most widely studied ZIF family members was explored for its triboelectric behavior and self-powered sensor in Chapter VI. The ZIF-8 offers a unique advantage of easy to grow on various substrates. The
ZIF-8 was grown for different cycles on the flexible conducting substrate. The ZIF-8 was extensively characterized for its surface properties like morphology, surface potential, and surface roughness. The ZIF-8 showed superior output performance compared to other family members, and it is demonstrated for the self-powered currency counterfeit system and tetracycline sensor. The self-powered tetracycline sensor is specific, selective, and reusable by simple washing.
Chapter VII reports metal-biomolecule nanofibers, which are flexible, offer unique
stability, easy to scale-up, biocompatible with multifunctional properties. The metal-biomolecule nanofibers (Cu-Asp) are explored for their biocompatibility, surface, and structural characterization. The scale-up is demonstrated by using a simple bar coating method on various substrates like overhead projector film, ITO coated PET, aluminum foil, and Kapton film. The Cu-Asp nanofibers were arranged in the traditional triboelectric series. The freestanding layer mode MBIOFO-TENG showed excellent output performance with long-term stability. Moreover, the
xxxvii
material was also studied in contact-separation mode TENG (cMOF-TENG). The effect of humidity was analyzed. The stability of the coated layer was demonstrated by fabricating and measuring the stability of the single electrode lateral sliding mode TENG. Finally, a self-powered hydrogen peroxide sensor with a sensitivity of 2.3 V/mM was demonstrated.
1
CHAPTER- I
Introduction
1.1 Background
The population growth has led to a sudden increase in global energy demand resulting in the energy crisis. Natural resources are insufficient to meet the energy requirement because they take hundreds to thousands of years to replenish. Moreover, the consumption of natural resources like coal, petroleum, etc. also suffered from the issue of generating air pollution and global warming. So, it is of utmost importance to explore and develop efficient, clean, and renewable energy sources. On the contrary, the electronics industry is continuously moving towards the miniaturization and portability. The miniaturization also allows reducing the required power consumption for powering up the devices. The present electronic components, sensors, wearable, and implantable device market is dominated by the use of batteries as a power source. The batteries suffer from the issue of a limited life-time and complicated recycling process [1]. In the case of implantable devices, the replacement of battery induces physical and financial burden to the patients. The harness of the energy from the surrounding environment to develop sustainable energy sources is the emerging area. Figure 1.1 illustrated the power requirement of the various commercial off-the-shelf (COTS) components [2]. The typical power requirement is in the range of 100 nW – 10 mW. Therefore, the focus shifts to the development of micro and nano energy harvesting techniques.
2
Figure 1.1. The power requirement of the various COTS components [2].
The nanogenerators (piezoelectric and triboelectric) get tremendous attention as an energy source to power-up the low rating electronics and sensors. The nanogenerators convert the mechanical energy to electrical energy and can utilize the low-frequency motions also [3, 4]. Figure 1.2 summarizes the principle, advantages, and disadvantages of different mechanical energy harvesters [5]. Among the mechanical energy harvesters, TENG offers several unique advantages like easy to design, cost-effective, high output, a wide range of materials and device designs [3, 6-8]. The piezoelectric nanogenerator suffers from the low output and tedious device fabrication process.
3
Figure 1.2. The comparison of various mechanical energy harvester, summarizing the principle,
advantages, and disadvantages of the harvesting approach. Open Access [5]. 1.2 Fundamentals of TENG
The triboelectric effect or contact electrification dates back to thousands of years and exists from ancient Greece. The tribo means rubbing, and electricity is from the Greek word for amber. The triboelectric effect is ubiquitous and can be easily observed in our daily life. Triboelectrification occurs when two materials with opposite surface charges come in contact with each other. In many industries, the effect was considered as unfavorable due to the damages like ignition, electronic damage and dust explosion, etc. caused by the generated electrostatic charges. However, the triboelectric effect leads to the development of initial generators like the Wimshurst machine (1880) and Van de Graaff generator (1929), as shown in Figure 1.3a [7, 9, 10]. A simple Van de Graaff generator consists of any dielectric material belt (rubber) running on the two rollers of distinct materials, one of the rollers is surrounded by the hollow metal sphere [9, 11]. Two brush
4
or comb-shaped electrodes are placed near the lower and over the upper roller inside the sphere. Van de Graaff generator demonstrated by himself in the MIT museum is shown in Figure 1.3b [9].
Figure 1.3. (a) Wimshurst machine and Van de Graaff generator. Reproduced with permission [7].
Copyright American Chemical Society. (b) The demonstration of van de Graaff generator at MIT museum. Reproduced with permission [9]. Copyright IEEE.
Recently, in 2012, Wang et al. invented a triboelectric nanogenerator (TENG) [3]. The TENG can effectively harness mechanical energy with advantages like cost-effective, wide material choice, lightweight, high efficiency, flexible, portable, etc. TENG works on the coupling effect of contact electrification and electrostatic induction [3]. In general, when two distinct material comes in frictional contact with each other, the charge transfer occurs depending on the relative position of the materials in contact. The electrostatic induction allows the development of opposite charges on the electrodes, thus creating a potential difference when two layers are separating or sliding or comes in contact. The process allows the flow of electrons, thus generating the output of the device [3, 6, 7, 12].
5
1.3 Theoretical origin of TENG
The first TENG device developed in 2012, comprised of Kapton and PET (polyester) films backed by the electrodes as active layers [3]. The device was operated in contact-separation (C-S) mode based on the coupling of contact electrification and electrostatic induction, as shown in Figure 1.4a. The origin of the mechanism in 2017 was traced back to Maxwell's displacement current [5, 10], which is defined as
𝐽
𝐷=
𝜕𝐷 𝜕𝑡= ∈
𝜕𝐸 𝜕𝑡+
𝜕𝑃𝑆 𝜕𝑡 (1)Where ∈ is the permittivity of the medium, D is the displacement field, E is the electric field, and Ps is the contribution of surface polarization charges.
The first term in the equation was the origin of the electromagnetic waves. The second term is for the origin of the nanogenerators (piezoelectric and triboelectric), and it signifies the surface polarization contribution. In the primary C-S mode, when two layers come in contact, it gets oppositely charged. The surface charge density (± σtribo) is independent of the gap (z) between the
layers but ± σtr, i.e., the amount of charge collected on the electrodes depends on the z. The
mechanical energy brings the device in periodic contact and separation, thus induces changes in the z, converting it into the electricity. The displacement current, in this case, can be calculated by equation 2.
𝐽
𝐷=
𝜕𝐷𝑧 𝜕𝑡=
𝜕𝜎𝑡𝑟 (𝑧,𝑡)
6
The oppositely charged layers can be considered as a capacitor of varying capacitance due to the changing gap. The equivalent capacitor model is shown in Figure 1.4b, the current of which can be given by
𝐼 =
𝑑𝑄𝑑𝑡
= 𝐴
𝑑𝜎𝑡𝑟𝑑𝑡 (3)
This equation confirms the foundation of the model to Maxwell's displacement current as it is equivalent to equation 2. The voltage of the TENG can be given by
𝑉 = −
1𝐶(𝑧)
𝑋 𝑄 + 𝑉
𝑜𝑐(𝑧)
(4)However, recently the output behavior of TENG was simulated more accurately by using Norton's theorem and distance-dependent electric field [13, 14].
Figure 1.4. (a) The C-S mode TENG for displacement current model. (b) The TENG
representation using the capacitor model. Reproduced with permission [10]. Copyright John Wiley & Sons.
7
1.4 Working modes of TENG
The TENG can operate in four different working modes depending on the electrode configuration and the change in the direction of polarization. The four different working modes of TENG are vertical contact-separation (C-S) mode, single electrode (SE) mode, lateral sliding (LS) mode, and freestanding triboelectric layer (FT) mode as explained below.
1.4.1 Vertical contact-separation (C-S) mode
The vertical c-s mode shown in Figure 1.5a is one of the most straightforward TENG device configurations. When two distinct materials backed by electrode comes in frictional contact with each other, they developed opposite charges depending on their polarity. In the absence of external force, the two layers start to separate, thus creating a potential drop. The free electrons from one electrode flow to the opposite electrode via load to balance the potential difference, thus generating a one-half cycle of the AC output. After applying the force, the top frictional layer starts approaching the bottom layer, thus generating the reverse flow of electrons to complete the one cycle of the AC output. The C-S mode can work in the dielectric to dielectric contact and conductor to dielectric contact mode. In dielectric to dielectric type, the two dielectric layers backed by metal electrode are stacked face to face, separated with the help of a spacer. In conductor to the dielectric, only one dielectric layer is backed by a metal electrode, while the opposite layer is metal, which plays the dual role of electrode and contact layer. The C-S mode devices are reported in various designs like arc-shaped, spring-assisted, zig-zag shaped, etc. The vertical C-S mode offers the advantage of easy design, robustness, stability, and high output [3, 8, 12, 15-18].
8
1.4.2 Lateral sliding (LS) mode
The lateral sliding mode generates electricity by relative sliding of the top layer over the bottom layer, as shown in Figure 1.5b. The top and bottom layers are positive and negative in the triboelectric series, respectively. Initially, the two frictional layers are in full contact with each other, thus have equal and opposite charge density. When the top layer slides outward relative to the bottom layer, the decrease in contact area creates the charge separation. The generated potential difference leads to the flow of electrons from the bottom electrode to the top electrode until the top layer slides out completely. The motion in reverse direction generates the reverse flow of electrons until the electrostatic equilibrium achieved, thus producing the second half cycle of the output. The LS mode can be used in cylindrical rotation, disc rotation, or planar motion. The LS mode suffers from the issue of wear and tear [6, 19, 20].
1.4.3 Single electrode (SE) mode
The vertical C-S mode and lateral sliding mode use two electrodes, which may restrict the device applications. The single-electrode style can work freely as the opposite contact layer is free to move without any connection, as shown in Figure 1.5c. The single-electrode mode can be designed by using a ground electrode and the movable contrasting layer. The periodic contact-separation of the movable layer generates the potential difference leading to the flow of electrons between the electrode and the ground. The single-electrode mode can work in both lateral sliding and C-S configuration. The SE mode offers the advantage of straightforward design and one free layer, but the issue is of connection to the ground [21-24].
9
Figure 1.5. Working modes of TENG (a) Vertical contact-separation mode. (b) Lateral sliding
mode. (c) Single electrode mode and (d) Freestanding triboelectric layer mode [18].
1.4.4 Freestanding triboelectric-layer (FT) mode
The freestanding TENG (FTENG) mode can be easy to apply as the moving layer need not be attached to the electrode and wires. The FTENG has much higher efficiency compared to the single-electrode mode and can also work in non-contact mode. In freestanding mode, two symmetric electrodes are placed at a small gap underneath the dielectric layer with a little distance. The size of the dielectric layer and electrodes are of the same order. Considering the movable layer is pre-charged by the triboelectrification process, the movement of the layer concerning the electrodes generates asymmetric charge distribution, leading to the flow of electrons from one electrode to the other to balance the developed potential (Figure 1.5d). The movement of electrons
10
between the electrode creates the AC output. The FT mode provides the advantage of a free moving layer, high output but has a complex structure [25-27].
1.5 Figure of merits
The TENG can operate in four different working modes with a wide range of material availability. The figure of merits (FOM) was proposed in 2015 by Zi et al. to create a common standard for the comparison of different TENGs [28]. The figure of merits and factors affecting the TENG output are summarized in Figure 1.6, where the performance figure of merit (FOMP)
for TENG comprises of a material FOM (FOMM) and structural FOM (FOMS). The FOMP can be
considered as a standard to evaluate the performance of the TENG. The relationship of FOMS for
different working mode is contact freestanding triboelectric (CFT) > CS > sliding FT (SFT) > LS > SE contact mode (SEC) [28]. The only material related parameter is surface charge density (σ). The dimensionless FOMS is given as
𝐹𝑂𝑀
𝑠=
2∈0 𝜎2𝐴𝐸𝑚
𝑥𝑚𝑎𝑥 (5)
Where A is the area of triboelectrification in TENG and
∈
0 is the permittivity of the vacuum. The material properties and device size are not considered in the FOMS. The FOMP is given by
𝐹𝑂𝑀
𝑝= 𝐹𝑂𝑀
𝑠. 𝜎
2(6)
The σ2 is the FOMM. To quantify the triboelectric performance of a material, a dimensionless
material FOM (FOMDM) was also proposed. For the purpose, the charge density of the material
11
𝐹𝑂𝑀
𝐷𝑀= ( 𝜎
𝑁)
2=
𝜎𝑚𝑎𝑡𝑒𝑟𝑖𝑎𝑙 𝑙𝑖𝑞𝑢𝑖𝑑 𝑚𝑒𝑡𝑎𝑙 ⁄ 2 𝜎𝐹𝐸𝑃 𝑙𝑖𝑞𝑢𝑖𝑑 𝑚𝑒𝑡𝑎𝑙 ⁄ 2 (7)Where FEP is the reference material. The negative
𝜎
𝑁 signifies that the material is more tribo positive considering the liquid metal and𝜎
𝑁>1 denotes that the material is more negativecompared to FEP [10, 28]. The in-between value stands for more positive than FEP and more negative than liquid metal. The development of FOM can be treated as standards for the TENG performance, which can also act as a foundation for the industrialization of TENG based systems.
12
1.6 Materials for TENG