This article has been accepted for publication and undergone full peer review but has not been through the copyediting, typesetting, pagination and proofreading process, which may lead to differences between this version and the Version of Record. Please cite this article as doi: 10.1002/adpr.202000088.
Coherence-tailored Multi-wavelength High-speed Quantitative Phase Imaging with a High Phase Stability via a Frequency Comb
Jeeranan Boonruangkan†, Hamid Farrokh†, Thazhe Madam Rohith, Hui Ting Toh, Abhinay Mishra, Ho Sup Yoon, Samuel Kwok, Tom Carney, Seung Woo Kim and Young-Jin Kim*
Dr. J. Boonruangkan, Dr. H. Farrokhi, T. M. Rohith, Dr. A. Mishra, Prof. Y.-J. Kim
School of Mechanical and Aerospace Engineering, Nanyang Technological University (NTU), 50 Nanyang Avenue, 639798 Singapore
E-mail: [email protected] †
These authors contributed equally to this work H. T. Toh, Prof. H. S. Yoon
School of Biological Sciences, Nanyang Technological University (NTU), 60 Nanyang Drive, 637551 Singapore
S. Kwok, Prof. T. Carney
Lee Kong Chian, School of Medicine, Nanyang Technological University (NTU), 59 Nanyang Drive, 636921 Singapore
Prof. T. Carney
Institute of Molecular and Cell Biology (IMCB), A*STAR (Agency for Science, Technology and Research), 61 Biopolis Drive, 138673 Singapore
Prof. S.-W. Kim and Prof. Y.-J. Kim
Department of Mechanical Engineering, Korea Advanced Institute of Science and Technology (KAIST), Science Town, Daejeon, 34141 South Korea
Dr. A. Mishra
Present address: BioSystems and Micromechanics (BioSyM), Singapore MIT Alliance for Research and Technology (SMART), 1 Create Way, 138602 Singapore
Keywords: Coherence control, quantitative phase imaging, Frequency comb, life science.
Coherent imaging enables non-invasive, label-free, and quantitative monitoring of the dynamic motions of transparent micro-objects requested in life sciences, biochemistry, material sciences, and fluid mechanics. Quantitative phase imaging (QPI), a coherent imaging technique, provides full-field optical phase information through light interference. The use of coherence, however, inevitably accompanies phase ambiguity and coherent artifacts, such as speckle, diffraction, and parasitic interference, which severely deteriorate the interferograms so hinder successful phase
reconstruction. In this Article, we demonstrate that a frequency comb can newly provide a wide coherence tunability for higher visibility interferograms, phase-coherent multiple wavelengths for extracting physical height information from refractive index, and higher phase stability (2.39×10⁻³ at 10-s averaging time) at a higher speed up to 16.9 kHz. These superior characteristics of frequency-comb-referenced QPI will enable in-depth understanding of dynamic motions in cellular, bio-molecular, and micro-physical samples.
1. Introduction
Quantitative phase imaging (QPI) is a non-invasive, label-free, interferometric optical imaging technique which provides full-field distribution of optical phase delay referenced to the light wavelength. Because the definition of the ‘metre’ – the international unit of length – is based on the wavelength of light, QPI enables us to attain a sub-wavelength measurement precision (not resolution only) in phase-sensitive imaging, which could not have been realized in traditional phase-sensitive microscopes, such as phase contrast microscopy and differential interference contrast microscopy, which only support higher contrast analysis but not the precision [1, 2]. Due to its non-invasive, label-free, and quantitative nature, QPI has been widely applied to precision measurement of cellular morphology, refractive index (RI), and dry mass [3-6]; monitoring of inter-cellular communication of immune cells, neurons, and cancer cells [7-10]; and understanding the dynamics of red and white blood cells [11-14].
Most QPI modalities reconstruct phase tomograms using a series of interferograms. High quality interferograms are, therefore, the prerequisite for QPI. High-brightness and high-coherence continuous-wave (CW) lasers have been utilized in QPI for efficient light-specimen interaction and phase-sensitive interferometric imaging [15, 16]. However, the high coherence inevitably superimposes unexpected coherent noise (e.g., speckle, diffraction, and parasitic interferogram) to the target interferograms, which significantly hampers sensitive phase detection and successful phase reconstruction [17, 18]. The coherent noise gets even more severe when imaging through the
scattering media, e.g., biological tissues, plasmonic nanoparticles, and non-ideal optics with surface roughness or contamination. Various light sources have been introduced to QPI so as to suppress the coherent noise and provide more dedicated biomedical information at a higher detection speed [19-25]. A single light source, however, could not satisfy all QPI’s requirements, including (1) high-temporal coherence for high-contrast interferogram, (2) high-spatial coherence for large field-of-view, (3) low speckle for lower background noise, (4) multiple wavelengths for relating the physical volume to the ratio of refractive indices, and (5) high phase stability over a wide time span. Because different applications require different coherence levels, an ideal light source for QPI should provide wide tunability in spatio-temporal coherence with lower background noise. Frequency-comb-referenced quantitative phase imaging (FCR-QPI) which offers the spatio-temporal coherence tunability can be used as a multipurpose instrument. In addition, phase-coherent multiple wavelengths could enable spectroscopic QPI for extracting the physical volume from RI [26-28]. Because optical phase difference (ϕ) is measured with reference to the wavelength of light () in QPI, high-level stabilization of the laser wavelength is essential for higher phase stability. Higher phase stabilities at wide time scales could improve the QPI resolution at higher update rates. For these purposes, a frequency comb can be considered as a novel and promising QPI light source.
A frequency comb provides millions of well-defined optical modes over a broad spectral bandwidth with a high phase coherence referenced to a time standard [29, 30]. The use of such a frequency comb has led to remarkable advances in high-resolution spectroscopy, the broadband calibration of astronomical spectrographs, time/frequency transfer over long distances, absolute laser ranging, precision surface metrology, and the inter-comparison of atomic clocks [31-37]. A frequency comb can be realized with a mode-locked femtosecond pulse laser, which emits a repetitive pulse train with a few hundreds of fs pulse duration, corresponding to tens of micrometres (µm) in length; this time-domain nature can make it work as a low-coherence white-light source. In
the frequency-domain, a frequency comb can be regarded as a combination of highly coherent well-stabilized millions of multi-wavelength CW lasers [38, 39]. Therefore, a frequency comb interestingly contains two competing characteristics of the precedent QPI light sources, a low-coherence white-light source, and high-low-coherence CW lasers. If we carefully tailor the superior characteristics of a frequency comb, it can work as a promising tunable QPI light source; however, no demonstration has been provided to date.
In this study, we report that a frequency comb provides (1) a wide coherence tunability for better quality interferograms, (2) phase-coherent multiple wavelengths for relating the physical volume to the RI ratio, and (3) high phase stability for higher-resolution and higher-speed QPI. The temporal coherence, the spatial coherence, and coherence speckle level were actively tailored from 8.1 to 56.3 µm in coherence length, from 0.63 to 0.98 in visibility, and from 0.29 to 0.91 in speckle contrast, respectively, so as to form best quality QPI interferograms in diverse biomedical applications. This enables us to monitor cellular swelling and protein degradation during cellular death in real time. High phase stability enables a higher resolution QPI even at high speed; as an example, high-speed dynamic motion in zebrafish’s blood vessel was monitored up to 54.6 Hz; even higher update rates up to 16.9 kHz was demonstrated with rotating micro-spheres.
2. Results
2.1. Frequency-comb-referenced Quantitative Phase Imaging: System Layout
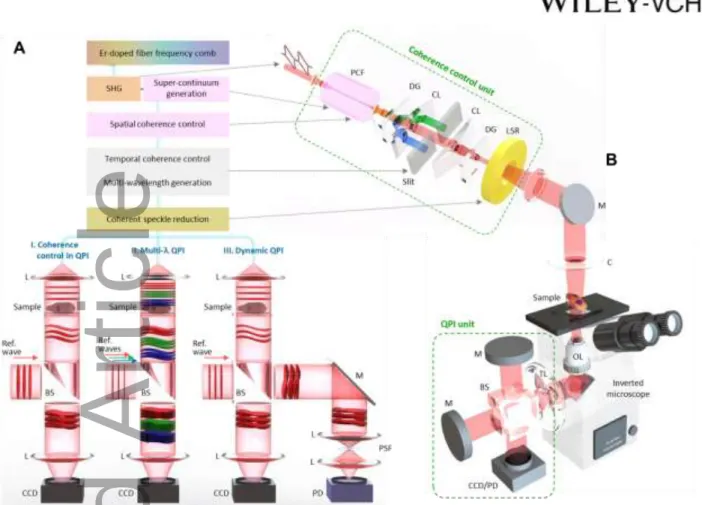
Figure 1 illustrates the system configuration for frequency-comb-referenced quantitative phase imaging (FCR-QPI). A mode-locked Erbium-doped fibre frequency comb emits an ultra-short pulse train with a repetition rate of 250 MHz centered at a fundamental wavelength of 1,550 nm. This near-infrared wavelength beam is converted to 780 nm at second harmonic generation (SHG) unit and is coupled to a photonic crystal fibre (PCF) leading to a broad supercontinuum generation over 620 to 980 nm, which covers the spectrally sensitive range of the silicon camera. The resulting beam is delivered to a coherence control unit, a multi-wavelength generation unit, an inverted
microscope, and finally to a Michelson-type QPI unit and utilized for studying how a frequency comb can contribute to (1) wide spatio-temporal coherence control in QPI, (2) multi-wavelength QPI, and (3) dynamic QPI (Figure 1, A and B). (1) For the coherence control, the temporal coherence is firstly tuned by a band-pass-filter (BPF) with various spectral bandwidths and the spatial coherence is secondly tuned by a micro-optic diffuser as a laser speckle reducer (LSR) with different diffusion angles (Figure 1A-I). This aims to reveal how one can optimize the spatio-temporal coherence of the frequency comb for best results in QPI. (2) Different wavelength sections of a frequency comb are selected out for multi-wavelength QPI and used to study the alternations in cellular morphology and intracellular refractive indices (Figure 1A-II). (3) To monitor fast dynamic phase changes in optical and biological samples, the combination of a high-speed photodetector and a programmable spatial filter is newly introduced. One can select a point-of-interest out of a 2D QPI image captured by a slow CCD, extract that point-of-interest’s QPI signal through a programmable spatial filter, and detect the signal with a high-speed up to several MHz. (Figure 1A-III).
Figure 1. Frequency-comb-referenced quantitative phase imaging (FCR-QPI). (A) FCR-QPI for (I) coherence control in QPI, (II) multi-wavelength QPI, and (III) dynamic QPI. (B) Experimental configuration. An Er-doped fibre frequency comb is wavelength-down-converted to near-infrared range by second-harmonic-generation and spectrally broadened at PCF, resulting in low temporal and high spatial coherence. For temporal coherence control, the combination of a diffraction grating and a slit was used for tunable band-pass-filtering with different centre wavelength and spectral bandwidth. For spatial coherence control, the laser speckle reducer (LSR) with different diffusion angle (DA) was installed in the beam path. The spatio-temporal coherence-controlled beam was then delivered to the sample on an inverted microscope and the resulting sample phase information was analyzed at a QPI unit with a CCD and a high-speed PD. CL: cylindrical lens, DG: diffraction grating, M: mirror, C: collimator, OL: objective lens, TL: tube lens, L: lens, BS: beam splitter, SF: programmable spatial filter, CCD: charge-couple device, PD: photodetector.
2.2. Spatio-temporal Coherence Control
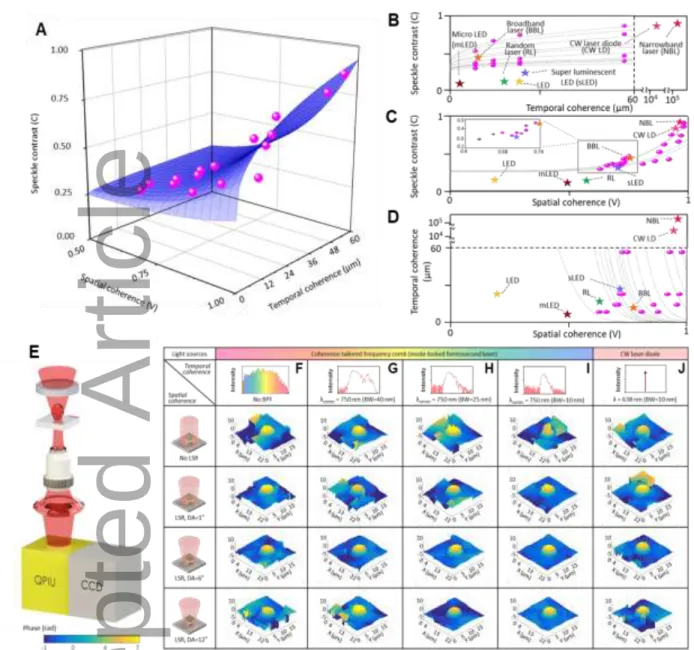
Figure 2A shows a 3D spatio-temporal coherence cloud with three axes – the spatial coherence (V), temporal coherence (Lc), and speckle contrast (C) – realized by our coherence control (Materials
and Methods). Spatial and temporal coherences need to be carefully tailored considering the target samples for satisfying the 3D phase profile reconstruction of the micro-samples inside multiple scatters over a wide field-of-view. Therefore, a wide spatio-temporal coherence tunability is highly required for various imaging applications, but it could not have been fulfilled with a single light
source; we introduced a frequency comb and spatio-temporal coherence control as shown in Figure 2A to tackle this issue. For the performance comparison, state-of-the-art light sources are displayed together with our coherence-controlled frequency comb in Figure 2 (B, C, and D) based on their spatio-temporal coherences. CW lasers exhibit high spatial and temporal coherences, which, however, also leads to severe speckles. Super luminescent LEDs (sLEDs) (662 nm, EXALOS) [18], super luminescent laser diodes (SLDs) [20] and random lasers [21] exhibit high spatial coherence and moderate speckle contrast (C 0.5), which is still not low enough for highly sensitive phase imaging. LEDs (632 nm, Plessey) and micro-LEDs (mLEDs) (477 nm, Plessey) provide lower spatial coherence with moderate speckle noise; however, their temporal coherence is still not high enough for constructing high-visibility interferograms [22]. These precedent light sources occupy specific spots in the 3D coherence cloud, and each owns its strength for a specific imaging application. Instead, a single frequency comb could cover a wider 3D space of the coherence cloud as shown by the purple dots in Figure 2 (A to D); the tunable ranges for temporal coherence is from 8.1 to 56.3 m, spatial coherence is from 0.63 to 0.98 V, and the speckle contrast is from 0.29 to 0.91 C. By simply tuning the spatio-temporal coherence and speckle contrast levels of a frequency comb, one can attain the best quality interferograms for their specific applications. Traditional white-light microscopies can partially support active tuning of the spatial coherence with the aids of pinholes and spatial filters; however, they suffer from significant power attenuation therein because the spatial filter’s aperture size (ranging from tens to hundreds of µm) is much smaller than the beam size. Furthermore, white-light sources cannot provide either wavelength stability, high temporal coherence, or wavelength traceability, which are readily available with the frequency comb.
Accepted Article
Figure 2. Coherence control and speckle suppression in FCR-QPI. (A) 3D coherence cloud of the frequency comb (FC) with three axes: the temporal coherence (Lc), spatial coherence (V), and
speckle contrast (C). For comparison, state-of-the-art light sources are displayed together at three cross-sectional views: (B) Speckle contrast vs. temporal coherence, (C) Speckle contrast vs. spatial coherence, (D) Temporal coherence vs. spatial coherence. (E) QPI with coherence-controlled FC. (F, G, H, and I) Raw QPI interferograms and topographic phase maps of microbeads illuminated by a coherence-controlled FC and (J) with a CW LD.
The coherence tunability is characterized by analyzing the topographic QPI phase maps of the same transparent polystyrene microbead at various spatio-temporal coherences (Figure 2E and Materials and Methods). To mimic the scatterers (i.e., cells in solutions), a semi-transparent scattering film (polycarbonate film, ρ = 1.2 g/cm3) is installed before the sample. The temporal coherence, Lc is tuned from 8.1 μm (No BPF) to 56.3 μm (BPF, BW = 10 nm), while the spatial
coherence, V is tuned from 0.98 (BPF, BW = 10 nm, No LSR) to 0.63 (No BPF, LSR, DA = 12)
(Materials and Methods and Figure S2); Figure 2 (F to I) show the resulting interferograms and reconstructed phase maps. These results are compared with the ones acquired with a CW LD having a long Lc of ~20 mm. The full field-of-view interferogram coverage is linked to both temporal and
spatial coherences. The band-pass filters were used to extend the temporal coherence, without any spatial coherence control, which implies that the temporal coherence helps to extend the interferogram’s spatial coverage. In addition, the inter-relation between temporal and spatial coherences enable the suppression of the coherent speckle noise, hence eliminates the phase errors so as to support the successful phase map reconstruction. Therefore, firstly, without temporal coherence control, the low temporal coherence of a frequency comb makes the interferogram not successfully cover the full field-of-view as shown in Figure 2 (F, G, and H); therefore, the phase information on the side sections are significantly distorted. Secondly, without spatial coherence control, the coherent speckle noise causes background phase distortions and unwrapping errors [40], so the phase reconstruction fails in the unwrapping process; thus, the non-natural phase discontinuity is observed in the first two rows of Figure 2 (F to I). With a CW LD, coherent speckle is even more severe so the phase profile cannot be reconstructed even with the spatial coherence control (Figure 2J). The best coherence regime for this case study is at Lc of 56.3 μm and V of 0.73.
The higher Lc generally promotes higher visibility interferograms but also induces higher speckle
level. Meanwhile, in our FCR-QPI, the speckle is well suppressed without significant degradation of the temporal coherence. Even under the scattering medium, the physical information is well determined in this best coherence regime. The height of the microbead is 9.9 µm (RImicrobead=1.579;
RI immersion oil=1.493 at λ=750 nm), which matches well to the specification with a 1.0% error. The
coherent speckles in the interferograms when illuminated by the FC and CW LD are analyzed in time and frequency-domains (Figure S4). The effect of laser speckle reducer on speckle noise suppression was characterized in time- and radio-frequency (RF) domains (Figure S5). Spatial coherence has two components: (a) high-amplitude low-frequency spatial components which is
mainly responsible to cover a larger lateral area and for successful phase reconstruction over a larger FOV. This component can be controlled by the illumination NA, broadband lasers or etc. [17, 40]; and (b) low-amplitude high-frequency spatial components which is located on top center of the low-frequency components. This component is commonly called as ‘coherent speckle noises’ which could hinder the successful phase reconstruction. Therefore, in this study, we attempt to reduce this component of spatial coherence using a LSR to benefit successful phase reconstruction in the QPI. In summary, our FCR-QPI can tailor the coherences so as to form the best quality interferograms over a large field-of-view for successful phase reconstruction even under highly scattering medium to serve a wide range of imaging applications.
2.3. Multi-wavelength Quantitative Phase Imaging
FCR multiple wavelengths are employed to QPI for quantitative monitoring of the changes in cellular morphology, cellular volume, and intracellular RI. QPI basically measures the optical phase – the product of the cellular height and cellular RI – which cannot be easily divided back into the height and RI. Multiple CW lasers have been introduced to QPI to split these using the wavelength-dependent optical RI [41]; therefore, they have suffered from coherent speckle. Here, we extracted three wavelength sub-sections out from a frequency comb at 700, 750, and 800 nm and illuminated those to MCF-7 human breast cancer cells (Figure 3A and Materials and Methods); we successfully suppressed the coherent speckle by our spatio-temporal coherent control scheme. The optical phase delay (OPD (unit: radian)) at each wavelength can be described by (x,y;) = (2/)n()h(x,y), where n is the RI difference between the cell and culture media, and h is the cellular physical height. Time-lapse interferograms and reconstructed topographic phase maps at three wavelengths are shown in Figure 3 (B, C, and D), which show the slow changes in cellular morphology and OPD. At an early stage, the cell exhibits a polygonal shape, which later starts to swell after one hour of the observation. This swelling is observed at the early stage of oncosis, accidental cellular death [41, 42]; the damaged cells fail to maintain the ion concentration, so the extracellular fluids enter the cell, which causes the cellular volume increase (Materials and Methods). In this experiment, the
cell was left in a non-cooperative environment without the intentional control (e.g., 5% CO2 or 37 °C), which causes a gradual cellular death. In the topographic phase maps, the OPD at a position ‘S’ in Figure 3D increases from 2.75 to 3.06 rad over 5 hours at 800 nm (Figure 3, D-1 to D-4). After the swelling, the cell membrane starts to break down and releases the intracellular contents, which results in the OPD decrease to 1.40 rad at 800 nm (Figure 3D-5). These alterations of the cellular morphology and OPD show a good agreement with the results by K. Creath et al. [43]. Without the spatio-temporal coherence control, the topographic cellular phase map could not be reconstructed due to high coherent noise which resulted in severe phase discontinuity (indicating by the red arrow) as shown in Figure 3 (E-1 to E-5). Furthermore, the standard deviation (SD) of the representative background area were calculated to show the lower background noise obtained with coherence control (Figure 3, D-1 to D-5 and E-1 to E-5). The cellular dry mass and volume are strongly related with early diagnosis of cancer cells; thus, the cellular height needs to be determined from the optical phase. The best way is to use dispersion curves – the wavelength-dependent OPD – but one cannot have the dispersion curves of all target cells. Therefore, we calculated the ratio between two RIs measured at different wavelengths (700 and 800 nm) instead so as to extract the cytoplasm’s distribution information (Materials and Methods). Time-lapse RI ratio maps are shown along with cellular phase maps in Figure 3 (G and F). The RI ratio inside the MCF-7 cell ranges from 0.92 to 1, which is higher than the RI ratio of the surrounding medium, 0.8~0.9. Because the cellular RI represents the cellular organelles or biochemical components (i.e., protein) [44], this decrease of the RI ratio can be explained by cellular organelles’ disruption leading to the cellular death, which is also confirmed by the cellular morphology change. The RI ratio (strongly relevant with dispersion) has been used as a biological marker to distinguish cytoplasm and chromosomes during the cellular division [51]. For more quantitative analysis, the optical volume and integrated RI ratio were calculated by integrating the optical path difference (unit: µm3) and RI ratio over the cell. Figure 3H shows that the integrated cellular RI ratio decreases drastically at early 20 minutes,
whereas the optical volume increases in the meantime; the optical volume increase is made by the cellular swelling; the RI ratio decrease is due to the intracellular protein dilution and damages in cellular organelles. After the initial RI ratio decrease, the RI ratio continues to decrease by 77.3 % over 9 hours. These results show that the RI ratio can be used as a biomarker to monitor cellular degradation without prior knowledge of cellular RIs or dispersion curves. Compared to multi-wavelength QPI incorporating multiple CW lasers, a frequency comb provides phase-coherent multiple wavelengths from a single light source with speckle suppression, which also makes the long-term measurement performance of QPI more stable, which will be discussed in the last section.
Figure 3. Phase-coherent multi-wavelength QPI for monitoring intracellular degradation. (A) Experimental configuration. Time-series of interferograms and the reconstructed topographic phase maps of a MCF-7 breast cancer cell illuminated by three wavelengths of the frequency comb with LSR; the data from (B) 700 nm, (C) 750 nm, and (D) 800 nm. (E) the data from 800 nm without LSR. Dynamic changes in cellular morphology and optical phase delay were measured over 9 hours. (F) Time series of phase maps of the cell at 750 nm, and (G) RI ratio between RIs at two wavelengths (700 nm and 800 nm). (H) Integrated optical path difference (optical volume) and RI ratio of cell over time.
2.4. High-speed Quantitative Phase Imaging of Fast Dynamic Motions
Fast dynamic motions of optical and biological samples – an optical fibre, microspheres, and zebrafish’s blood cells – are measured up to 16.9 kHz (59 µs update rate) in a quantitative manner with FCR-QPI. Most QPI have utilized CCDs as the imaging sensor for capturing 2D interferograms. Here, we introduced a programmable spatial filter and a high-speed photodetector
Figure 4A shows the experimental configuration for measuring a high-speed periodic motion of an optical fibre; the same system is also used for subsequent measurements of microspheres, and a zebrafish. The sample, a single-mode optical fibre, has a higher RI core (RIcore=1.452; D
mode-field-diameter=8.2 µm) and a lower RI cladding (RIcladding=1.447; Dcladding=125 µm). When a PZT
modulates the lateral position of the fibre by ~10 µm in a background medium (RIbackground=1.443),
the OPD variates at the modulation frequency, as shown in Figure 4A-I. When the point-of-interest is shifted by the programmable spatial filter (SF), the different RIs of the core, cladding, and background medium make different phase modulation amplitudes as shown in Figure 4A-I; the phase amplitudes match well with the theoretical RI values within a 6.4% error. At the core position, the modulation frequency was doubled with a lower modulation amplitude, because the PZT modulation depth is larger than the fibre’s core diameter. To demonstrate the high-speed measurement capability, PZT’s modulation was frequency-tuned up to 4.0 kHz. Figure 4AII-1 shows the measured phase modulation amplitudes at different frequencies, which clearly demonstrates the typical resonance spectrum of a PZT; the first resonance peak of PZT is located at 0.37 kHz. Figure 4A (II-2 and II-3) show the 200-Hz phase modulation in time- and frequency-domains. Harmonic components are observed at the integer multiples of 200 Hz, which is because of the power leakages to harmonics. The highest phase-modulation frequency is set to 4.0 kHz due to the PZT’s mechanical resonance; the Fourier-transformed frequency-domain spectrum shows higher harmonics up to 12 kHz (Figure 4A, II-4 and II-5). Even higher frequency motions of micro-spheres up to 16.9 kHz are then measured as shown in Figure 4B. 10-m micro-micro-spheres are bonded onto the top surface of a dielectric elastomer actuator (DEA) having four electrodes around the circumference. When a 300 Hz periodic electric field is applied to the DEA in a clockwise direction, the micro-spheres circulate around the DEA’s centre. Because there are many micro-spheres on the DEA, the phase modulation peaks are located at integer multiples of 300 Hz (Figure 4B-I). Therefore, many high order harmonics are observed in Figure 4B-II, up to 16.9 kHz.
Figure 4. FCR-QPI for monitoring high-speed dynamic motions. (A) Experimental configuration. Sinusoidal modulation by PZT results in the lateral movement of the optical fibre. Phase modulation measured at different centre positions: when laser beam is on (I-1) cladding (left), (I-2) cladding-core boundary (left), (I-3) core, (I-4) cladding-core boundary (right), and (I-5) cladding (right). (II-1) Dynamic phase motion of an optical fibre (from 1 Hz to 4,000 Hz). Time- and frequency-domain analysis at 200 Hz and 4 kHz: (II-2) 200-Hz time-domain, (II-3) 200-Hz frequency-domain, (II-4) 4-kHz time-domain, and (II-5) 4-kHz frequency-domain. (B) Dynamic phase motions of rotating micro-spheres: (I) time-domain signal, and (II) frequency-domain signal. (C) Dynamic phase motions in zebrafish’s blood vessel. Bright-field image of zebrafish at 24 hpf and the schematic of RBC flow at 24 and 48 hpf. (I) RBC flow in the vessel at 24 hpf. (II) A phase profile of a single RBC: (III) pulsatile flow in the blood vessel at 48 hpf and (IV) individual RBC-induced phase modulations within a single heartbeat. (D) Allan deviation of phase instability of frequency comb (FC), femtosecond laser (FS), and CW laser diode (LD).
As the final demonstration, we measured the dynamic flow of red blood cells (RBCs) in a live embryonic zebrafish (Danio rerio). Zebrafish have been used as a model for understanding the human cardiovascular system due to their high optical transparency and rapid organ development. Moreover, ~84% of human genes associated with the disease are found in zebrafishes [45]. Figure 4C shows a bright-field image of the zebrafish at 24 hours-post-fertilization (hpf) and RBC flow in the dorsal aorta. At an early stage of 24 hpf, RBCs flow individually inside the vessel; then, at 48
of RBCs and the speed of RBC flow [46]. To understand this development in detail, the size, volume, number, and velocity of RBCs need to be monitored in real time. For this purpose, we illuminated the frequency comb to the dorsal aorta of a live zebrafish as shown in Figure 4C. Figure 4C-I shows the phase changes made by RBCs passing through our point-of-interest. The RBCs’ diameter can be simply determined by the QPI image; the cellular volume can be determined by integrating the phase profile shown in Figure 4C-II; the number of cells can be counted by checking the number of phase peaks; the cellular velocity can be measured by using the time spent for an RBC to move over a known distance. The RBCs’ mean diameter was ~10.9 µm and their mean velocity at 24 hpf was 323.05 µm/s (Figure 4C-II). The number of RBCs flown over was 117 cells per minute. After 48 hpf, the signal exhibits a pulsatile flow of groups of RBCs with an average time interval of 0.452 s (Figure 4C-III); this can be translated into the heart rate of zebrafish, 2.21 Hz or 132.7 bpm (beats-per-minute), which agrees well with the previous report [47]. A single pulse of the heartbeat contains many RBCs, which are clearly resolved as shown in Figure 4C-IV. A single pulse includes 7~10 RBCs and they are separated by 18.3 ms in average; the phase change made by a RBC is 0.97 rad in average and their deviation is 0.39 rad. This detailed quantitative in-vivo cellular monitoring has not been possible in precedent bright-field and fluorescent imaging [48,
49]. Optical Doppler effect has enabled a high-speed label-free detection of blood flow but with a low spatial resolution [50]. This FCR-QPI offers a simple, fast, and label-free quantitative phase imaging with high spatial and temporal resolutions, which can be used for high-speed monitoring intra- and inter-cellular dynamic motions.
3. Discussion
The phase stability of a QPI system is determined by three parameters: (i) the stability of the optical path difference (L) (between the reference and the sample arm), (ii) the stability of the refractive index (n) (determined by environmental parameters of temperature, pressure, humidity, and CO2 portion, and (iii) the wavelength stability of the light source () by ϕ=2nL/. The phase sensitivity
(ϕ) due to the wavelength instability () was characterized by ϕ=(-2nL/2), where L=~30
m, n=1.000, and =800 nm are set as the basic parameters for all light sources. Therefore, this leads to an OPD error of 30 nm with a free-running laser diode (/~10-3
), an OPD error of 0.3 nm for a non-stabilized He-Ne laser (/~10-5
), and an OPD error of 10-8 nm for a frequency comb (/~10-12
). In addition, we experimentally measured the phase instability and calculated as an Allan deviation. To quantitatively evaluate the measurement precision and update rate, Allan deviations were derived at various averaging times for the following three light sources (Figure 4D and Materials and Methods): a CW LD, a femtosecond pulse laser without frequency stabilization (FS), and a frequency comb (FC) with full frequency stabilization. Compared to CW LD, FS and FC provide higher long-term phase stability, i.e. 3.39×10⁻³ and 2.39×10⁻³ at an averaging time of 10 s, which are 5.2 and 7.4 times better than a CW LD; this means we can analyze a single wavelength with 2,629 steps using FC. For longer time spans than 0.1 s, the FC provided better phase stabilities due to its direct stabilization to a Rb atomic clock of the international time standard. There is still a slight instability increase in the long term, which is caused by slow environmental disturbances in the QPI interferometer, not by the FC. The green filled regime in Figure 4D is a newly enabled stability area by FCR-QPI. Depending on the dynamic motion of interest, our technique can provide the update rates over 10 MHz by using a combination of a programmable spatial filter and a high-speed photo-detector; the ultimate high-speed is set by the photodetector’s bandwidth.
4. Conclusion
In conclusion, we demonstrated that a frequency comb can newly provide a wide coherence tunability for higher visibility interferograms, phase-coherent multiple wavelengths for relating the cellular RI ratio and physical height, and higher phase stability for higher sensitivity/resolution QPI at a higher speed up to 16.9 kHz. Thereby, the cellular swelling and protein degradation during the cellular death were monitored in real time via the optical volume and RI ratio. When considering
the wavelength stability, wide coherence tunability, and phase-coherent multiple wavelengths over a broad spectrum, FCR-QPI will enable in-depth understanding of high-speed dynamic motions in various cellular, bio-molecular, micro-physical and micro-mechanical samples. FCR-QPI provides an alternative method in line with previously conducted works [55,56] to address the gap of molecular information in the QPI field.
Experimental Section and Methods
Key advantages of FCR-QPI: The contributions of our FCR-QPI are summarized as follows: (i)
coherence tunability, (ii) phase stability, and (iii) multiple wavelength. Firstly, wide tunability in spatio-temporal coherences are required in QPI to cover different applications. In most interferometric microscopy systems including QPI, the spatial coherence and temporal coherence compete with each other; for example, low-scattering thin samples and highly scattering thick samples require different temporal and spatial coherences to the light source [52]. In our work, FCR-QPI can provide tunable spatio-temporal coherences well-suited for a multipurpose instrument. The spatio-temporal coherence tunability can also allow for ex-post numerical refocusing up and down within the sample. This is a big plus in case of imaging a moving object in 3D space such as living cells in a matrix gels or a 3D particle-flow analysis [53]. Secondly, phase stabilization is the prerequisite for higher precision QPI. In QPI, the phase sensitivity depends on the wavelength stability of the light source used. In our FCR-QPI, the laser wavelength was carefully stabilized to an absolute reference of a Rb time standard with better stabilities than 10-12 stability over 1 s. Therefore, FCR-QPI provides higher optical phase stabilities over long time spans, which enhanced the measurement precision of the long-term dynamic phase variations. Lastly, the frequency-comb-referenced multiple wavelengths was introduced to QPI for relating the physical volume to the RI ratio instead of using multiple CW lasers. It is possible because a frequency comb can be regarded as a combination of highly coherent well-stabilized millions of multi-wavelength CW lasers. Compared to previous multi-wavelength QPI, a frequency comb provides phase-coherent multiple
wavelengths from a single light source with speckle suppression, which also makes the long-term measurement performance of QPI more stable. Furthermore, FCR-QPI could be a future imaging platform to fill the gap of lacking molecular specificity, which is the main issue in QPI. Even though the fluorescence tags offer high-contrast imaging with molecular specificity, they often provide qualitative information about the physical properties of the bio-sample only and are often affected by sample preparation. More importantly, the use of labeling agents, such as fluorescence proteins and dyes, may alter the normal physiology of bio-samples and limit in vivo applications. If one can tag specific structures in live cells using well-defined and super-stable narrow-line wavelengths (i.e. narrow and stable colors for molecular tagging) of high enough refractive index contrast, QPI can become an ideal imaging tool, providing highly specific information, without the limitations associated with fluorescence [54]. Therefore, FCR-QPI was developed as a first building block of such a significant technical goal in the QPI field.
Frequency comb: A spectrally broadened visible frequency comb (FC-1500-250-WC, M-VIS,
Menlo Systems) was employed as the light source. The master oscillator was an Er-doped fibre femtosecond laser having a repetition rate of 250 MHz, a centre wavelength of 1550 nm, and a spectral bandwidth of ~25 nm. The power was amplified at two Er-doped fibre amplifiers (EDFAs); one was used for frequency stabilisation and the other for nonlinear spectral broadening. At the frequency stabilisation part, the repetition frequency (fR) and carrier-envelope offset frequency (fCEO) were phase-locked to a reference Rb atomic clock (FS725, Stanford Research Systems) for establishing a frequency comb, with the aid of a f-2f interferometer and phase-locked control loops. At the spectral broadening part, the pulses were firstly wavelength converted to a near-infrared range of ~780 nm by second harmonic generation, and then coupled to a photonic crystal fibre to have a broad supercontinuum over 620 to 980 nm.
3D spatio-temporal coherence cloud: The spatial coherence describes the optical correlation
between two points in the space, which implies how much these two points interfere with each
other; the spatial coherence was quantified by the visibility, V of the interferogram. The temporal coherence measures the correlation between the optical wave from a light source and its time-delayed replica, which describes how monochromatic a light source is. The temporal coherence was quantified by the coherence length, Lc. The speckle level was determined via the speckle contrast, C which is defined as , where is the standard deviation of the overall intensity, and is the averaged intensity for each background image (Figure S1).
Temporal coherence: Temporal coherence was evaluated by the coherence length, Lc; Lc=2/n∆,
where is the central wavelength, ∆ is the spectral bandwidth in full-width-half-maximum (FMHM), and n is the RI of the medium [17]. The temporal coherence of the frequency comb (FC1500-250-WG, Menlo Systems) without a BPF and with BPFs with the bandwidth of 40, 25, and 10 nm at FWHM were calculated to 8.1, 14.0, 22.5, and 56.3 µm, respectively. These numbers were also experimentally verified with the QPI interferograms. The temporal coherence lengths were measured to 7.9, 15.0, 22.5, and 56.3 µm, respectively, which agrees well with the calculation. A CW LD (MCLS1, Thorlabs) was confirmed to have a coherence length of ~20 mm using a Michelson homodyne interferometry with the reference arm scanning.
Spatial coherence: The spatial coherence was evaluated by the visibility. Young’s double slit
experiments were conducted to determine the spatial coherence of a FC and a CW LD. The mutual coherence function, of the interference fringes exhibits the spatial coherence of the light source. For the quantitative description of the spatial coherence, we obtained the mutual coherence function, from the interference fringes. The degree of coherence between two electric fields, E1 and E2 , is defined as , where and . Since the intensities at two slits are almost the same, can be regarded to be equal to the visibility of the fringe, =V=(Imax -Imin)/(Imax+Imin), where Imax and Imin are the maximum and minimum intensities of the interference fringes. We then used LSR to control the spatial coherence which basically scrambles the illumination phase and average out the coherent speckle noise. The spatial coherences were 0.88,
0.81, 0.66, and 0.63 for a FC (without a BPF) without LSR and with LSRs of DA=1, 6, and 12, respectively. The spatial coherences were 0.96, 0.86, 0.71, and 0.70 for a FC after passing through a BPF of 40-nm BW without LSR and with LSRs of DA=1, 6, and 12. The spatial coherences were 0.97, 0.92, 0.73, and 0.72, for a FC after passing through a BPF of 25-nm BW without LSR and with LSRs of DA=1, 6, and 12. The spatial coherences were 0.98, 0.93, 0.75, and 0.73, for a FC with a BPF of 10-nm BW without LSR and with LSRs of DA= 1, 6, and 12. The spatial coherences were 0.98, 0.9, 0.73, and 0.68, for a CW LD without LSR and with LSRs of DA=1, 6, and 12 (Figure S2).
Speckle contrast: Speckle contrast was obtained by imaging a 1963A US Air Force (AF) resolution
test chart in the scattering environment with various temporal and spatial coherences (Figure S1). The scattering film (with DA = 0.5) was used to generate the scattering noise in the imaging system. The speckle contrast (C) was calculated at the background area (rectangular area as shown in Figure S1) using C=SDI/<I>, where SDI is the standard deviation of the overall intensity, and <I> is the averaged intensity for each background image. The speckle contrasts were 0.52, 0.36, 0.34, and 0.29 for a FC without LSR and with LSRs of DA=1, 6, and 12, respectively. The speckle contrasts were 0.66, 0.40, 0.36, and 0.33 for a FC with a BPF of 40-nm BW without LSR and with LSRs of DA=1, 6, and 12. The speckle contrasts were 0.74, 0.42, 0.38, and 0.35 for a FC with a BPF of 25-nm BW without LSR and with LSRs of DA=1, 6, and 12. The speckle contrasts were 0.86, 0.75, 0.46, and 0.39 for a FC with a BPF of 10-nm BW without LSR with LSRs of DA=1, 6, and 12. The speckle contrasts were 0.91, 0.62, 0.43, and 0.36 for a CW LD without LSR and with LSRs of DA=1, 6, and 12. For the comparison, we also imaged polystyrene microbeads without the scattering film in an illumination path to demonstrate the effect of various spatio-temporal coherence of the illumination in FCR-QPI (Figure S3).
QPI unit: The QPI configuration, satisfying both off-axis and common-path geometry, can provide
both benefits of a high data acquisition rate and a high phase stability in the time domain. Our QPI
unit is the modified Michelson-type version of Baek et al.’s off-axis common-path QPI unit [19]; this update was addressed for matching the OPD for forming the low-coherence interferogram within the short coherence length of the FC.
Coherence control in QPI: The frequency comb was delivered to the BPFs with various spectral
BWs (centre=750 nm, BW=40, 25, and 10 nm) for the temporal coherence control. Then, the light was focused onto the LSRs with various DAs (DA=1, 6, and 12) for the spatial coherence control. Before the light delivery to the polystyrene microbeads immersed in index-matching oil, a scattering film (polycarbonate film, ρ=1.2 g/cm3, DA=1°) was placed in the illumination path. The scattering film is used to create the scattering noise to mimic the condition that could be found in the tissues and cellular environment. The light diffracted from the microbead was collected by an objective lens (NA=0.7, M=60) in an inverted microscope. Then, the light was transmitted to the Michelson-type QPI unit. The resulting interferograms of the microbead at various spatial and temporal coherences of the illumination were recorded by the CCD camera.
Multi-wavelength QPI: Three wavelength segments of the frequency comb were extracted by the
BPFs with different central wavelengths (centre=700, 750, and 800 nm, BW=10 nm) to illuminate the MCF-7 human breast cancer cells. The scattering film (polycarbonate film, ρ=1.2 g/cm3, DA=0.5°) was placed in the illumination path to create more scattering environment which possibly can be found in biological environments or plasmonic sample. Then, the LSR with DA=6° was used here to suppress the speckle noise. After illuminating the cells, scattered light was collected by the objective lens (NA=0.7, M=60), and then transmitted to the QPI unit. Time-lapse interferograms of the cell at each wavelength were recorded with a time interval of 20 minutes for 9 hours.
High-speed QPI for fast dynamic mechanical motion of an optical fibre: For more precise phase
detection, non-uniform external coating layer of the optical fibre was removed. A short piece of fibre (~8 mm) was utilized here to suppress high-order vibration modes. One end of the fibre was mounted to the PZT and the other end (~5 mm) was immersed in the index-matching medium
(glycerol/water: 90/10) filled in the cover slip channels. When the input signal was applied to the PZT, the fibre was oscillated perpendicularly to the illumination beam. The resulting phase modulated signal was collected by the objective lens (NA=0.25, M=10), and delivered to the QPI unit.
Allan deviation of phase instability: The light from each light sources: (i) CW laser diode (LD), (ii)
femtosecond laser (FS), and (iii) frequency comb (FC) was transmitted through our setup (Figure 4A) The temporal signal was detected by a Si photodetector and recorded by a digital oscilloscope (Rigol, DSA6102) for the period of 700 s. The temporal fluctuation of the phase instability was calculated as Allan deviation of two illumination conditions: (i) with the sample (Mea.) and (ii) without the sample (Ref.) in the illumination path.
MCF-7 cell culture: MCF-7 cells were cultured in Dulbecco’s modified Eagle’s media (DMEM)
with 10% (v/v) Fetal Bovine Serum (Gibco, CA) containing growth factors (i.e., protein). Penicillin (100 units/ml) and streptomycin antibiotics (100 µg/ml, Hyclone, CA) were added to the media to prevent bacterial contamination. The cells were grown in a 37°C incubator with 5% CO2, 95% humidity. Cell were passaged every 3-4 days. 5,000 cells were seeded on the 12 mm coverslip of a quartz based dish (Iwaki, Japan) and allowed to grow for 72 hours before changing with fresh media for the experiment.
RI ratio determination: The RI ratio at two illumination wavelengths of 700 (1) and 800 nm (3)
was calculated by n1-nm1/n3-nm3=11/33, where n1,3 are the RIs of the cell measured at 700
and 800 nm,nm1,m3 is the RI of the culture media measured at 700 and 800 nm, and 1,3 is the
OPD measured at 700 and 800 nm. Note that the RI ratio was expressed by the RI difference of the cell and culture media.
Embryonic zebrafish growth and preparation: Zebrafish embryos were derived from natural
matings of AB wild-type adults, housed in the LKC Medicine Zebrafish Facility, NTU. Zebrafish housing, mating and embryo manipulations were performed under the oversight of the NTU
Institutional Animal Care and Use Committee (IACUC) under IACUC Protocol Number A18002 and complied with the National Advisory Committee For Laboratory Animal Research (NACLAR) Guidelines set out by the Agri-Food and Veterinary Authority (AVA) of Singapore. Embryos were collected and maintained in E3 media (5 mM NaCl, 0.17 mM KCl, 0.33 mM CaCl2, 0.33 mM MgSO4, 10-5% Methylene Blue). Embryos were dechorionated with watchmakers’ forceps and then anaesthetized with 0.02% Tricaine (buffered to pH7.0). Embryos were added into 0.7% molten low melting agarose maintained at ~42 °C. Vacuum grease was used to draw a border around the edges of a standard microscope glass slide. Embryos were pipetted onto the glass slide inside the vacuum grease border and orientated using a fine gel loading tip. After the gel solidified, the vacuum grease-bordered area was then flooded with E3 media and a long glass coverslip was used to cover the mounted specimens (~5 embryos/slide).
Cellular death: Oncosis is an accidental death of cells caused by environmental perturbations or
external noxious stimuli. Cell undergoes oncotic process exhibits distinct morphological characteristics. Initially, external noxious stimuli induce cell membrane injury and lead to cellular and organelles swelling. After that, cell membrane becomes leaky and non-selective membrane. Lastly, the cell membrane eventually breakdowns and releases the cellular structural protein which is in a necrotic phase. For biochemical levels, oncotic cell death is induced by energy depletion. It involves mitochondria damage which leads to a reduction of ATP (Adenosine triphosphate) generation and loss of energy storage. Eventually, DNA is damaged, and the disruption of other cellular organelles are found [41, 42].
Working principle of LSR: The optical diffuser or LSR used in this study has uniform intensity
transmittance, but it has two independent phase-modulated parts, one contributed by a static diffuser ( ) and another contributed by a moving diffuser ( ). When the incident plane wave passing through the diffuser, it produces a transmitted field of the form; , where is a constant and the diffuser is assumed to moving
in the positive direction with the speed . As the diffuser rotates and scatters the incident wave, any point on the object that is contributing to the image point will experience an altered phase of the illumination varying with time, t. The time-varying random walk of field amplitudes and phases of the speckle are also created on each image point. If the integration time of an imaging sensor is slower than the rotating speed of the LSR, the speckle effect will be averaged out in the image. Supporting Information
Supporting Information is available from the Wiley Online Library or from the author. Acknowledgements
Funding: This work was supported by the Singapore National Research Foundation (NRF-NRFF2015-02).
Y.-J. Kim and S.-W. Kim acknowledges support from the National Research Foundation of the Republic of Korea (NRF-2012R1A3A1050386).
Author Contributions: The project was planned and overseen by J.B., S.-W.K., and Y.-J.K. Experimental
system was designed, prepared and characterized by J.B., H.F., and T.M.R. MCF-7 cells are prepared and tested by J.B., H.T.T., and H.S.Y. Zebrafish were prepared and their measurement results were analyzed by J.B., S.K., T.C., and Y.-J.K. Interferograms were analysed by J.B., H.F., T.M.R., and Y.-J.K. All authors contributed to the manuscript preparation and final paper polishing.
Competing Interests: The authors declare no competing interests.
References
[1] F. Zernike, Physica 1942, 9, 974.
[2] R. D. Allen, G. B. David, G. Normaski, Z. Wiss. Mikrosk. 1969, 69, 193.
[3] W. Choi, C.Fang-Yen, K. Badizadegan, S. Oh , N. Lue, R. R. Dasari, M. S. Feld, Nat. Methods 2007, 4,
717.
[4] Y. Park, M. Diez-Silva, G. Popescu, G. Lykotrafitis, W. Choi, M. S. Feld, S. Suresh, Proc. Natl. Acad.
Sci. USA. 2008, 105, 13730.
[6] G. Popescu, Quantitative phase imaging of cells and tissues, McGraw-Hill Professional, NY 2011. [7] Y. Park, C. Depeursinge, G. Popescu, Nat. Photon. 2018, 12, 578.
[8] M. Habaza, M. Kirschbaum, C. Guernth‐ Marschner, G. Dardikma, I. Barnea, R. Korenstein, C. Duschl, N.T. Shaked. Adv. Sci. 2017, 4, 1600205.
[9] R. Wang. Z. Wang, L. Millet, M.U. Gillette, A.J. Levine, G. Popescu, Opt. Express 2011, 19, 20571.
[10] K. Kim, J. Yoon, S. Shin, S. Lee, S. A. Yang, Y. Park, J. Biomed. Photonics Eng. 2016, 2. [11] Y. Jang, J. Jang, Y. Park, Opt. Express 2012, 20, 9673.
[12] T. Kim,R. Zhou, M. Mir, S. D. Babacan, P.S. Carney, L.L. Goddard, G. Popescu. Nat. Photon. 2014, 8,
256.
[13] S. Lee, H. Park, K. Kim, Y. Sohn, S. Jang, Y. Park. Sci. Rep. 2017, 7.
[14] K. Kim, Y. Park, Nat. Commun. 2017, 8, 15340.
[15] H. Farrokhi, T. M. Rohith, J. Boonruangkan, S. Han, H. Kim, S. W. Kim, Y. J. Kim. Sci. Rep. 2017, 7.
[16] H. Farrokhi, J.Boonruangkan, B. J. Chun, T. M. Rohith, A. Mishra, H.T. Toh, H. S. Yoon, Y. J. Kim,
Opt. Express 2017, 25, 10791.
[17] J. W. Goodman, Statistical Optics, Wiley-Interscience, NY 1985. [18] Y. Deng, D. Chu, Sci. Rep. 2017, 7, 5893.
[19] Y. Baek, K. Lee, J. Yoon, K. Kim, Y. Park, Opt. Express 2016, 24, 9308. [20] A. H. Dhalla, J. V. Migacz, J. A. Izatt, Opt. Lett. 2010, 35, 2305.
[21] B. Redding, M. A. Choma, H. Cao, Nat. Photon. 2012, 6, 355. [22] F. J. Duarte, L. S. Liao, K. M. Vaeth, Opt. Lett. 2005, 30, 3072.
[23] M. Nixon, B. Redding, A. A. Friesem, H. Cao, N. Davidson, Opt. Lett. 2013, 38, 3858. [24] A. Ahmad, V. Dubey, G. Singh, V. Singh, D. S. Mehta, Opt. Lett. 2016, 41, 1554. [25] F. Dubois, L. Joannes, J. C. Legros, Appl. Opt. 1999, 38, 7085.
[26] H. Pham, B. Bhaduri, H. Ding, G. Popescu, Opt. Lett. 2012, 37, 3438. [27] M. Rinehart, Y. Zhu, A. Wax, Biomed. Opt. Express 2012, 3, 958.
[28] Y. Park, T. Yamauchi, W. Choi, R. Dasari, M. S. Feld, Opt. Lett. 2009, 34, 3668.
[29] D. J. Jones, S. A. Diddams, J. K. Ranka, A. Stentz, R. S. Windeler, J. L. Hall, S. T. Cundiff. Science
2000, 288, 635.
[30] T. Udem, R. Holzwarth, T. W. Hänsch, Nature 2002, 416, 233. [31] N. Picqué, T. W. Hänsch, Nat. Photon. 2019, 13, 146.
[32] T. Wilken, G. L. Curto, R. A. Probst, T. Steinmetz, A. Manescau, L. Pasquini, J. I. Hernández, R. Rebolo, T. W. Hänsch, T. Udem, R. Holzwarth, Nature 2012, 485, 611.
[33] F. R. Giorgetta, W. C. Swann, L. C. Sinclair, E. Baumann, I. Coddington, N. R. Newbury. Nat. Photon.
2013, 7, 434.
[34] J. Lee, Y. J. Kim, K. Lee, S. Lee, S. W. Kim, Nat. Photon. 2010, 4, 716. [35] K. Minoshima, H. Matsumoto, Appl. Opt. 2000, 39, 5512.
[36] S. Hyun, M. Choi, B. J. Chun, S. Kim, S. W. Kim, Y.J. Kim, Opt. Express 2013, 21, 9780.
[37] S. Reinhardt, G. Saathoff, H. Buhr, L. A. Carlson, A. Wolf, D. Schwalm, S. Karpuk, C. Novotny, G. Huber, M. Zimmermann, R. Holzwarth. Nat. Phys. 2007, 3, 861.
[38] B. J. Chun, S. Hyun, S. Kim, S. W. Kim, Y. J. Kim, Opt. Express 2013, 21, 29179. [39] N. R. Newbury Nat. Photon. 2011, 5, 186.
[40] C. Edwards, B. Bhaduri, T. Nguyen, B. G. Griffin, H. Pham, T. Kim, G. Popescu, and L. L. Goddard.
Opt. Express 2014, 22, 5133.
[41] G. Majno, I. Joris, Am. J. pathology 1995, 146.
[42] P. Weerasinghe, L. M. Buja, Exp. Mol. Pathol. 2012, 93, 302. [43] K. Creath, G. Goldstein, Biomed. Opt. Express 2012, 3, 2866.
[44] Q. Zhang, L. Zhong, P. Tang, Y. Yuan, S. Liu, J. Tian, X. Lu. Sci. Rep. 2017, 7. [45] A. V. Kalueff, A. M. Stewart, R. Gerlai, Trends Pharmacol. Sci. 2014, 35, 63. [46] S. Isogai, M. Horiguchi, B. M. Weinstein, Dev. Biol. 2001, 230, 278.
[47] M. A. Denvir, C. S. Tucker, J. J. Mullins, BMC Biotechnol. 2008, 8, 1.
[48] H. Anton, S. Harlepp, C. Ramspacher, D. Wu, F. Monduc, S. Bhat, M. Liebling, C. Paoletti, G. Charvin, J. B. Freund, J. Vermot. Dev. 2013, 140, 4426.
[49] S. C. Watkins, S. Maniar, M. Mosher, B. L. Roman, M. Tsang, C. M. St Croix. PloS One 2012, 7, e44018.
[50] D. Donnarumma, A. Brodoline, D. Alexandre, M. Gross, Microsc. Res. Tech. 2018, 81, 153.
[52] I. Abdulhalim, J. Opt. A: Pure Appl. Opt. 2006, 8, 952. [53] P. Kolman, R. Chmelik, Opt. Express 2010, 18, 21990. [54] J. H. Jung, J. Jan, Y. K. Park, Anal. Chem. 2013, 85, 10519.
[55] C. Hu, J. J. Field, V. Kelkar, B. Chiang, K. Wernsing, K. C. Toussaint, R. A. Bartles, and G. Popescu. Nat. Photon. 2020, 14, 564.
[56] D. Zhang, L. Lan, Y. Bai, H. Majeed, M. E. Kandel, G. Popescu, and J-X. Cheng. Light: Science &
Application 2019, 8, 116.
Copyright WILEY-VCH Verlag GmbH & Co. KGaA, 69469 Weinheim, Germany, 2020.
TOC text and graphical abstract
Frequency-comb-referenced quantitative phase imaging (FCR-QPI) provides a wide coherence tunability for higher visibility interferograms, phase-coherent multiple wavelengths for refractive index measurement, and higher phase stability at a higher speed (16.9 kHz), highly requested in life sciences, biochemistry, material sciences, and fluid mechanics. These superior characteristics of FCR-QPI will enable in-depth understanding of dynamic motions in cellular, bio-molecular, and micro-physical samples.
Jeeranan Boonruangkan†, Hamid Farrokh†, Thazhe Madam Rohith, Hui Ting Toh, Abhinay Mishra, Ho Sup Yoon, Samuel Kwok, Tom Carney, Seung Woo Kim and Young-Jin Kim*
Coherence-tailored Multi-wavelength High-speed Quantitative Phase Imaging with a High Phase Stability via a Frequency Comb