An Eastward Shift of the North Pacific Oscillation After
the Mid-1990s and Its Relationship With ENSO
Sang-Wook Yeh1 , Dong-Won Yi1, Mi-Kyung Sung2 , and Young Ho Kim3 1
Hanyang University, ERICA, Department of Marine Sciences and Convergent Technology, Ansan, South Korea,2Ewha Womans University, Seoul, Korea,3Korean Institute of Ocean Science and Technology, Physical Oceanography Division, Busan, Korea
Abstract
The North Pacific Oscillation (NPO), which is characterized by a north-south dipole-like pattern of sea level pressure (SLP) in the North Pacific, is an atmospheric circulation that is a key to understanding tropical-extratropical interactions in the Pacific. We show that the center of the southern lobe SLP in the NPO during boreal winter (December-January-February) is shifted to the east after the mid-1990s compared to before the mid-1990s. This leads to the change in the relationship between the NPO and El Niño and the Southern Oscillation (ENSO). The NPO is closely associated with the convective forcing in the tropical Pacific during boreal winter before the mid-1990s. After the mid-1990s, in contrast, the simultaneous relationship of the NPO and ENSO during boreal winter becomes weak. However, an eastward shift of the NPO’s southern lobe SLP during boreal winter causes a close relationship with the ENSO in the winter of the following year through atmosphere-ocean coupled processes after the mid-1990s. These results indicate that atmospheric circulation in the North Pacific characterized by the NPO becomes more influential in the tropical Pacific with a lagged time after the mid-1990s, likely due to the eastward shift in the NPO’s structure. We also briefly discuss which processes cause an eastward shift in the NPO’s southern lobe SLP.Plain Language Summary
Understanding the North Pacific Oscillation (NPO), which is characterized by a north-south dipole-like pattern of sea level pressure (SLP) in the North Pacific, is a key to understanding tropical-extratropical interactions in the Pacific. This study examines the decadal changes in the NPO’s spatial structure and its consequent change in the relationship with El Niño and the Southern Oscillation (ENSO) for 1979–2016. It is found that the center of the southern lobe SLP in the NPO during boreal winter (December-January-February) is shifted to the east after the mid-1990s compared to before the mid-1990s. This leads to the change in the relationship between the NPO and ENSO. An eastward shift of the NPO’s southern lobe SLP during boreal winter causes a close relationship with the ENSO in the winter of the following year through atmosphere-ocean coupled processes after the mid-1990s.1. Introduction
The North Pacific Oscillation (NPO) is defined as the second empirical orthogonal function (EOF) of sea level pressure (SLP) variability and is characterized by a north-south seesaw pattern in the North Pacific. The northern lobe of SLP in high latitudes extends from eastern Siberia to western Canada, while the southern lobe of SLP at lower latitudes includes the subtropics and extends equatorward to 20°N (Linkin & Nigam, 2008; Rogers, 1981; Walker & Bliss, 1932; Wallace & Gutzler, 1981). Recently, several studies have documented the influence of the NPO on the climate over East Asia, North America, and the tropical Pacific (Chen & Wu, 2017; Pak et al., 2014; Wang et al., 2007; Yeh & Kim, 2010; Yu et al., 2012). Furthermore, Song et al. (2016) found that the boreal winter NPO has a pronounced influence on the subsequent Australian spring rainfall via air-sea coupled processes over the tropical Pacific. Therefore, it is useful to understand the variability in the NPO and its associated interactions in terms of extended-range predictions of weather and climate over the Pacific rim.
While the NPO is regarded as a purely stochastically driven phenomenon intrinsic to the North Pacific atmosphere (Rogers, 1981), sea surface temperature (SST) forcing in the central tropical Pacific might influence the NPO at low-frequency timescales through atmospheric teleconnections and air-sea interactions (Di Lorenzo et al., 2010; Furtado et al., 2012; Park et al., 2012, 2017). It has been suggested that the southern lobe of NPO on the low-frequency variations are intimately tied to the variability in central equatorial Pacific SST (Furtado et al., 2012). In contrast, there are other studies arguing that the boreal winter SST in the North
RESEARCH LETTER
10.1029/2018GL078671Key Points:
• A simultaneous relationship of the NPO and ENSO during boreal winter becomes weak after the mid-1990s • A shift of the NPO’s southern lobe SLP
causes a close relationship with the ENSO in the winter of the following year after the mid-1990s • A shift of the NPO’s southern lobe
indicates that the NPO has played an active role in influencing the tropical Pacific in the recent past
Supporting Information: • Supporting Information S1 Correspondence to: S.-W. Yeh, [email protected] Citation:
Yeh, S.-W., Yi, D.-W., Sung, M.-K., & Kim, Y. H. (2018). An eastward shift of the North Pacific Oscillation after the mid-1990s and its relationship with ENSO. Geophysical Research Letters, 45, 6654–6660. https://doi.org/10.1029/ 2018GL078671
Received 8 MAY 2018 Accepted 31 MAY 2018
Accepted article online 8 JUN 2018 Published online 12 JUL 2018
©2018. The Authors.
This is an open access article under the terms of the Creative Commons Attribution-NonCommercial-NoDerivs License, which permits use and distri-bution in any medium, provided the original work is properly cited, the use is non-commercial and no modifications or adaptations are made.
Pacific generated by the concurrent NPO is able to force El Niño and Southern Oscillation (ENSO) during the subsequent winter via a so-called“seasonal footprinting mechanism” (Anderson, 2004; Anderson et al., 2013; Chiang & Vimont, 2004; Vimont et al., 2001, 2003; Yeh et al., 2015; Yu et al., 2012; Yu & Kim, 2011). More spe-cifically, cyclonic circulation of the NPO’s southern lobe can induce wind anomalies opposing the trade winds. Concurrently, upward latent heat is reduced by the reduced wind speed and hence causes warming in the upper ocean during the boreal spring (Chiang & Vimont, 2004). Such NPO-driven anomalous SST per-sists until summer in the subtropics and potentially impacts equatorial zonal wind stress anomalies, which play a role in triggering ENSO via Bjerknes feedback processes (Alexander et al., 2010; Bjerknes, 1969). These studies indicate that understanding the NPO is a key to understanding tropical-extratropical interac-tions in the Pacific. The purpose of this study is to examine the decadal changes in the NPO’s spatial structure and its consequent change in the relationship with ENSO for 1979–2016. We also briefly discuss the dynami-cal processes behind the change of NPO’s spatial structure.
Section 2 provides a brief description of the data and methodology used in this study. The general features of the NPO are examined through composite and EOF analyses and are described in section 3. A summary and discussion are provided in section 4.
2. Data and Methods
We analyze atmospheric data sets from the National Centers for Environmental Prediction/National Center for Atmospheric Research reanalysis 1 (Kalnay et al., 1996). SST data are gathered from the Objectively Analyzed air-sea Fluxes (OAFlux) project with a horizontal resolution of 1°×1° longitude and latitude (Yu et al., 2008). Outgoing longwave radiation (OLR) data are collected from the Climate Prediction Center (Liebmann &
Smith, 1996). Net heat flux data are taken from the European Centre for Medium-Range Weather
Forecasts (Dee et al., 2011). Note that climatological winter mean is calculated from the monthly data during winter (December-January-February) for 1979–2016 and the same method is applied to obtain climatologi-cal mean for spring (March-April-May). Winter (spring) seasonal anomalies are obtained by subtracting cli-matological seasonal mean from the individual winter (spring) means. Our analysis covers the satellite period of 1979–2016 to minimize the effects of changes in the observing system. All data sets were linearly detrended in an effort to remove global warming signal. Note that 1979 winter indicates December 1979, January 1980, and February 1980. To identify a regime shift, the regime shift test (Rodionov, 2004) is applied. The NPO is defined as the second EOF of SLP in the North Pacific (120°E–120°W, 20°N–60°N) for the corre-sponding period by season (winter and spring). The NPO index is defined as the principal component time series for the corresponding period by season. The NINO3 index, which is defined by SST anomalies in winter averaged in the tropical Pacific center (150°W–90°W, 5°S–5°N), is also used to analyze the relationship between the NPO and tropical Pacific. To examine the changes on low-frequency timescales, a 15-year run-ning window is used. Unless stated otherwise in the text, the results are for the winter season only.
3. Results
Figure 1a shows the NPO index for 1979–2016, and its corresponding EOF pattern is represented in Figure 1b. The NPO index for 1979–2016 (Figure 1a) is characterized by a variability on interannual-to-multidecadal timescales. A typical NPO structure (Figure 1b), which is characterized by a north-south dipole structure over the North Pacific basin, is obtained, and the center of the southern (northern) lobe of the SLP is located in the central North Pacific (Alaska). We refer to this pattern as a positive NPO phase that includes anomalous low pressure over Alaska and anomalous high pressure near Hawaii in the central North Pacific. To characterize the NPO structural change in detail, we calculate the second EOF of North Pacific SLP during each of the six overlapping 15-year periods (1979–1993, 1984–1998, 1989–2003, 1994–2008, 1999–2013, and 2002– 2016). Figures 1c–1h indicate that the center of the southern lobe of the NPO shifts to the east as time progresses. In particular, the center of the southern lobe of the NPO shifts significantly from the west to the east around the mid and late 1990s. To further support this notion, we also calculate the NPO structures in relatively short periods of 1989–1993, 1990–1994, and 1993–1997, respectively, around the mid-1990s. (Figure S1). It is also found that a center of the southern lobe of the NPO is located to the central and eastern North Pacific in the periods including 1994, indicating that the NPO pattern changed after the mid-1990s. Conversely, a similar calculation is applied to thefirst EOF of SLP in the North Pacific, that is, the Pacific
North American (PNA) mode, for 1979–2016 (Figure S2). It is found that the spatial structure of the PNA is not much changed as time progresses, which is in contrast to the second EOF of SLP, that is, the NPO. However, it should be noted that the PNA mode is slightly shifted westward after the late-1990s, which might be associated with the westward shift in the location of the tropical convective heating around the dateline (Jo et al., 2015).
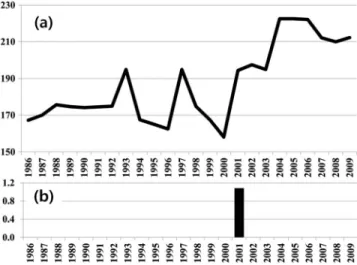
To examine further the eastward shift of the NPO, we display the time series of longitude where the maxi-mum variance of the southern lobe of SLP in the NPO defined by a 15-year window is located (Figure 2a). The center of the southern lobe of the NPO oscillates between 160°E and 190°E in the central North Pacific before the mid-1990s; however, it shifts to the east and oscillates between 200°E and 230°E after the mid-1990s. Here we note that the interdecadal change, seemingly occurred before and after 2001 in Figure 2, actually indicates a shift around the year 1994, as the year 2001 is a representative of a 15-year time window spanning from 1994 to 2008. It is thus obvious that the center of the southern lobe of the NPO is sig-nificantly shifted to the east after the mid-1990s, as evidenced by the climate regime shift analysis (Rodionov, 2004; Figure 2b), which is also consistent with the results in Figure 1. Figure S3 also displays the spatial struc-ture of NPO and its index before and after the mid-1990s, respectively. There is a clear eastward shift of the center of the southern lobe of the NPO after the mid-1990s compared to before the mid-1990s. The center of the southern lobe was located around 167.3°E during 1979–1993 but shifted eastward by about 45° to 212.5°E during 1994–2016.
To examine the relationship of an eastward shift in the NPO southern lobe and ENSO, wefirst plot the regressed SST anomalies against the NPO index before and after the mid-1990s, respectively (Figures 3a
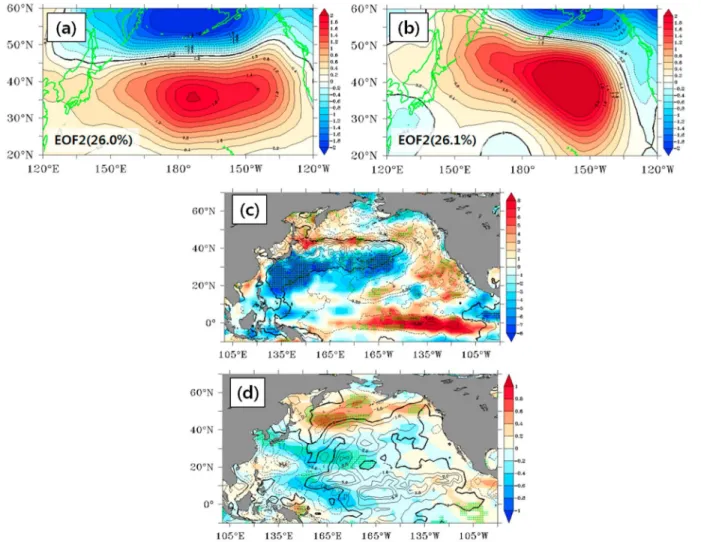
Figure 1. (a) Time series of the second principal component of winter mean (December-January-February) sea level pressure (SLP) anomalies in the North Pacific (120°E–24°E, 20°N–60°N) for 1979–2016. (b) The second empirical orthogonal function mode of winter mean SLP anomalies in the North Pacific for 1979–2016. Figures 1c–1h are the same as in Figure 1b except that they cover the periods of 1979–1993, 1984–1998, 1989–2003, 1994–2008, 1999–2013, and 2002–2016, respectively. The number in a parenthesis in Figures 1c–1h indicates the explained variance of North Pacific Oscillation.
and 3b). Note that the NPO index is defined as the principal component time series of the second EOF of SLP for the corresponding periods (see Figure S3). The most striking differences in the regressed SST anomalies before and after the mid-1990s are in the spatial pattern of regressed SST anomalies in the tropical Pacific. While the NPO is largely associated with the ENSO before the mid-1990s (Figure 3a), such a simultaneous relationship becomes weak after the mid-1990s (Figure 3b). A similar result is obtained by the composite difference of SLP and SST in the years when the NPO index is above or less than 0.75 standard deviation (±0.75σ, here σ indicates a standard deviation) before and after the mid-1990s, respectively (Figure S4). It is found that a strong NPO-like atmo-spheric circulation is observed in spite of a weak SST forcing in the central-to-eastern tropical Pacific for 1994–2016, indicating that a weak-ening relationship between the NPO and ENSO compared to that before the mid-1990s. Note that the simultaneous correlation coefficient between the NPO index and the NINO3 SST index during winter is 0.50 for 1979–1993, which is statistically significant at the 90% confi-dence level. In contrast, the NPO index is poorly correlated with the NINO3 SST index for 1994–2016; that is, the simultaneous correlation coefficient is 0.22, which is statistically insignificant. Similarly, we also calculate the simultaneous correlation coefficient between the NPO index and the OLR anomalies averaged in the central-to-eastern tropical Pacific (165°W–90°W, 5°N–5°S) during winter. Consistent with the result in the NPO index and the NINO3 SST index, a correlation for 1979–1993 is 0.57, which is higher than that for 1994–2016 (i.e., 0.36). While the correlation does not imply the causality, a reduced correlation coefficient indicates that the NPO is largely independent of tropical forcing after the mid-1990s.
Figure 3. Regression maps of SST (°C, shaded) and surface wind (m/s, vectors) against the North Pacific Oscillation (NPO) index in boreal winter for (a) 1979–1993 and (b) 1994–2016. Figures 3c and 3d are the same as in Figures 3a and 3b except that OLR anomalies (W/m2) are regressed against the NPO index for (c) 1979–1993 and (d) 1994–2016, respectively. Stippled areas in Figures 3a–3d exceed the 90% confidence level.
Figure 2. (a) Time series of the longitudinal center of the southern lobe in the North Pacific Oscillation (NPO) with a 15-year running window for 1979–2016 and (b) the estimated regime shift index. The black filled bar means that the statistically significant above the 90% level. Years on the x axis in Figures 2a and 2b indicate the middle year of the period when the NPO is calculated. For example, 2001 indicates the longitudinal center of the southern lobe in the NPO for 1994–2008.
These results indicate that the relationship of the tropical Pacific-North Pacific associated with the NPO has been changed since the mid-1990s. Figure 3c is the same as in Figure 3a, except the regressed OLR against the NPO index. Significant negative anomalies of OLR, which represent strong convective forcing, are domi-nant in the central-to-eastern tropical Pacific. This might indicate that the NPO is associated with convective forcing in the tropical Pacific via atmospheric teleconnections before the mid-1990s. In contrast, there are little significant OLR anomalies associated with the NPO after the mid-1990s (Figure 3d). This indicates that the simultaneous relationship between the NPO and ENSO as well as its associated tropical convective forcing becomes weak after the mid-1990s, which could be explained by two possibilities. One is that the eastward shift of the NPO’s southern lobe after the mid-1990s results in poor correlation between them. The other is that the changes in ENSO statistics as well as its associated convective forcing after the mid-1990s (Chen et al., 2017; Hu et al., 2017; Jo et al., 2015; Li et al., 2014; Yeo et al., 2012) may cause the weakening of simultaneous relationship between the NPO and ENSO. We briefly discuss this in section 4. We further argue that the eastward shift of the NPO southern lobe’s center acts to influence the tropical SST with a lagged time via atmosphere-ocean coupled processes after the mid-1990s. First of all, such an east-ward shift is also observed during the following spring (Figures 4a and 4b). The longitude of the center of the southern lobe is 204.3°E for 1994–2016 during spring, which has been shifted to the east by about 19.3°E compared to that for 1979–1993, when the longitude of the center of the southern lobe is 185.0°E. The eastward shift of the NPO’s southern lobe during winter and successive spring after the mid-1990s
Figure 4. The North Pacific Oscillation (NPO) structure in boreal spring (March-April-May, MAM(0)) for 1979–1993 (a) and 1994–2016 (b). Lagged regressed maps of (c) Qnet (W/m2, shaded, JJA(0)), SST (contour, June-July-August, JJA(0)), (d) surface zonal wind (m/s, shaded, JJA(0)), OLR (W/m2, contour, JJA(0)) against the NPO in spring (MAM(0)) for 1994–2016. Stippled areas in Figures 4c and 4d exceed the 90% confidence level, and the number in a parenthesis in Figures 4a and 4b indicates the explained variance of NPO.
may efficiently lead to wind-evaporation-SST interactions in the eastern subtropical Pacific where such air-sea coupled feedback processes are well defined (Chiang & Vimont, 2004; Vimont et al., 2001, 2003). Figure 4c displays the regressed net heatflux and SST during the following summer against with the NPO index in spring for 1994–2016. Figure 4d is the same as in Figure 4c, except the regressed surface zonal wind and OLR anomalies. Stronger northeasterly anomalies due to the eastward shift in the positive SLP of the NPO’s southern lobe in spring cause an increased net heat flux into the atmosphere, leading to a cool SST the following summer (Figure 4c). This cool SST in summer leads to a reduction in OLR as well as enhanced easterly wind anomalies around the equator (Figure 4d), which plays a role to initiate Bjkernes feedback processes (Bjerknes, 1969; Vimont et al., 2009), leading to La Niña event in the winter of the follow-ing year (Figure S5). In contrast, such a relationship is not observed for 1979–1993 (Figure S6); in addition, the air-sea coupled feedback processes for 1979–1993 are not well defined compared with that for 1994–2016 (Figure S7). Note that the simultaneous correlation coefficient between the NPO index during spring and the NINO3 SST index in the winter of the following year is 0.55 for 1994–2016, which is statis-tically significant at the 90% confidence level. In contrast, the NPO index during spring is poorly correlated with the NINO3 SST index in the winter of the following year for 1979–1993; that is, the simultaneous correlation coefficient is 0.04.
4. Summary and Discussion
In this study, we examined changes in tropical-extratropical interactions in the Pacific associated with the NPO for 1979–2016. We found that the center of the southern lobe SLP in the NPO is significantly shifted to the east after the mid-1990s during winter. Concurrently, the NPO is associated with convective forcing in the tropical Pacific via atmospheric teleconnections before the mid-1990s; in contrast, a simultaneous rela-tionship of the NPO and ENSO as well as its associated convective forcing becomes weak after the mid-1990s. The eastward shift in the NPO’s southern lobe after the mid-1990s caused enhanced air-sea interactions in the eastern subtropical Pacific. That is, the NPO in winter and successive spring is associated with the occur-rence of ENSO event in the winter of the following year after the mid-1990s in which wind-evaporation-SST interactions played an important role in the eastern subtropical Pacific. Therefore, we argue that an eastward shift of the NPO’s southern lobe indicates that the NPO has played an active role in influencing the tropical Pacific in the recent past.
We did not examine what causes such an eastward shift in the NPO’s southern lobe in the present study. According to the previous study Park and An (2014), however, the suppressed convection in the eastern tro-pical Pacific may lead to the northward movement of a local Hadley circulation. Subsequently, the jet axis over the eastern North Pacific moves to higher latitudes. This northward movement of the Jet axis over the North Pacific can be reflected as the NPO-like atmosphere circulation whose center is located in the eastern North Pacific, which may explain the eastward shift of NPO southern lobe’s center. This may suggest that the change in the tropical Pacific mean state as well as its associated convective forcing after the mid-1990s (see Figure S8) leads to a shift in the center of the NPO’s southern lobe to the east. On the other hand, we cannot exclude the possibility that changes in atmospheric circulation over the Arctic due to loss of sea ice can act to shift the center of the NPO’s southern lobe to the east by modulating the atmospheric circulation in high latitudes (Chen et al., 2013; Paik et al., 2017). The sea ice in the Arctic is significantly reduced after the early 1990s, which is earlier than an eastward shift of the southern lobe of the NPO after the mid-1990s (Figure S9). It would be useful to examine this argument based on an idealized model experiment.
References
Alexander, M. A., Tomas, R., Deser, C., & Lawrence, D. M. (2010). The atmospheric response to projected terrestrial snow changes in the late twenty-first century. Journal of Climate, 23(23), 6430–6437. https://doi.org/10.1175/2010JCLI3899.1
Anderson, B. T. (2004). Investigation of a large-scale mode of ocean-atmosphere variability and its relation to tropical Pacific sea surface temperature anomalies. Journal of Climate, 17(20), 4089–4098. https://doi.org/10.1175/1520-0442(2004)017<4089:IOALMO>2.0.CO;2 Anderson, B. T., Perez, R. C., & Karspeck, A. (2013). Triggering of El Nino onset through trade wind-induced charging of the equatorial Pacific.
Geophysical Research Letters, 40, 1212–1216. https://doi.org/10.1002/grl.50200
Bjerknes, J. (1969). Atmospheric teleconnections from the equatorial Pacific. Monthly Weather Review, 97(3), 163–172. https://doi.org/ 10.1175/1520-0493(1969)097<0163:ATFTEP>2.3.CO;2
Chen, J., Wang, X., Zhou, W., & Wen, Z. (2017). Interdecadal change in the summer SST-precipitation relationship around the late 1990s over the South China Sea. Climate Dynamics, 1–18.
Acknowledgments
The data sets of OAFlux project were obtained from http://oaflux.whoi.edu/ data.html, the National Centers for Environmental Prediction/National Center for Atmospheric Research R1 data sets were downloaded from https://www.esrl.noaa.gov/psd/data/ gridded/data.ncep.reanalysis.html, and the OLR data were obtained from https://www.esrl.noaa.gov/psd/data/ gridded/data.interp_OLR.html. The net heatflux data sets are gathered from http://apps.ecmwf.int/datasets/data/ interim-full-mnth/levtype=sfc/. This work was funded by the Korea Meteorological Administration Research and Development Program under grant KMI2018-03211.
Chen, S., Chen, W., Yu, B., & Graf, H. F. (2013). Modulation of the seasonal footprinting mechanism by the boreal spring Arctic Oscillation. Geophysical Research Letters, 40, 6384–6389. https://doi.org/10.1002/2013GL058628
Chen, S., & Wu, R. (2017). Impacts of winter NPO on subsequent winter ENSO: Sensitivity to the definition of NPO index. Climate Dynamics, 1–15.
Chiang, J. C., & Vimont, D. J. (2004). Analogous Pacific and Atlantic meridional modes of tropical atmosphere–ocean variability. Journal of Climate, 17(21), 4143–4158. https://doi.org/10.1175/JCLI4953.1
Dee, D. P., Uppala, S., Simmons, A., Berrisford, P., Poli, P., Kobayashi, S., et al. (2011). The ERA-Interim reanalysis: Configuration and perfor-mance of the data assimilation system. Quarterly Journal of the Royal Meteorological Society, 137(656), 553–597. https://doi.org/10.1002/ qj.828
Di Lorenzo, E., Cobb, K., Furtado, J., Schneider, N., Anderson, B., Bracco, A., et al. (2010). Central pacific El Nino and decadal climate change in the North Pacific ocean. Nature Geoscience, 3(11), 762–765. https://doi.org/10.1038/ngeo984
Furtado, J. C., Di Lorenzo, E., Anderson, B. T., & Schneider, N. (2012). Linkages between the North Pacific Oscillation and central tropical Pacific SSTs at low frequencies. Climate Dynamics, 39(12), 2833–2846. https://doi.org/10.1007/s00382-011-1245-4
Hu, C., Zhang, C., Yang, S., Chen, D., & He, S. (2017). Perspective on the northwestward shift of autumn tropical cyclogenesis locations over the western North Pacific from shifting ENSO. Climate Dynamics, 1–11.
Jo, H. S., Yeh, S. W., & Lee, S. K. (2015). Changes in the relationship in the SST variability between the tropical Pacific and the North Pacific across the 1998/1999 regime shift. Geophysical Research Letters, 42, 7171–7178. https://doi.org/10.1002/2015GL065049
Kalnay, E., Kanamitsu, M., Kistler, R., Collins, W., Deaven, D., Gandin, L., et al. (1996). The NCEP/NCAR 40-year reanalysis project. Bulletin of the American Meteorological Society, 77(3), 437–471. https://doi.org/10.1175/1520-0477(1996)077<0437:TNYRP>2.0.CO;2
Li, F., Wang, H., & Liu, J. (2014). The strengthening relationship between Arctic Oscillation and ENSO after the mid-1990s. International Journal of Climatology, 34(7), 2515–2521. https://doi.org/10.1002/joc.3828
Liebmann, B., & Smith, C. A. (1996). Description of a complete (interpolated) outgoing longwave radiation dataset. Bulletin of the American Meteorological Society, 77(6), 1275–1277.
Linkin, M. E., & Nigam, S. (2008). The North Pacific Oscillation–West Pacific teleconnection pattern: Mature-phase structure and winter impacts. Journal of Climate, 21(9), 1979–1997. https://doi.org/10.1175/2007JCLI2048.1
Paik, S., Min, S.-K., Kim, Y.-H., Kim, B.-M., Shiogama, H., & Heo, J. (2017). Attributing causes of 2015 record minimum sea-ice extent in the sea of Okhotsk. Journal of Climate, 30(12), 4693–4703. https://doi.org/10.1175/JCLI-D-16-0587.1
Pak, G., Park, Y. H., Vivier, F., Kwon, Y. O., & Chang, K. I. (2014). Regime-dependent nonstationary relationship between the East Asian Winter Monsoon and North Pacific Oscillation. Journal of Climate, 27(21), 8185–8204. https://doi.org/10.1175/JCLI-D-13-00500.1
Park, J. H., & An, S. I. (2014). The impact of tropical western Pacific convection on the North Pacific atmospheric circulation during the boreal winter. Climate Dynamics, 43(7–8), 2227–2238. https://doi.org/10.1007/s00382-013-2047-7
Park, J. H., An, S. I., & Kug, J. S. (2017). Interannual variability of western North Pacific SST anomalies and its impact on North Pacific and North America. Climate Dynamics, 49(11–12), 3787–3798. https://doi.org/10.1007/s00382-017-3538-8
Park, J. Y., Yeh, S. W., & Kug, J. S. (2012). Revisited relationship between tropical and North Pacific sea surface temperature variations. Geophysical Research Letters, 39, L02703. https://doi.org/10.1029/2011GL050005
Rodionov, S. N. (2004). A sequential algorithm for testing climate regime shifts. Geophysical Research Letters, 31, L09204. https://doi.org/ 10.1029/2004GL019448
Rogers, J. C. (1981). The North Pacific Oscillation. International Journal of Climatology, 1(1), 39–57. https://doi.org/10.1002/joc.3370010106 Song, L., Li, Y., & Duan, W. (2016). The influence of boreal winter extratropical North Pacific Oscillation on Australian spring rainfall. Climate
Dynamics, 47(3–4), 1181–1196. https://doi.org/10.1007/s00382-015-2895-4
Vimont, D. J., Alexander, M., & Fontaine, A. (2009). Midlatitude excitation of tropical variability in the Pacific: The role of thermodynamic coupling and seasonality. Journal of Climate, 22(3), 518–534. https://doi.org/10.1175/2008JCLI2220.1
Vimont, D. J., Battisti, D. S., & Hirst, A. C. (2001). Footprinting: A seasonal connection between the tropics and mid-latitudes. Geophysical Research Letters, 28(20), 3923–3926. https://doi.org/10.1029/2001GL013435
Vimont, D. J., Wallace, J. M., & Battisti, D. S. (2003). The seasonal footprinting mechanism in the Pacific: Implications for ENSO. Journal of Climate, 16(16), 2668–2675. https://doi.org/10.1175/1520-0442(2003)016<2668:TSFMIT>2.0.CO;2
Walker, G. T., & Bliss, E. (1932). World weather V. Memorial Royal Meteorological Society, 4, 53–84.
Wallace, J. M., & Gutzler, D. S. (1981). Teleconnections in the geopotential heightfield during the Northern Hemisphere winter. Monthly Weather Review, 109(4), 784–812. https://doi.org/10.1175/1520-0493(1981)109<0784:TITGHF>2.0.CO;2
Wang, L., Chen, W., & Huang, R. (2007). Changes in the variability of North Pacific Oscillation around 1975/1976 and its relationship with East Asian winter climate. Journal of Geophysical Research, 112, D11110. https://doi.org/10.1029/2006JD008054
Yeh, S.-W., & Kim, C.-H. (2010). Recent warming in the Yellow/East China Sea during winter and the associated atmospheric circulation. Continental Shelf Research, 30(13), 1428–1434. https://doi.org/10.1016/j.csr.2010.05.002
Yeh, S.-W., Wang, X., Wang, C. Z., & Dewitte, B. (2015). On the relationship between the North Pacific climate variability and the Central Pacific El Nino. Journal of Climate, 28(2), 663–677. https://doi.org/10.1175/JCLI-D-14-00137.1
Yeo, S. R., Kim, K. Y., Yeh, S.-W., & Kim, W. (2012). Decadal changes in the relationship between the tropical Pacific and the North Pacific. Journal of Geophysical Research, 117, D15102. https://doi.org/10.1029/2012JD017775
Yu, J. Y., & Kim, S. T. (2011). Relationships between extratropical sea level pressure variations and the Central Pacific and eastern Pacific types of ENSO. Journal of Climate, 24(3), 708–720. https://doi.org/10.1175/2010JCLI3688.1
Yu, J. Y., Lu, M. M., & Kim, S. T. (2012). A change in the relationship between tropical central Pacific SST variability and the extratropical atmosphere around 1990. Environmental Research Letters, 7(3). https://doi.org/10.1088/1748-9326/7/3/034025
Yu, L., Jin, X., & Weller, R. (2008). Multidecade globalflux datasets from the Objectively Analyzed Air-sea Fluxes (OAFlux) project: Latent and sensible heatfluxes, ocean evaporation, and related surface meteorological variables. OAFlux Project Technical Report. OA-2008-01 (64 pp.).