R E S E A R C H A R T I C L E
Open Access
The impact of age differences in couples on
depressive symptoms: evidence from the Korean
longitudinal study of aging (2006
–2012)
Jae-Hyun Kim
1,2, Eun-Cheol Park
2,3and Sang Gyu Lee
2,4*Abstract
Background: Depression represents one of the most common psychiatric disorders among older adults. Married couples are affected frequently, and psychiatric problems usually affect marital satisfaction. Despite the frequency of such relationships, it appears that very few studies have examined the issues that arise in couples of this type of marriage. Therefore, we investigate whether age differences between couples affect extent of depressive symptoms among older adults.
Methods: Our analysis included 2,881 couples (i.e., 2,881 households) at least 45 years of age at baseline (2006), in addition to 3,033 couples in 2008, 2,772 couples in 2010, and 2,711 couples in 2012. A generalized linear mixed model was used for the data analysis.
Results: When the age difference between husbands and wives was 3 years or less, the estimated severity of depressive symptoms was 0.309 higher (SE = 0.084, p = 0.000) than that of same-aged couples. When the age gap was 3 years or more, the estimated severity of depressive symptoms was 0.645 higher (SE = 0.109, p < .0001) than that of same-aged couples. For every 1–2 years extra in age difference between wives and husbands, the estimated severity of depressive symptoms increased by 0.194 (SE = 0.082, p = 0.018), compared with same-aged couples. Conclusions: Age differences between husbands and wives impact their relationship, including any particular marital issues encountered.
Keywords: Age differences, Couples, Depressive symptoms Background
Depression represents one of the most common psychi-atric disorders, with lifetime prevalence rates of 15% in males and 25% in female and is particularly prevalent among older adults [1].
As an important indicator of mental health, depression is associated closely with lower life satisfaction [2], ac-companied often by other mental disorders, physical pains and ailments [3], and burdensome economically [4]. Married couples are affected frequently, and psychi-atric problems usually affect marital satisfaction [5].
Numerous empirical studies have provided evidence for the protective effects of marriage on health: married individuals are more likely to be healthier than are widowed, divorced, separated, or never-married individ-uals [6,7]. Furthermore, married individindivid-uals live longer than unmarried individuals [8]. In addition, the impact of the age gap between couples-related studies have been conducted [9]. In United Kingdom, one study, represent-ing one of the first attempts to quantify the influence of spousal age gaps on mortality and longevity, concluded that “conformity to the social norm, of the man being older than his wives, is associated with relatively lower mortality for both parties”. In addition, in Iran, one study [10] about relationship did not found between age difference of couples and marital satisfaction and the maximum age difference between couples was 13 which seem to be culturally acceptable in Iran. Thus, age * Correspondence:leevan@yuhs.ac
2
Institute of Health Services Research, Yonsei University, Seoul, Republic of Korea
4
Department of Hospital management, Graduate School of Public Health, Yonsei University, Seoul, Republic of Korea
Full list of author information is available at the end of the article
© 2015 Kim et al.; licensee BioMed Central. This is an Open Access article distributed under the terms of the Creative Commons Attribution License (http://creativecommons.org/licenses/by/4.0), which permits unrestricted use, distribution, and reproduction in any medium, provided the original work is properly credited. The Creative Commons Public Domain Dedication waiver (http://creativecommons.org/publicdomain/zero/1.0/) applies to the data made available in this article, unless otherwise stated.
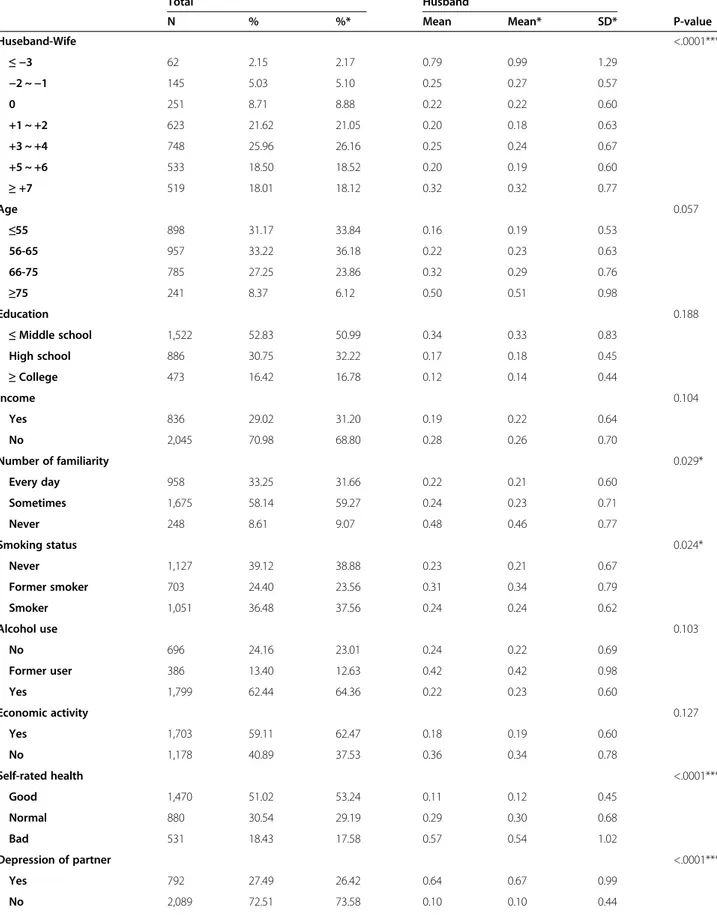
Table 1 General characteristics of age difference between husband and wife at baseline (2006)
Total Husband
N % %* Mean Mean* SD* P-value
Huseband-Wife <.0001*** ≤ −3 62 2.15 2.17 0.79 0.99 1.29 −2 ~ −1 145 5.03 5.10 0.25 0.27 0.57 0 251 8.71 8.88 0.22 0.22 0.60 +1 ~ +2 623 21.62 21.05 0.20 0.18 0.63 +3 ~ +4 748 25.96 26.16 0.25 0.24 0.67 +5 ~ +6 533 18.50 18.52 0.20 0.19 0.60 ≥ +7 519 18.01 18.12 0.32 0.32 0.77 Age 0.057 ≤55 898 31.17 33.84 0.16 0.19 0.53 56-65 957 33.22 36.18 0.22 0.23 0.63 66-75 785 27.25 23.86 0.32 0.29 0.76 ≥75 241 8.37 6.12 0.50 0.51 0.98 Education 0.188 ≤ Middle school 1,522 52.83 50.99 0.34 0.33 0.83 High school 886 30.75 32.22 0.17 0.18 0.45 ≥ College 473 16.42 16.78 0.12 0.14 0.44 Income 0.104 Yes 836 29.02 31.20 0.19 0.22 0.64 No 2,045 70.98 68.80 0.28 0.26 0.70 Number of familiarity 0.029* Every day 958 33.25 31.66 0.22 0.21 0.60 Sometimes 1,675 58.14 59.27 0.24 0.23 0.71 Never 248 8.61 9.07 0.48 0.46 0.77 Smoking status 0.024* Never 1,127 39.12 38.88 0.23 0.21 0.67 Former smoker 703 24.40 23.56 0.31 0.34 0.79 Smoker 1,051 36.48 37.56 0.24 0.24 0.62 Alcohol use 0.103 No 696 24.16 23.01 0.24 0.22 0.69 Former user 386 13.40 12.63 0.42 0.42 0.98 Yes 1,799 62.44 64.36 0.22 0.23 0.60 Economic activity 0.127 Yes 1,703 59.11 62.47 0.18 0.19 0.60 No 1,178 40.89 37.53 0.36 0.34 0.78 Self-rated health <.0001*** Good 1,470 51.02 53.24 0.11 0.12 0.45 Normal 880 30.54 29.19 0.29 0.30 0.68 Bad 531 18.43 17.58 0.57 0.54 1.02 Depression of partner <.0001*** Yes 792 27.49 26.42 0.64 0.67 0.99 No 2,089 72.51 73.58 0.10 0.10 0.44
difference cannot be considered as an effective factor in the patients’ marital satisfaction, family processes and social support in this population.
Differences from this norm, especially when extreme, were associated with higher mortality rates [11]. The re-searchers speculated that this might be driven by the particular personal characteristics of those who tend to form these unusual partnerships.
When investigating age-heterogamous relationships, re-searchers have paid particular attention to a number of predictors. Atkinson and Glass [12] attributed changes in this context to an increase in gender equality in Korea. As women become more equal in society, they are less likely to conform to traditional gender roles, therefore foregoing the marital norm in which the male is the older partner.
The importance of factors such as education have also been noted [13,14]. Education appears to play a key role in determining the likelihood that a woman will partici-pate in an age-heterogamous marriage. Social scientists have theorized that an increase in education may be asso-ciated with an increased tendency of women to enter het-erogeneous relationships [14]. This may be because highly educated women tend to marry later, thus lessening their pool of potential mates and increasing their likelihood of marrying someone younger, as well as to the possibility that they hold more liberal views on marriage.
Several studies have found that poor relationship quality has a greater impact upon wives than husbands [15]. An-other important issue concerns cross-spouse effects: the majority of research has focused on the influence of an in-dividual’s marital satisfaction levels on his or her own de-pressive symptoms. However, the marital satisfaction levels and depression status of wives and husbands are usually correlated [16]. Therefore, it is important to test for cross-spouse effects of marital satisfaction on depression.
Despite the frequency of such relationships, it appears that very few studies have examined the issues that arise in couples of this type of marriage. Although several stud-ies have explored the relationship between marital satisfac-tion and depression [17], very few that had adjusted for age differences involved older couples, and little is known about partner effects among older populations. Accord-ingly, factors associated with depression that affect marital satisfaction among older couples remain understudied.
Therefore, we purposed to investigate the relationship between age differences and depressive symptoms in couples in which both partners were at least 45 years of age.
Methods
Study sample and design
Data were obtained from the Korean Longitudinal Study of Aging (KLoSA), a nationwide survey of community-dwelling people at least 45 years of age (in 2006), analyzed using multistage stratified cluster sampling. Those results collected between the first and fourth wave of data collec-tion were used. The KLoSA is conducted by the Korea Labor Institute, which aims to devise and implement ef-fective social and economic policies addressing emerging trends in population aging. Additional waves of data col-lection are undertaken every even-numbered year. The original KLoSA study population comprised South Korean adults, at least 45 years of age, living in 15 large adminis-trative areas.
In the first baseline survey, conducted in 2006, 10,254 individuals among 6,171 households (1.7 per household) were interviewed using the Computer-Assisted Personal Interviewing method. A follow-up survey in 2008 com-prised 8,688 subjects, who represented 86.6% of the ori-ginal panel. The third survey in 2010 used 7,920 subjects, who represented 80.3% of the original panel. Finally, the fourth survey in 2012 involved 7,486 subjects, who repre-sented 76.2% of the original panel.
We restricted our population to married couples ex-periencing no change in marital status during the previ-ous 8 years and of these participants, we excluded 4,209 subjects that one of them (couples) did not respond to survey in 2006.
We additionally excluded 75 subjects who did not pro-vide the required information.
Our final analysis included 2,881 couples (i.e., 2,881 households) in whom both partners were at least 45 years of age during the 2006 baseline survey; 3,033 couples in 2008; 2,772 couples in 2010; and 2,711 couples in 2012. The KLoSA represents a national public database (http:// www.kli.re.kr/klosa/en/about/introduce.jsp), and open data that not included human material or human data. There-fore we don’t need to approve Institutional Review Board. Table 1 General characteristics of age difference between husband and wife at baseline (2006) (Continued)
Marital satisfaction 0.630 Low 83 2.88 2.79 0.49 0.52 0.57 Middle 1,341 46.55 46.96 0.29 0.28 0.76 High 1,457 50.57 50.25 0.20 0.21 0.60 Total 2,881 100.00 100.00 0.25 0.25 0.68 *p < .05; **p < .01, ***p < .001.
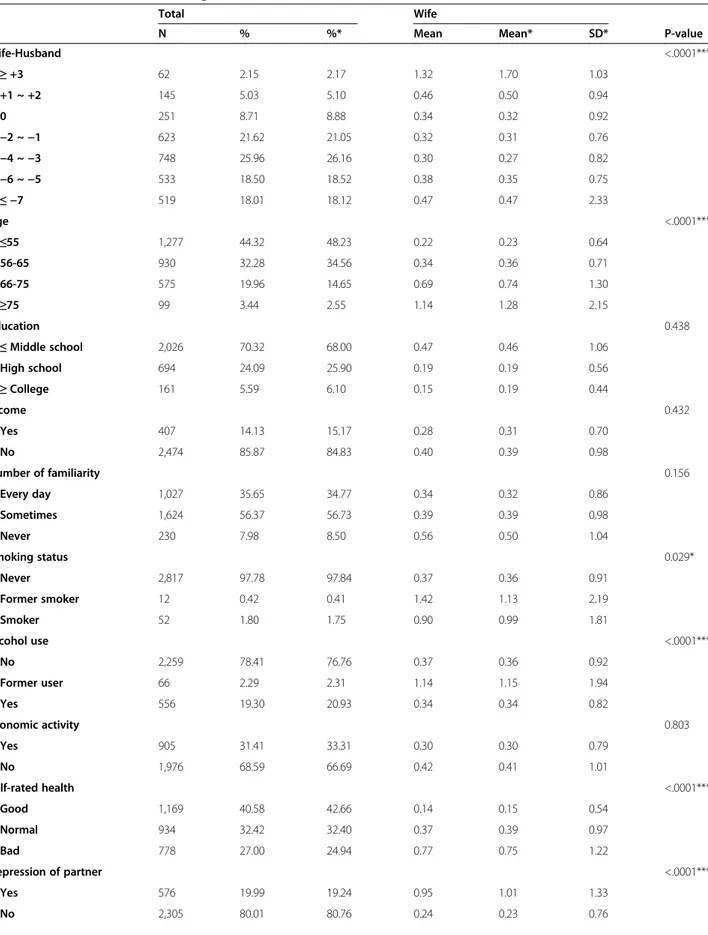
Table 2 General characteristics of age difference between wife and husband at baseline (2006)
Total Wife
N % %* Mean Mean* SD* P-value
Wife-Husband <.0001*** ≥ +3 62 2.15 2.17 1.32 1.70 1.03 +1 ~ +2 145 5.03 5.10 0.46 0.50 0.94 0 251 8.71 8.88 0.34 0.32 0.92 −2 ~ −1 623 21.62 21.05 0.32 0.31 0.76 −4 ~ −3 748 25.96 26.16 0.30 0.27 0.82 −6 ~ −5 533 18.50 18.52 0.38 0.35 0.75 ≤ −7 519 18.01 18.12 0.47 0.47 2.33 Age <.0001*** ≤55 1,277 44.32 48.23 0.22 0.23 0.64 56-65 930 32.28 34.56 0.34 0.36 0.71 66-75 575 19.96 14.65 0.69 0.74 1.30 ≥75 99 3.44 2.55 1.14 1.28 2.15 Education 0.438 ≤ Middle school 2,026 70.32 68.00 0.47 0.46 1.06 High school 694 24.09 25.90 0.19 0.19 0.56 ≥ College 161 5.59 6.10 0.15 0.19 0.44 Income 0.432 Yes 407 14.13 15.17 0.28 0.31 0.70 No 2,474 85.87 84.83 0.40 0.39 0.98 Number of familiarity 0.156 Every day 1,027 35.65 34.77 0.34 0.32 0.86 Sometimes 1,624 56.37 56.73 0.39 0.39 0.98 Never 230 7.98 8.50 0.56 0.50 1.04 Smoking status 0.029* Never 2,817 97.78 97.84 0.37 0.36 0.91 Former smoker 12 0.42 0.41 1.42 1.13 2.19 Smoker 52 1.80 1.75 0.90 0.99 1.81 Alcohol use <.0001*** No 2,259 78.41 76.76 0.37 0.36 0.92 Former user 66 2.29 2.31 1.14 1.15 1.94 Yes 556 19.30 20.93 0.34 0.34 0.82 Economic activity 0.803 Yes 905 31.41 33.31 0.30 0.30 0.79 No 1,976 68.59 66.69 0.42 0.41 1.01 Self-rated health <.0001*** Good 1,169 40.58 42.66 0.14 0.15 0.54 Normal 934 32.42 32.40 0.37 0.39 0.97 Bad 778 27.00 24.94 0.77 0.75 1.22 Depression of partner <.0001*** Yes 576 19.99 19.24 0.95 1.01 1.33 No 2,305 80.01 80.76 0.24 0.23 0.76
Control variables
Four age group categories were used as follows:≤ 55, 56– 65 66–75, and ≥ 75 years. Two employment status cat-egories,“yes” or “no”, were employed; the number of occa-sions on which couples socialized with friends during the past week was also recorded, according to the following three categories: everyday, sometimes, and never. Eco-nomic activity status was divided into two categories: employed and unemployed. Self-rated health was assessed with the question: “How do you usually perceive your health?” The response “very bad” or “bad” indicated “Bad”, and the response “normal”, “good”, or “very good” indi-cated “Good”, thus dichotomizing the response. Marital satisfaction was assessed with the question:“Are you satis-fied with the relationship with your spouse”? The response was ranked from lowest to highest and grouped into three groups (High, Middle, and Low) using the SAS Rank func-tion and the depression status of the partner (spouse ef-fect) were included as covariates in the analyses.
Depressive symptoms– CESD 10
Several depressive symptoms measurement tools exist, such as the Beck Depression Inventory and the Zung Self-Rating Depression Scale. The 20-item Center for Epidemiological Studies Depression Scale (CES-D), first used in the late 1970s [18], is renowned for its reliability and validity in the context of the general population and primary care patients [19].
The 10-item version of the CES-D (CESD-10), based on the work of Andresen et al., was extrapolated from the ori-ginal 20-item version by applying item–total correlations and eliminating redundant items [20]. CESD-10 score, the 10-item screening tool we used for depressive symptoms consist of 10 points for the 10-item version. The CES-D has proven to be a useful indicator of depression in older adults.
The CESD-10, which has demonstrated good predict-ive accuracy in comparison to the full-length 20-item version, assesses three factors: depressive effects (“the blues”, “depressed mood”, “fear”, and “loneliness”), som-atic retardation (“bothered”, “sleepy”, “go-getting”, and “attentive”) and positive effects (“happy” and “hopeful”). Depressive symptoms were assessed for 7 days prior to the interview. In this study, we treated depressive symp-toms as a continuous measure.
Analytical approach and statistics
Analysis of variance (ANOVA) and a generalized linear mixed model were used to investigate the impact of age differences between husbands and wives on depressive symptoms. For all analyses, p≤ 0.05 was taken to indi-cate statistical significance for two-tailed tests. All ana-lyses were conducted using the SAS statistical software package (ver 9.2; SAS Institute Inc., Cary, NC, USA).
Mixed effects model (SAS® Proc Mixed)
Mixed model was required in order to handle the unbal-anced data with correlated outcomes and missing data. In all mixed models presented, only the intercept was allowed to vary between subjects, and the regression slopes were assumed to be fixed effects; random inter-cept models were applied to our data.
A repeated-measurement model using Proc mixed pro-cedure was performed for this analysis. Depressive symp-toms as a continuous variable was the outcome in all mixed models. Covariates of interest from all subjects were added to the model to determine their effects on the increased depressive symptoms. To determine whether the increased depressive symptoms changed over time, we included time (year) in the model as a categorical covari-ate; the regression coefficient was used to estimate both the change in increased depressive symptoms and inde-pendent variables, annually.
Results
Tables 1 and 2 list the general characteristics of the hus-bands and wives, respectively (both at baseline [2006]; all characteristics were included as covariates).
Table 2 General characteristics of age difference between wife and husband at baseline (2006) (Continued)
Marital satisfaction 0.000** Low 167 5.80 5.59 0.68 0.69 1.13 Middle 1,513 52.52 53.30 0.46 0.46 1.08 High 1,201 41.69 41.11 0.24 0.23 0.68 Total 2,881 100.00 100.00 0.38 0.38 0.94 *p < .05; **p < .01, ***p < .001.
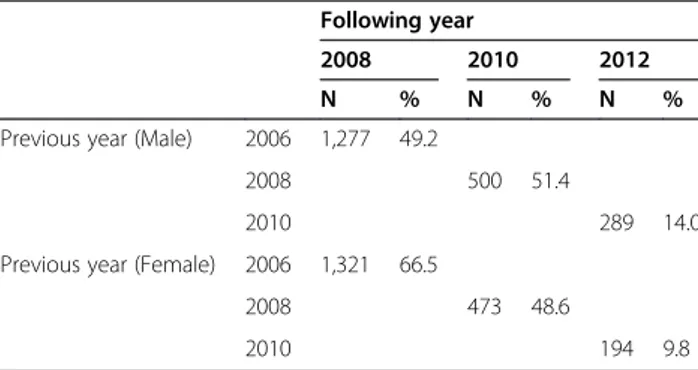
Table 3 Incidence in depressive symptoms compared with previous year for 4 years
Following year
2008 2010 2012
N % N % N %
Previous year (Male) 2006 1,277 49.2
2008 500 51.4
2010 289 14.0
Previous year (Female) 2006 1,321 66.5
2008 473 48.6
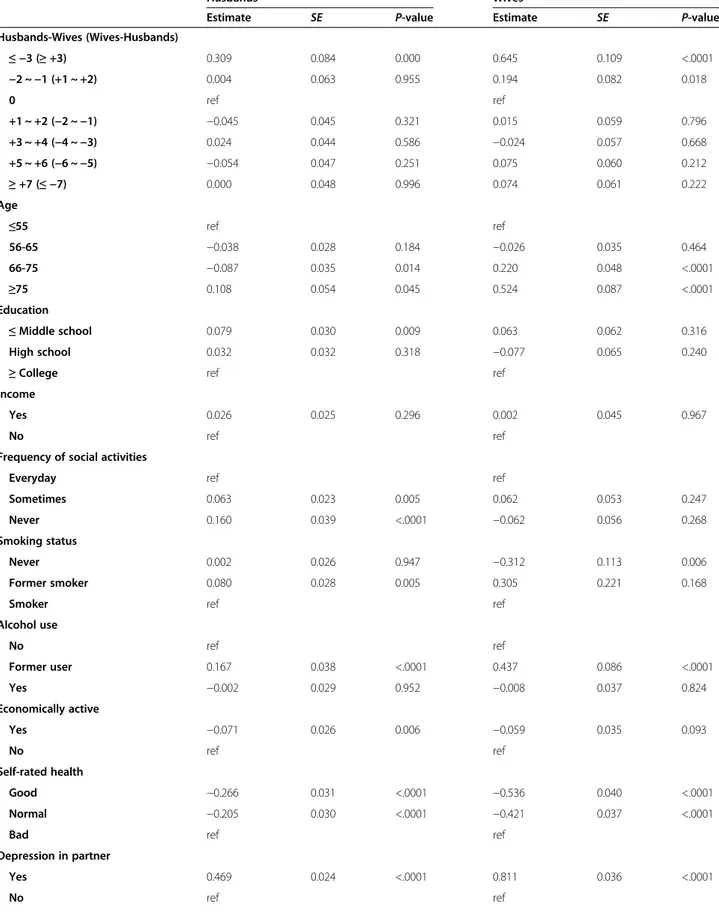
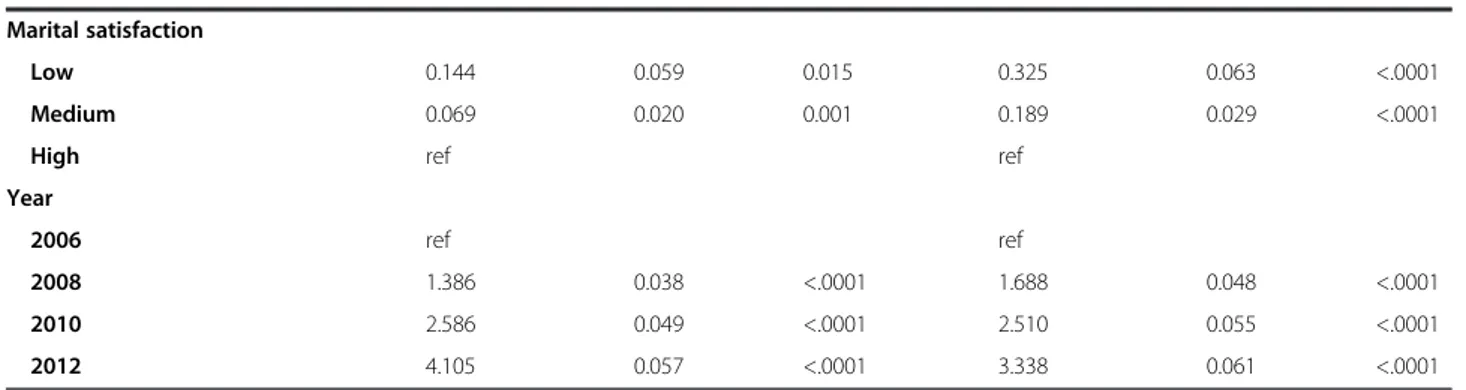
Table 4 Adjusted effect of study variables on depressive symptoms
Husbands Wives
Estimate SE P-value Estimate SE P-value
Husbands-Wives (Wives-Husbands) ≤ −3 (≥ +3) 0.309 0.084 0.000 0.645 0.109 <.0001 −2 ~ −1 (+1 ~ +2) 0.004 0.063 0.955 0.194 0.082 0.018 0 ref ref +1 ~ +2 (−2 ~ −1) −0.045 0.045 0.321 0.015 0.059 0.796 +3 ~ +4 (−4 ~ −3) 0.024 0.044 0.586 −0.024 0.057 0.668 +5 ~ +6 (−6 ~ −5) −0.054 0.047 0.251 0.075 0.060 0.212 ≥ +7 (≤ −7) 0.000 0.048 0.996 0.074 0.061 0.222 Age ≤55 ref ref 56-65 −0.038 0.028 0.184 −0.026 0.035 0.464 66-75 −0.087 0.035 0.014 0.220 0.048 <.0001 ≥75 0.108 0.054 0.045 0.524 0.087 <.0001 Education ≤ Middle school 0.079 0.030 0.009 0.063 0.062 0.316 High school 0.032 0.032 0.318 −0.077 0.065 0.240
≥ College ref ref
Income
Yes 0.026 0.025 0.296 0.002 0.045 0.967
No ref ref
Frequency of social activities
Everyday ref ref
Sometimes 0.063 0.023 0.005 0.062 0.053 0.247
Never 0.160 0.039 <.0001 −0.062 0.056 0.268
Smoking status
Never 0.002 0.026 0.947 −0.312 0.113 0.006
Former smoker 0.080 0.028 0.005 0.305 0.221 0.168
Smoker ref ref
Alcohol use No ref ref Former user 0.167 0.038 <.0001 0.437 0.086 <.0001 Yes −0.002 0.029 0.952 −0.008 0.037 0.824 Economically active Yes −0.071 0.026 0.006 −0.059 0.035 0.093 No ref ref Self-rated health Good −0.266 0.031 <.0001 −0.536 0.040 <.0001 Normal −0.205 0.030 <.0001 −0.421 0.037 <.0001
Bad ref ref
Depression in partner
Yes 0.469 0.024 <.0001 0.811 0.036 <.0001
Data from 2,881 couples at baseline were included. The weighted extent of depressive symptoms for couples with age differences of 3 years or less was 0.99 (n = 62 [2.17%], SD = 1.29). The weighted extent of depressive symptoms for same-aged couples was 0.22 (n = 251 [8.88%], SD = 0.60). The weighted extent of depressive symptoms for couples with age differences of 7 years or more was 0.32 (n = 519 [18.12%], SD = 0.77; Table 1). The weighted extent of depressive symptoms for couples with age differences of 3 years or more was 1.32 (n = 62 [2.17%], SD = 1.03) in wives and the weighted extent of depressive symptoms for same-aged couples was 0.34 (n = 251 [8.88%], SD = 0.92). The weighted extent of de-pressive symptoms for couples with age differences of 7 years or less, was 0.47 (n = 519 [18.12%)], SD = 2.33; (Table 2). According to our study, 1,277 males felt depres-sive symptoms (CES-D score≥ 1) in 2008 compared with subjects with no depressive symptoms (CES-D score = 0) in 2006 and 1,321 females felt depressive symptoms in 2008 compared with subjects with no depressive symp-toms in 2006 (Table 3).
Table 4 delineates the association between couples’ age differences and the severity of depressive symptoms. For couples with age differences of 3 years or less, the esti-mated severity of depressive symptoms was 0.309 higher (SE = 0.084, p = 0.000) than that of same-aged couples. For couples with age differences of 3 years or more, the estimated severity of depressive symptoms was 0.645 higher (SE = 0.109, p < 0.0001) than that of same-aged couples. For couples with age differences between 1 and 2 years, the estimated severity of depressive symptoms was 0.194 higher (SE = 0.082, p = 0.018) than that of same-aged couples.
Discussion
In this study, our primary purpose was to investigate the impact of age differences between couples on depressive symptoms among older adults, using longitudinal models derived from a nationally-representative sample of the general population of South Korea.
The results demonstrated that the age difference be-tween husbands and wives is associated with an increased depressive symptoms in those couples in which the wife is the older partner. Furthermore, the magnitude of depres-sion was higher in the wives compared with the husbands. These associations were independent of variables pertain-ing to sociodemographics (e.g., age, income status and economic activity status), health risks and behaviors (e.g., number of friends, smoking status, alcohol consumption patterns, and self-rated health), spouse effects, marital sat-isfaction, and the year in which the data were collected.
In most societies an age difference between the mem-bers of a couple is socially normative; typically, the male is older than the female [21]. However, established family dynamics have undergone rapid changes characterized, for example, by a weakening of traditional patriarchy [22]. The extent to which couples in whom the husband is con-siderably older than his wife are deemed acceptable varies cross-culturally, but relatively large age differences are fre-quent in patriarchal societies [21]. Greater age differences are often accompanied by concomitant differences in ma-turity, life experiences, social position and financial re-sources, which can render relationships inherently unequal and pose a source of risk for women’s health [23-26].
The age difference between married couples has re-mained relatively stable for several decades in many coun-tries, as noted by Klein [27]. Danish husbands on average are 3 years older than their wives [28]. While the mean age at marriage has increased by approximately 6 years during the twentieth century, especially since the end of the 1960s, the age difference between spouses increased only gradually in the first 50 years, up to the 1950s, but then decreased in the second half of the century [28].
To investigate age differences between couples, three separate theoretical concepts have been posited in recent decades. The most common concept is homogamy, or assortative mating, which presumes that individuals pre-disposed through cultural conditioning seek out and marry others like themselves. One assumption here is that a greater age difference is associated with greater Table 4 Adjusted effect of study variables on depressive symptoms (Continued)
Marital satisfaction
Low 0.144 0.059 0.015 0.325 0.063 <.0001
Medium 0.069 0.020 0.001 0.189 0.029 <.0001
High ref ref
Year
2006 ref ref
2008 1.386 0.038 <.0001 1.688 0.048 <.0001
2010 2.586 0.049 <.0001 2.510 0.055 <.0001
marital instability. A further prominent concept is that of the marriage squeeze, in which the supply and de-mand of partners forces individuals to broaden or nar-row their age range of acceptable partners. A third, and less common, concept is the double standard of aging, which assumes that males are generally less penalized for aging compared with females. This assumption is supported by the greater frequency of partnerships be-tween older males and younger females, and the much greater variability in the ages of males at the time of marriage compared with females [29].
The present results suggest that the wife as the older partner is detrimental for not only her husband, but also for herself. Moreover, controlling for additional covari-ates (e.g., self-rated health, depression status of the part-ner, and marital satisfaction) affects the magnitude of depressive symptoms for both husbands and wives; the number of friends did not exhibit an association, how-ever. Nevertheless, one reason cited for gender by age differences in depressive symptoms is social support. A large body of research indicates that women generally have more social contacts than men, but are less likely to be dependent on their social supports [28].
There were a number of strengths and limitations to this study. One strength is that the participants are likely to be representative of the overall population. Further-more, a large sample size was used, such that the results can be generalized to the general population of older adults in South Korea.
Nevertheless, we do acknowledge a possible sample bias: the respondents’ reports were subjective and poten-tially affected by false consciousness and recall bias; these data were also not corroborated using medical re-cords, due to the cost and scope of the work that would have entailed. However, our results also suggest that the potential issue of an insufficient length of partnership, to allow for inferences regarding the relationship between depressive symptoms and age gap, was not critical. Fi-nally, although our population was restricted to cases in which there had been no change in marital status for 7 years, the depressive effects of family bereavement (e.g., parents, sons and daughters) may also be a factor in depressive symptoms, but the present study did not directly address the time since widowhood.
Conclusion
The impact of age difference on the general relationship between husbands and wives and the specific issues that arise for couples were investigated. Several important is-sues were highlighted by our results. We must remain cognizant of the social stigma that still exists for mar-riages in which the age differential between the partners is not socially “normative”, and of the greater burden conferred by going against social conventions.
Competing interests
The authors declare that they have no competing interests.
Authors’ contributions
JH Kim, SG Lee carried out the acquisition of data, performed the experiments and participated in drafted the manuscript. EC Park participated in the design of the study and performed the statistical analysis. JH Kim, SG Lee conceived of the study, and participated in its design and coordination and helped to draft the manuscript. All authors read and approved the final manuscript.
Acknowledgement
We thank KB Yoo and JA Kwon who provided consideration of our manuscript on behalf of Department of public health.
Author details
1
Department of Public Health, Graduate School, Yonsei University, Seoul, Republic of Korea.2Institute of Health Services Research, Yonsei University,
Seoul, Republic of Korea.3Department of Preventive Medicine, Yonsei University College of Medicine, Seoul, Republic of Korea.4Department of
Hospital management, Graduate School of Public Health, Yonsei University, Seoul, Republic of Korea.
Received: 17 September 2014 Accepted: 15 January 2015
References
1. Sadock BJS. Kaplan and Sadock’s synopsis of psychiatry: Behavioral Sciences/ Clinical Psychiatry, 10th eds. Philadelphia: Lippincott Williams & Wilkins; 2007. 2. Tsuboi H, Kawamura N, Hori R, Kobayashi F, Iwasaki Y, Takeuchi H, et al.
Depressive symptoms and life satisfaction in elderly women are associated with natural killer cell number and cytotoxicity. Int J Behav Med. 2005;12(4):236–43.
3. Choi H, Marks NF. Marital Conflict, Depressive Symptoms, and Functional Impairment. J Marriage Fam. 2008;70(2):377–90.
4. Wang QR, Wang DH, Li CH, Miller RB. Marital satisfaction and depressive symptoms among Chinese older couples. Aging Ment Health. 2014;18(1):11–8. 5. Lundblad AM, Hansson K. Relational problems and psychiatric symptoms in
couple therapy. Int J Soc Welf. 2005;14(4):256–64.
6. Manzoli L, Villari P, MP G, Boccia A. Marital status and mortality in the elderly: a systematic review and meta-analysis. Soc Sci Med. 2007;64(1):77–94. 7. Williams K. The transition to widowhood and the social regulation of health:
consequences for health and health risk behavior. J Gerontol B Psychol Sci Soc Sci. 2004;59(6):S343–9.
8. Lillard LA, Panis CW. Marital status and mortality: the role of health. Demography. 1996;33(3):313–27.
9. Fox AJ, Bulusu L, Kinlen L.“Mortality and Age Differences in Marriage”. J Biosoc Sci. 1979;11:117–31.
10. Amiri S, Khousheh M, Ranjbar F, Fakhari A, Mohagheghi A, Farnam A, et al. Factors related to marital satisfaction in women with major depressive disorder. Iran J Psychiatry. 2012;7(4):164–9.
11. Rose CLBB. Predicting Longevity. Lexington: D. C. Heath and Company; 1971. 12. Atkinson MP, Glass BL. Marital age heterogamy and homogamy: 1900 to
1980. J Marriage Fam. 1985;47:685–91.
13. Bytheway WR. The variation with age of age differences in marriage. J Marriage Fam. 1981;43:923–7.
14. Shehan CL, Berardo FM, Vera H, Carley SM. Women in age-discrepant marriages. J Family Issues. 1991;12:291–305.
15. Kiecolt-Glaser JK, Glaser R, Cacioppo JT, Malarkey W. Marital stress: Immunologic, neuroendocrine, and autonomic correlatesa. Ann N Y Acad Sci. 1998;840(1):656–63.
16. Dehle C, Weiss RL. Sex differences in prospective associations between marital quality and depressed mood. J Marriage Fam. 1998;60(4):1002–11. 17. Pruchno R, Wilson-Genderson M, Cartwright FP. Depressive symptoms and
marital satisfaction in the context of chronic disease: a longitudinal dyadic analysis. J Fam Psychol. 2009;23(4):573–84.
18. LS R. The CES-D scale: a self-report depression scale for research in the general population. Appl Psychol Meas. 1977;1:385–401.
19. Fave GAPI, Perfederici A, Bernardi M, Pathak D. Depressive symptoms and abnormal illness behaviour in primary care patients. Gen Hosp Psychiatry. 1982;4:171–8.
20. Andresen EM, Malmgren JA, Carter WB, Patrick DL. Screening for depression in well older adults: evaluation of a short form of the CES-D (Center for Epidemiologic Studies Depression Scale). Am J Prev Med. 1994;10(2):77–84. 21. Ibisomi L. Is age difference between partners associated with contraceptive
use among married couples in Nigeria? Int Perspect Sex Reprod Health. 2014;40(1):39–45.
22. Lee Y. Conjugal Role Sharing on Women’s Marital Satisfaction. Popul Korea. 2010;33(1):103–31.
23. N L. Confronting the‘sugar daddy’ stereotype: age and economic asymmetries and risky sexual behavior in urban Kenya. Int Fam Plan Perspect. 2005;31(1):6–14.
24. Longfield K, Glick A, Waithaka M, Berman J. Relationships between older men and younger women: Implications for STIs/HIV in Kenya. Stud Fam Plann. 2004;35(2):125–34.
25. Jewkes RK, Levin JB, Penn-Kekana LA. Gender inequalities, intimate partner violence and HIV preventive practices: findings of a South African cross-sectional study. Soc Sci Med. 2003;56(1):125–34.
26. Casterline JB. WLaMP: The age difference between spouses: variations among developing countries. Popul Stud. 1986;40(3):353–74. 27. Klein T.“Der Altersunterschied Zwischen Ehepartnern. Ein Neues
Analysemodell” [Agedifferences between marital partners. A new analytic model]. Zeitschrift fuer Soziologie. 1996;25:346–70.
28. Drefahl S. How Does the Age Gap between Partners Affect Their Survival? Demography. 2010;47(2):313–26.
29. Berardo FM, Appel J, Berardo DH.“Age Dissimilar Marriages: Review and Assessment.”. J Aging Stud. 1993;7:93–106.
Submit your next manuscript to BioMed Central and take full advantage of:
• Convenient online submission
• Thorough peer review
• No space constraints or color figure charges
• Immediate publication on acceptance
• Inclusion in PubMed, CAS, Scopus and Google Scholar
• Research which is freely available for redistribution
Submit your manuscript at www.biomedcentral.com/submit