Molecules and Cells
Rapid Report
Accelerated Evolution of the Regulatory Sequences
of Brain Development in the Human Genome
Kang Seon Lee
1, Hyoeun Bang
1, Jung Kyoon Choi
1, and Kwoneel Kim
2,*
1
Department of Bio and Brain Engineering, Korea Advanced Institute of Science and Technology (KAIST), Daejeon 34141, Korea,
2
Department of Biology, Kyung Hee University, Seoul 02447, Korea
*Correspondence: [email protected] https://doi.org/10.14348/molcells.2020.2282 www.molcells.org
Received 20 November, 2019; revised 3 March, 2020; accepted 8 March, 2020; published online 31 March, 2020
eISSN: 0219-1032
©The Korean Society for Molecular and Cellular Biology. All rights reserved.
cc This is an open-access article distributed under the terms of the Creative Commons Attribution-NonCommercial-ShareAlike 3.0 Unported License. To view a copy of this license, visit http://creativecommons.org/licenses/by-nc-sa/3.0/.
Genetic modifications in noncoding regulatory regions are likely critical to human evolution. Human-accelerated noncoding elements are highly conserved noncoding regions among vertebrates but have large differences across humans, which implies human-specific regulatory potential. In this study, we found that human-accelerated noncoding elements were frequently coupled with DNase I hypersensitive sites (DHSs), together with monomethylated and trimethylated histone H3 lysine 4, which are active regulatory markers. This coupling was particularly pronounced in fetal brains relative to adult brains, non-brain fetal tissues, and embryonic stem cells. However, fetal brain DHSs were also specifically enriched in deeply conserved sequences, implying coexistence of universal maintenance and human-specific fitness in human brain development. We assessed whether this coexisting pattern was a general one by quantitatively measuring evolutionary rates of DHSs. As a result, fetal brain DHSs showed a mixed but distinct signature of regional conservation and outlier point acceleration as compared to other DHSs. This finding suggests that brain developmental sequences are selectively constrained in general, whereas specific nucleotides are under positive selection or constraint relaxation simultaneously. Hence, we hypothesize that human- or primate-specific changes to universally conserved regulatory codes of brain development may drive the accelerated, and most likely adaptive, evolution of the regulatory network of the human brain.
Keywords: brain evolution, chromatin interaction, fetal brain,
human accelerated region, ultra-conserved element
INTRODUCTION
In their seminal work almost 40 years ago, King and Wilson
(1975) proposed a key role for regulatory modifications of
noncoding DNA in shaping the evolution of our species. In-deed, the human genome was recently discovered to contain noncoding DNA segments that are conserved in other species and some of the sections showed evidence of lineage-specific
accelerated changes (Bird et al., 2007; Bush and Lahn, 2008;
Lindblad-Toh et al., 2011; Pollard et al., 2006; Prabhakar et
al., 2006). These DNA segments, known as
human-acceler-ated elements (HAEs), are genomic regions that are highly conserved throughout vertebrate evolution but are strikingly different across humans, suggesting a regulatory contribu-tion to human-specific traits. Most HAEs are located within noncoding DNA, which perform transcriptional regulatory functions in a specific manner such as promoters, enhancers, insulators, or silencers. The change of DNA sequence in this noncoding element affects the regulatory landscape of gene
expression by a loss of function or a gain of function (
Spiel-mann and Mundlos, 2016). Therefore, HAEs in noncoding
DNA elements have significant implications for regulatory
evolution for human specific traits (McLean et al., 2011).
func-Evolution of the Regulatory Sequences in Brain Development Kang Seon Lee et al.
tions has been obtained for only a few of these elements
(Kamm et al., 2013; Prabhakar et al., 2008). In contrast to
conserved sequences (Bejerano et al., 2004; Pennacchio et
al., 2006), it is difficult to systematically test the function of
human-acquired sequences in model organisms. Further-more, whether these changes are the outcomes of direction-al selection or neutrdirection-al fixation processes such as GC-biased
gene conversion remains uncertain (Duret and Galtier, 2009;
Katzman et al., 2010; Kostka et al., 2012; Lindblad-Toh
et al., 2011; Pollard et al., 2006; Prabhakar et al., 2009).
Epigenomic signatures can mark the location of functional elements and provide systematic information on the
spatio-temporal specificity of their regulatory activities (Maurano et
al., 2012). DNase I hypersensitive sites (DHSs), which are
ma-jor epigenetic signatures, are genomic regions that represent loose chromatin and thereby function as regulatory regions
by recruiting transcription factors (TFs) (Ernst et al., 2011).
The other crucial epigenetic signatures are histone modi-fications, in particular monomethylated and trimethylated histone H3 lysine 4 (H3K4me1 and H3K4me3, respectively), which imply transcriptional regulatory functions as promoters
and enhancers, respectively (Heintzman et al., 2009).
Long-range chromatin interaction controls gene expression within the noncoding fraction of the genome so that it represents
a large reservoir of gene regulatory networks (Hnisz et al.,
2013; Sandhu et al., 2012). A recent approach revealed that
human-accelerated regions show regulatory activity during neural development in an autism spectra disorder model
(Doan et al., 2016). However, evaluation of this regulatory
function was not based on experimental data as described above but on TF motifs with chromatin interactions only. In this study, we used a set of epigenetic data comprising transcriptional regulatory functions to validate the regulato-ry potential of HAEs. In contrast to previous studies which focused on individual experimental validation or sequential evolutionary implications for the functionality of HAEs, our approach was to perform a comprehensive analysis covering whole HAEs to unravel their regulatory function at the level of transcription.
MATERIALS AND METHODS
Collection and processing of previously identified HAEs
Previously identified HAEs comprising 992
human-acceler-ated noncoding sequences (Prabhakar et al., 2006), 202
human-accelerated regions (Pollard et al., 2006), 1,356
ac-celerated noncoding sequences (Bird et al., 2007), 63 human
terminal branch elements (Bush and Lahn, 2008), and 563
human-accelerated regions (Lindblad-Toh et al., 2011) were
obtained and transferred over to human reference genome version hg19. Overlapping regions were merged, resulting in 2,745 unique HAEs.
Collection and processing of DHS data
Fourteen datasets of fetal brain DHSs generated as part of the National Institutes of Health (NIH) Roadmap Epigenom-ics project were obtained from http://www.ncbi.nlm.nih. gov/geo/query/acc.cgi?acc=GSE18927. The datasets were GSM1027328, GSM530651, GSM595913, GSM595920,
GSM595922, GSM595923, GSM595926, GSM595928, GSM665804, GSM665819, GSM723021, GSM878650, GSM878651, and GSM878652, covering post-conception days 85, 96, 101, 104, 105, 109, 112, 117, 122, and 142. Data from the same donors were combined. Other than the brain, DHS data for 10 fetal tissues, namely the spinal cord, gastrointestinal (GI) tract, heart, kidney, lung, muscle, placen-ta, spleen, thymus, and adrenal gland were obtained from the NIH Roadmap Epigenomics data portal (http://www. roadmapepigenomics.org/data). Samples that matched the age of the brain donors were selected (five spinal cord, seven GI tract, four heart, six kidney, five lung, five muscle, two placenta, one spleen, five thymus, and one adrenal gland). The following is the list of accession numbers for the non-brain fetal tissue DHS data used in this work: GSM701487, GSM701514, GSM774202, GSM774214, GSM774225, GSM774228, GSM774233, GSM530654, GSM665824, GSM665830, GSM774203, GSM530655, GSM665810, GSM665816, GSM665822, GSM701515, GSM701529, GSM530656, GSM530662, GSM595924, GSM595927, GSM665808, GSM817189, GSM1027308, GSM878661, GSM878663, GSM1027339, GSM701506, GSM701535, GSM774223, GSM774226, GSM774234, GSM774215, GSM774219, GSM701509, GSM665823, GSM701497, GSM701513, GSM701537, GSM774204, and GSM530653. DHS data for H1-embryonic stem cells (ESCs), H7-ESCs, H9-ESCs, and induced pluripotent stem cells (iPSCs) were obtained from the ENCODE track of the UCSC Genome Browser (https://genome.ucsc.edu/ENCODE/). Thirteen DHS datasets for postnatal brains, eleven from adults (NH-A, HA-h, HAc, frontal cortex, cerebrum frontal, cerebellum, BE2-C, SK-N-MC, SK-N-SH, SK-N-SH-RA, and gliobla) and two from infants (Medullo and Medullo_D341), were obtained from the ENCODE track of the UCSC Genome Browser. Thirteen ENCODE DHS datasets for non-brain adult-derived cells, namely K562, small intestine, colon, skin fibroblast, pan-creatic islets, A549, kidney, HepG2, airway epithelial cells, MCF-7, GM12878, HeLa-S3, and cardiac myocytes were also obtained. The HOMER software package (http://homer.salk. edu/homer/ngs/) was run with the “-style factor” option to identify DHS peaks. Chromosomal coordinates of the DHS peaks were used for subsequent analyses. For the five DHS groups (fetal brain, non-brain fetal tissues, non-brain adult cells, adult brain, and ESCs), DHS peaks from samples in each category were combined into unique merged peaks.
Collection and processing of histone modification data
Eleven datasets for histone modifications in brain samples with fetal and adult origins (fetal brain, germinal matrix, neurosphere ganglionic eminence-derived, neurosphere cortex-derived, substantia nigra, mid frontal lobe, inferior temporal lobe, hippocampus middle, cingulate gyrus, anteri-or caudate, and angular gyrus) were obtained from the NIH Roadmap Epigenomics data portal. Seven different histone modifications, i.e., H3K4me1, H3K4me3, H3K27me3, H3K-9ac, H3K36me3, H3K9me3, and H3K27ac were included. The Roadmap data for 16 histone modifications in H1-ESCs, H1-ESC-derived mesenchymal stem cells, and H1-ESC-de-rived neuroprogenitor cells were also obtained. HOMER was
Evolution of the Regulatory Sequences in Brain Development Kang Seon Lee et al.
run with the “-style histone” option to identify histone
mod-ification peaks. The chromosomal coordinates of the histone modification peaks were used for subsequent analyses.
Calculating the frequency of HAE or ultra-conserved ele-ment (UCE) overlapping
We overlapped the HAEs and UCEs with the DHS peaks and histone modification peaks using the intersectBed command in BedTools. The number of DHS peaks or histone modifica-tion peaks that overlapped with HAEs or UCEs was divided by the total number of DHSs or histone modifications peaks in the given sample, respectively. If the small number of over-lapped peaks was too small as compared to the total number of peaks, the overlapping ratio was multiplied by 10,000 to
adjust for “overlaps per 104
DHSs” or “overlaps per histone modification”. By using the shuffle command in BedTools, the same number of DNA segments with the same size distribu-tion as the HAEs or UCEs was randomly captured from each chromosome to generate a false set of HAEs and UCEs. The frequency of DHS overlapping was obtained repeatedly for a set of 1,000 random HAEs and UCEs in the same manner.
Lineage-specific acceleration of DHS sequences
Lineage-specific acceleration was estimated from the DNA
sequences of the DHSs. First, phyloP19
was run to assess the evolutionary significance of base substitutions in the human lineage by using the subtree option and the neutral tree model for the primate subset. The Multiz alignment file and primate neutral model were obtained from the UCSC
Ge-nome Browser. The number of significantly (P < 5.0 × 10⁻⁴)
accelerated nucleotides was divided by the total number of nucleotides contained in all DHSs in a given set (one of the five cell-type groups) and then multiplied by one million, leading to an acceleration estimate as the number of signif-icant base substitutions per Mb. The primate subtree with the mammalian neutral model and the subtree of placental mammals with the vertebrate neutral model were used to es-timate primate-specific and mammalian-specific acceleration, respectively. The Multiz alignment file and the neutral tree models were obtained from the UCSC Genome Browser.
Mixed conservation and acceleration of DHS sequences
For each DHS, regional conservation was measured as the
average phastCons24 score for the bases contained in an
en-tire DHS region. The minimum (negative) phyloP19
score was used as an estimate of outlier point acceleration for each DHS region. The estimates of regional conservation and outlier acceleration were obtained by using the pre-calculated base-by-base scores for the primate clade, which are available in the UCSC Genome Browser. Relative point acceleration was computed by multiplying the regional conservation score and the outlier point acceleration measure for each DHS. We used phastCons and phyloP for the above purposes respec-tively, because phastCons estimates the probability that each nucleotide belongs to a conserved element (ranging between 0 and 1) whereas phyloP measures conservation (positive scores) and acceleration (negative scores) separately at indi-vidual nucleotides and ignores the effects of their neighbors.
Analysis of gene expression in developing brains
Normalized reads per kilobase per million (RPKM) expres-sion values from the RNA-seq data of 578 developing brain samples spanning 13 developmental stages were obtained from http://www.brainspan.org (RNA-Seq Gencode v3c summarized to genes). The expression values for samples from subjects of the same age and from the same area of the brain were averaged. Mean centering of the gene vector was performed before plotting the expression levels of thyroid hormone receptor beta (THRB) and snail family transcription-al repressor 2 (SNAI2).
Identification of TF motifs
A total of 379 TF motifs from the transcription factor data-base (TRANSFAC) and 26 additional motifs from the JASPAR database were obtained, leading to 405 unique motifs in Homo sapiens. The FIMO search tool (http://meme-suite.org/ doc/fimo.html?man_type=web) was used to search for
with-in-DHS motifs at the threshold P value of 10–5.
RESULTS
Significant association of HAEs with epigenomic signa-tures
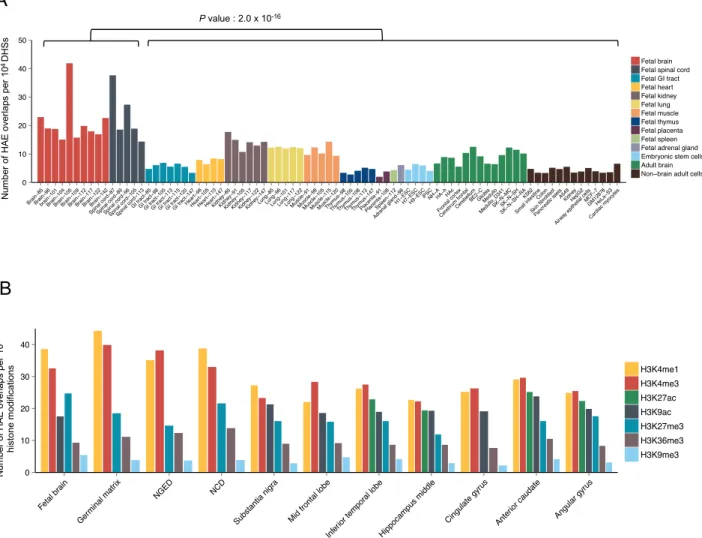
To obtain a comprehensive landscape of epigenomic sig-natures for unraveling regulatory potential of whole HAEs, we compiled 2,745 HAEs and overlapped them with DHSs with different developmental tissues from different origins. Sixty-six percent of the HAEs coincided with the examined
DHSs (Supplementary Fig. S1). Remarkably, the mean
fre-quency of overlaps between HAEs and DHSs across fetal brains and spinal cords was higher than the mean frequency of overlaps across adult brains, non-brain fetal tissues, ESCs,
and non-brain adult cells (Fig. 1A, Supplementary Figs. S2
and S3, Supplementary Table S1). The observed variations
among samples with the same tissue origins (Fig. 1A) may
have resulted from experimental errors or may reflect variable biological features of the sample donors. The higher number of fetal brain DHSs that overlapped with HAEs compared to adult brain DHSs indicates that human-specific evolutionary pressure would have led to the evolution of functional reg-ulatory circuitry during human brain development. In addi-tion, the HAEs were highly enriched in the histone markers
H3K4me1 and H3K4me3 across different brain samples (Fig.
1B, Supplementary Table S2), which implies they function
as active enhancers and active promoters, respectively. Spe-cifically, the mean overlap frequency of HAEs with histone markers of H3K4me1 and H3K4me3 in fetal brains was
high-er than those in adult brains (Supplementary Fig. S4). These
results imply that HAEs have functional potential, which is explicitly associated with fetal brains.
Human-specific regulatory evolution of fetal brain DHSs
The HAEs were analyzed to determine whether they are under specific evolutionary pressure in the context of their functional implications. To provide a unified and quantitative measure of human-specific regulatory evolution, we comput-ed the sequence acceleration because the divergence of hu-mans and chimpanzees is based on a primate neutral model
Evolution of the Regulatory Sequences in Brain Development Kang Seon Lee et al.
(Pollard et al., 2010). We then examined how much each
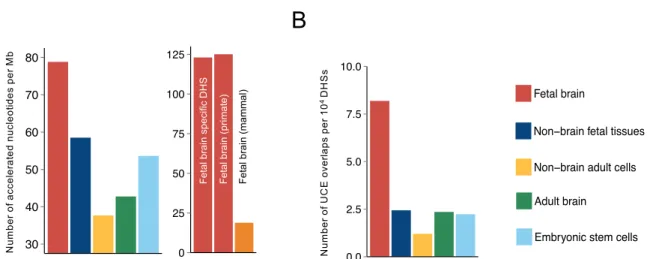
DHS deviated evolutionarily from chimpanzees to humans by calculating the frequency of significantly accelerated nu-cleotides for the relevant DHS. The calculated frequency was highest in fetal brain DHSs among DHSs with other tissue
ori-gins (Fig. 2A, left) and was particularly high in DNA segments
accessible only in fetal brains (Fig. 2A, right). A similar
mag-nitude of primate-specific acceleration and no considerable evidence supporting acceleration in the mammalian clade
were found (Fig. 2A, right), implying that most changes to
the brain developmental sequences occurred after the split of primates and humans from other mammalian lineages. One of the biggest differences between primates and mammals is
the size of the brain (DeCasien et al., 2017). Primates
includ-ing humans have relatively large brain sizes (neocortex and cerebellum), as compared to other mammals, which results
in the higher intelligence of primates (Barton and Venditti,
2014). Also, the higher relative cortex volume and neuron
packing density of primates allow for more cortical neurons
than other mammals with the same brain size (Roth, 2015).
The accelerated nucleotides which we examined are report-ed to be relatreport-ed to the function of transcriptional enhancers during nervous system development and to genes associated with unique human features, such as complex language
(Caporale et al., 2019; Kamm et al., 2013). From this
per-spective, our analyses and the supporting studies indicate that fetal brain DHSs are under human-specific evolutionary pressure in the context of brain development.
Coexistence of conservation and human-specific evolution in regulating brain development
We also hypothesized that regulatory regions of fetal brain could have evolutionarily conserved signatures due to their
universal importance in brain development (Lu et al., 2019).
Meanwhile, we identified UCEs in the human genome (
Be-jerano et al., 2004; Dimitrieva and Bucher, 2013), which
Figure 1
A
0 10 20 30 40 Fetal br ainGerminal matr ix
NGED NCD Substantia nigr
a
Mid frontal lobe Inferior tempor
al lobe Hippocampus middle Cingulate gyr us Anter ior caudate Angular gyr us Frequency of HAS o ver laping Histone H3K4me1 H3K4me3 H3K27ac H3K9ac H3K27me3 H3K36me3 H3K9me3 0 10 20 30 40 Fetal br ain
Germinal matr ix
NGED NCD
Substantia nigr a
Mid frontal lobe Inferior tempor
al lobe Hippocampus middle Cingulate gyr us Anter ior caudate Angular gyr us Frequency of HAS o ver laping Histone H3K4me1 H3K4me3 H3K27ac H3K9ac H3K27me3 H3K36me3 H3K9me3 0 10 20 30 40 50 Brain −85 Brain −96 brain −101 Brain −104 Brain −105 Brain −109 Brain −112 Brain −117 Brain −122 Brain −142 Spinal cord −87 Spinal cord −89 Spinal cord −96 Spinal cord −105 Spinal cord −113 GI tract −85 GI tract −98 GI tract −105 GI tract −113 GI tract −115 GI tract −120 GI tract −147 Hear t−96 Hear t−105 Hear t−110 Hear t−147 Kidne y−85 Kidne y−91 Kidne y−105 Kidne y−117 Kidne y−122 Kidne y−147 Lung −85 Lung −96 Lung −101 Lung −117 Lung −122 Muscle −91 Muscle −98 Muscle −105 Muscle −115 Muscle −120 Thym us−98 Thym us−105 Thym us−108 Thym us−113 Thym us−147 Placenta −91 Placenta −108 Spleen −112 Adrenal gland −96 H1−ESCH7−ESCH9−ESCiPSCNH
−A HA−hHAc Frontal cor tex Cerebr
um frontalCerebellumBE2 −C Gliob la Medullo Medullo_D341SK −NSK−MC−N−SH SK−N −SH−RAK562 Small intestine Colon Skin fibrob last Pancreatic islets A549Kidne y HepG2 Airway epithelial cells
MCF −7 GM12878HeLa −S3 Cardiac m yocytes Frequency of HAS o ver laping 0 10 20 30 40 50
BrainBrain−85brain−96 −101 Brain −104 Brain −105 Brain −109 Brain −112 Brain −117 Brain −122 Brain −142 Spinal cord −87 Spinal cord −89 Spinal cord −96 Spinal cord −105 Spinal cord −113 GI tract −85 GI tract −98 GI tract −105 GI tract −113 GI tract −115 GI tract −120 GI tract −147 Hear t−96 Hear t−105 Hear t−110 Hear t−147 Kidne y−85 Kidne y−91 Kidne y−105 Kidne y−117 Kidne y−122 Kidne
y−Lung147Lung−85−96 Lung −101 Lung −117 Lung −122 Muscle −91 Muscle −98 Muscle −105 Muscle −115 Muscle −120 Thym us−98 Thym us−105 Thym us−108 Thym us−113 Thym us−147 Placenta −91 Placenta −108 Spleen −112 Adrenal gland −96 H1−ESCH7−ESCH9−ESCiPSCNH
−AHA−hHAc Frontal cor tex Cerebr
um frontalCerebellumBE2 −C GliobMedullola Medullo_D341SK −NSK−MC−N−SH SK−N −SH−RAK562 Small intestine Colon Skin fibrob last Pancreatic islets A549Kidne y HepG2 Airway epithelial cells
MCFGM12878−7HeLa−S3 Cardiac m yocytes Frequency of HAS o ver laping Fetal brain Fetal spinal cord Fetal GI tract Fetal heart Fetal kidney Fetal lung Fetal muscle Fetal thymus Fetal placenta Fetal spleen Fetal adrenal gland Embryonic stem cells Adult brain Non−brain adult cells
N um be r o f H AE o ve rla ps p er 1 0 4 DHS s N um be r o f H AE o ve rla ps p er 1 0 4 hi st on e m od ifi ca tio ns
B
P value : 2.0 x 10⁻¹⁶Fig. 1. Epigenetic interpretation of pre-defined human-accelerated regions. (A) The number of HAE overlaps per 104 DHSs in each
tissue or cell type. The fetal samples are ordered by the age of the donor (days after conception). P values were derived from two-tailed
Student’s t-tests. (B) The number of HAE overlaps per 104 peaks of each histone modification in developing brains (left four) and adult
brains. The second and third categories from the left are neurosphere ganglionic eminence-derived (NGED) and neurosphere
cortex-derived (NCD) samples, respectively. The zero values for H3K27ac in the first six bars in Fig. 1B do not indicate less overlap, but indicate
Evolution of the Regulatory Sequences in Brain Development Kang Seon Lee et al.
indicate highly conserved genomics regions across multiple species, by filtering out overlapping HAEs and mapping them to DHSs with different tissue origins. Paradoxically, fetal brain DHSs were highly enriched not only in HAEs but also in UCEs
(Fig. 2B, Supplementary Fig. S5). For example, we discovered
a fetal brain DHS containing an HAE and a UCE together
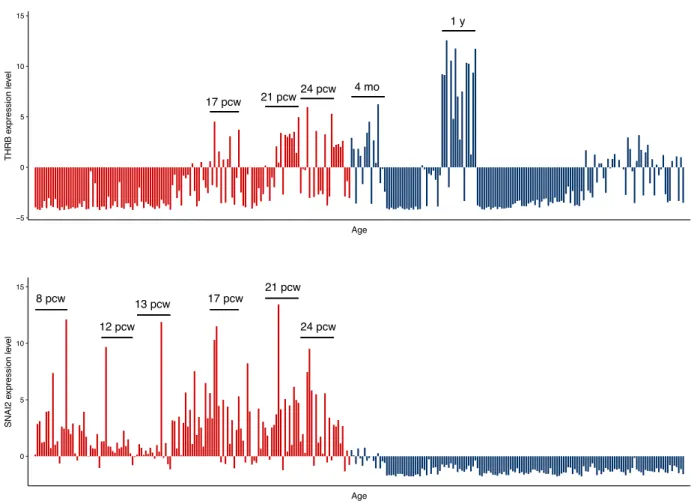
(Fig. 3). Two TF-binding motifs, one for THRB (P value: 7.0 ×
10-7) in the HAE and the other for SNAI2 (P value: 4.0 × 10⁻⁶)
in the UCE, were identified as the most significantly enriched motifs. This region was accessible in all fetal brain samples as well as in samples from 2- and 3-year-old medulloblas-toma patients but not in any adult brain samples. Although SNAI2 is expressed throughout the prenatal period, THRB is specifically expressed in the mid- and late-prenatal stages
and during early infancy (Fig. 4), in agreement with the role
of thyroid hormone during early brain development (
Mor-reale de Escobar et al., 2004). Fetal brain DHSs significantly
interacted with the promoter of the nearest gene FAXC,
which was located 163 kb away (Fig. 3A). Mutations in the
Drosophila homolog of FAXC cause failed axon connections
(Hill et al., 1995). The proximal DHS of FAXC is also accessible
in fetal brains and is in linkage disequilibrium with an SNP (rs2132683) that is a strong genetic determinant of brain
structure (Stein et al., 2010). Therefore, the constitutive and
developmental stage-specific regulation of FAXC by SNAI2 and THRB may contribute to conserved and human-specific axon connections, respectively, during brain structural devel-opment. Finding that HAEs and UCEs coexist on the same DHSs indicates the high variability of sequence conservation across a developing brain DHS.
High relative point acceleration of fetal brains
To assess whether this was a general pattern, we measured evolutionary conservation of the DNA sequences of all DHSs based on multiple alignments in primates. The degree of se-lective constraint over an entire DHS region, or the regional conservation, was estimated as the average phastCons score
(Siepel et al., 2005) for all nucleotides in a given region. On
the contrary, the magnitude of primate acceleration was
measured based on the phyloP score (Pollard et al., 2010) of
the most accelerated nucleotide in a given DHS region and was termed “outlier point acceleration.” Fetal brain DHSs
showed the highest levels of regional conservation (Fig. 5A)
and outlier point acceleration (Fig. 5B) simultaneously,
sug-gesting that DNA sequences that regulate brain development were selectively constrained in general but that particular nu-cleotides also underwent positive selection or constraint re-laxation at the same time. Regulatory sequences in the adult
brain also showed accelerated signatures (Fig. 5B), but their
conservation levels were low (Fig. 5A). We estimated the
relative functional importance of accelerated substitutions by considering the conservation level of background sequences for each DHS region (see Materials and Methods section). This measure, termed “relative point acceleration,” was
highest for fetal brains and lowest for adult brains (Fig. 5C).
In other words, sequence substitutions in adult brain DHSs generally occurred in less-constrained regions, suggesting that relaxed constraints rather than positive selection likely re-sulted in point acceleration. Meanwhile, the DNA sequences
of non-brain fetal DHSs were relatively well conserved (Fig.
5A); however, the relative point acceleration levels were high
(Fig. 5C), which likely explains the relatively high acceleration
of kidney, lung, and muscle DHSs (Figs. 1A and 2A). Taken
together, the regulatory sequences in developing brains are subject to strong evolutionary constraint with outlier point acceleration, which highlight the functional potential of these sequence changes.
DISCUSSION
The regulatory implications of human-accelerated noncoding elements have remained largely unexplored, despite their po-tential to reveal molecular mechanisms underlying human-ac-quired traits. The main focus of previous studies has been to identify sequence features that can distinguish between pos-itive selection and biased gene conversion, which promotes
Figure 2
A
B
30 40 50 60 70 80 Number of human −acceler ated n ucleotides per Mb 0 25 50 75 100 125 Fet al br ai n (m am m al ) Fet al br ai n (pr im at e) Fet al br ai n spec ifi c D H S N um ber of ac cel er at ed nuc leot ides per M b 0.0 2.5 5.0 7.5 10.0 Frequency of DHS o ver laping N um ber of U C E ov er laps per 10 4 DHS s0.28
0.30
0.32
0.34
0.36
Relativ
e point acceler
ation
Fetal brain Non−brain fetal tissues Non−brain adult cells Adult brain Embryonic stem cells Fetal brain (mammal) Fetal brain (vertebrate)
0.28
0.30
0.32
0.34
0.36
Relativ
e point acceler
ation
Fetal brain Non−brain fetal tissues Non−brain adult cells Adult brain Embryonic stem cells Fetal brain (mammal) Fetal brain (vertebrate)
0.28
0.30
0.32
0.34
0.36
Relativ
e point acceler
ation
Fetal brain Non−brain fetal tissues Non−brain adult cells Adult brain Embryonic stem cells Fetal brain (mammal) Fetal brain (vertebrate)
0.28
0.30
0.32
0.34
0.36
Relativ
e point acceler
ation
Fetal brain Non−brain fetal tissues Non−brain adult cells Adult brain Embryonic stem cells Fetal brain (mammal) Fetal brain (vertebrate)
0.28
0.30
0.32
0.34
0.36
Relativ
e point acceler
ation
Fetal brain Non−brain fetal tissues Non−brain adult cells Adult brain Embryonic stem cells Fetal brain (mammal) Fetal brain (vertebrate)
Fig. 2. Enrichment of evolutionary signatures in DHS sequences. (A) The frequency of human-accelerated (P < 5.0 × 10⁻⁴
) nucleotides in the DHSs with different origins (left) compared with that of human-accelerated nucleotides in fetal brain-specific DHS segments,
primate-specific accelerated nucleotides, and mammal-primate-specific accelerated nucleotides (right). (B) The number of UCE overlaps per 104
Evolution of the Regulatory Sequences in Brain Development Kang Seon Lee et al.
−1.0 −0.5 0.0 0.5 1.0 99633071 99633171 99633271 99633371 99633471 99633571 99633671 99633771 99633871 99633971 99634071 99634171 Alignment position Ph yloP score −1.0 −0.5 0.0 0.5 score T T TC C CTCATACGAG GTCAC TGCAC C TGC
Ultraconserved element Human-accelerated element
SNAI2 THRB
Figure 3
A
B
Fetal brain DHS
Fig. 3. Transcriptional regulation of coexistence of UCE and HAE in fetal brain DHS region. (A) Chromatin-interaction landscape
between a fetal brain DHS containing an HAE and UCE and the promoter of FAXC in dorsolateral prefrontal cortex tissue. Hi-C interaction
frequency maps were plotted using the 3DIV database, available at http://kobic.kr/3div/ (Yang et al., 2018). The location of the fetal brain
DHS is indicated by the red dot. The green line indicates the cut-off for the distance-normalized interaction frequency. (B) A brain DHS that contains an HAE and UCE simultaneously and that is active only during prenatal periods and early infancy. Shown are the locations of the HAE and UCE, primate phastCons (sky blue) and phyloP (blue for conservation and red for acceleration) scores, SNAI2 and THRB binding motifs, and the frequency of each base among primates with the human reference sequences at the bottom. For the two motifs,
THRB was identified as a single motif with statistical significance (P value: 7.0 × 10⁻⁷
) and SNAI2 showed the highest statistical significance
Mol. Cells 2020; 43(4): 331-339 337 Evolution of the Regulatory Sequences in Brain Development Kang Seon Lee et al.
Fig. 5. Evolutionary patterns of DHS sequences. (A) Regional conservation (average phastCons score) in the primate clade for the DHSs
with different origins. (B) Outlier point acceleration (minimum phyloP score) in the primate clade for the DHSs with different origins. (C) Relative point acceleration (combined phastCons and phyloP scores) in the primate and mammalian clades. All data are represented as mean ± SD; P values were derived from two-tailed Student’s t-tests. **P ≤ 0.0005, ***P ≤ 0.00005.
Figure 5
A
B
C
0.28
0.30
0.32
0.34
0.36
Relativ
e point acceler
ation
Fetal brain Non−brain fetal tissues Non−brain adult cells Adult brain Embryonic stem cells Fetal brain (mammal) Fetal brain (vertebrate)
0.28
0.30
0.32
0.34
0.36
Relativ
e point acceler
ation
Fetal brain Non−brain fetal tissues Non−brain adult cells Adult brain Embryonic stem cells Fetal brain (mammal) Fetal brain (vertebrate)
0.28
0.30
0.32
0.34
0.36
Relativ
e point acceler
ation
Fetal brain Non−brain fetal tissues Non−brain adult cells Adult brain Embryonic stem cells Fetal brain (mammal) Fetal brain (vertebrate)
0.28
0.30
0.32
0.34
0.36
e point acceler
ation
Fetal brain Non−brain fetal tissues Non−brain adult cells Adult brain Embryonic stem cells Fetal brain (mammal) Fetal brain (vertebrate)
0.28
0.30
0.32
0.34
0.36
Relativ
e point acceler
ation
Fetal brain Non−brain fetal tissues Non−brain adult cells Adult brain Embryonic stem cells Fetal brain (mammal) Fetal brain (vertebrate) 0.136 0.140 0.144 0.148 Regional conser vation ** *** *** *** −2.8 −2.7 −2.6
Outlier point acceler
ation *** *** ** ** Fetal br ain (mammal) −0.36 −0.34 −0.32 −0.30 Relativ e point acceler ation Fet al br ai n (m am m al ) ** *** *** ** ***
Fig. 4. RPKM expression values for THRB (top) and SNAI2 (bottom) are plotted according to the age of the donor and the sub-region
of the brain. Prenatal and postnatal gene expression values are shown in red and blue, respectively (pcw, post-conception week; mo,
months; y, years). 8 pcw 12 pcw 13 pcw 17 pcw 21 pcw 24 pcw 0 5 10 15 Age SNAI2 e xpression le vel 17 pcw 21 pcw 24 pcw 4 mo 1 y −5 0 5 10 15 Age THRB e xpression le vel
Figure 4
Evolution of the Regulatory Sequences in Brain Development Kang Seon Lee et al.
the fixation of neutral or weakly deleterious mutations at
recombination hotspots (Duret and Galtier, 2009; Katzman
et al., 2010; Kostka et al., 2012; Lindblad-Toh et al., 2011;
Pollard et al., 2006; Prabhakar et al., 2009). In this work, we
used a different approach to examine epigenetic regulatory signatures and discovered biased evolutionary acceleration in the genomic regions that become accessible only in specific tissues and at certain developmental stages, lending support to the idea that directional selection, rather than neutral processes, likely play a role in shaping the landscape of hu-man-accelerated evolution. Additionally, we found strong evolutionary constraints in the regulatory sequences of devel-oping brains, indicating that failure of the normal develop-ment of the central nervous system may be universally detri-mental to the fitness of organisms. Acceleration within deep-ly conserved regions highlights the functional importance of these sequence changes. In conclusion, our results elucidate the regulatory implications of human lineage-specific genetic alterations and will likely facilitate further related studies. Note: Supplementary information is available on the Mole-cules and Cells website (www.molcells.org).
ACKNOWLEDGMENTS
This work was supported by the Brain Research Program (2017M3C7A1048092) through the National Research Foundation (NRF) of Korea funded by the Ministry of Science and ICT.
AUTHOR CONTRIBUTIONS
K.S.L. carried out analysis and interpretation of the data. H.B. helped designing the analysis. J.K.C. and K.K. wrote the man-uscript. J.K.C. and K.K. supervised the study.
CONFLICT OF INTEREST
The authors have no potential conflicts of interest to disclose.
ORCID
Kang Seon Lee https://orcid.org/0000-0002-0402-6158
Hyoeun Bang https://orcid.org/0000-0002-1709-8556
Jung Kyoon Choi https://orcid.org/0000-0003-2077-8947
Kwoneel Kim https://orcid.org/0000-0002-4221-3421
REFERENCES
Barton, R.A. and Venditti, C. (2014). Rapid evolution of the cerebellum in humans and other great apes. Curr. Biol. 24, 2440-2444.
Bejerano, G., Pheasant, M., Makunin, I., Stephen, S., Kent, W.J., Mattick, J.S., and Haussler, D. (2004). Ultraconserved elements in the human genome. Science 304, 1321-1325.
Bird, C.P., Stranger, B.E., Liu, M., Thomas, D.J., Ingle, C.E., Beazley, C., Miller, W., Hurles, M.E., and Dermitzakis, E.T. (2007). Fast-evolving noncoding sequences in the human genome. Genome Biol. 8, R118.
Bush, E.C. and Lahn, B.T. (2008). A genome-wide screen for noncoding elements important in primate evolution. BMC Evol. Biol. 8, 17.
Caporale, A.L., Gonda, C.M., and Franchini, L.F. (2019). Transcriptional enhancers in the FOXP2 locus underwent accelerated evolution in the human lineage. Mol. Biol. Evol. 36, 2432-2450.
DeCasien, A.R., Williams, S.A., and Higham, J.P. (2017). Primate brain size is
predicted by diet but not sociality. Nat. Ecol. Evol. 1, 1-7.
Dimitrieva, S. and Bucher, P. (2013). UCNEbase–a database of ultraconserved non-coding elements and genomic regulatory blocks. Nucleic Acids Res. 41, D101-D109.
Doan, R.N., Bae, B.I., Cubelos, B., Chang, C., Hossain, A.A., Al-Saad, S., Mukaddes, N.M., Oner, O., Al-Saffar, M., Balkhy, S., et al. (2016). Mutations in human accelerated regions disrupt cognition and social behavior. Cell 167, 341-354.e12.
Duret, L. and Galtier, N. (2009). Comment on “Human-specific gain of function in a developmental enhancer”. Science 323, 1-2.
Ernst, J., Kheradpour, P., Mikkelsen, T.S., and Shoresh, N. (2011). Mapping and analysis of chromatin state dynamics in nine human cell types. Nature 473, 43-49.
Heintzman, N.D., Hon, G.C., Hawkins, R.D., Kheradpour, P., Stark, A., Harp, L.F., Ye, Z., Lee, L.K., Stuart, R.K., Ching, C.W., et al. (2009). Histone modifications at human enhancers reflect global cell-type-specific gene expression. Nature 459, 108-112.
Hill, K.K., Juang, V.B.J., and Hoffmann, F.M. (1995). Genetic interactions between the Drosophila Abelson (Abl) tyrosine kinase and failed axon connections (Fax), a novel protein in axon bundles. Genetics 141, 595-606. Hnisz, D., Abraham, B.J., Lee, T.I., Lau, A., Saint-André, V., Sigova, A.A., Hoke, H.A., and Young, R.A. (2013). Super-enhancers in the control of cell identity and disease. Cell 155, 934-947.
Kamm, G.B., Pisciottano, F., Kliger, R., and Franchini, L.F. (2013). The developmental brain gene NPAS3 contains the largest number of accelerated regulatory sequences in the human genome. Mol. Biol. Evol. 30, 1088-1102.
Katzman, S., Kern, A.D., Pollard, K.S., Salama, S.R., and Haussler, D. (2010). GC-biased evolution near human accelerated regions. PLoS Genet. 6, e1000960.
King, M. and Wilson, A.C. (1975). Evolution at two levels in humans and chimpanzees. Science 188, 107-116.
Kostka, D., Hubisz, M.J., Siepel, A., and Pollard, K.S. (2012). The role of GC-biased gene conversion in shaping the fastest evolving regions of the human genome. Mol. Biol. Evol. 29, 1047-1057.
Lindblad-Toh, K., Garber, M., Zuk, O., Lin, M.F., Parker, B.J., Washietl, S., Kheradpour, P., Ernst, J., Jordan, G., Mauceli, E., et al. (2011). A high-resolution map of human evolutionary constraint using 29 mammals. Nature 478, 476-482.
Lu, Y., Wang, X., Yu, H., Li, J., Jiang, Z., Chen, B., Lu, Y., Wang, W., Han, C., Ouyang, Y., et al. (2019). Evolution and comprehensive analysis of DNAseI hypersensitive sites in regulatory regions of primate brain-related genes. Front. Genet. 10, 1-12.
Maurano, M.T., Humbert, R., Rynes, E., Thurman, R.E., Haugen, E., Wang, H., Reynolds, A.P., Sandstrom, R., Qu, H., Brody, J., et al. (2012). Systematic localization of common disease-associated variation in regulatory DNA. Science 337, 1190-1195.
McLean, C.Y., Reno, P.L., Pollen, A.A., Bassan, A.I., Capellini, T.D., Guenther, C., Indjeian, V.B., Lim, X., Menke, D.B., Schaar, B.T., et al. (2011). Human-specific loss of regulatory DNA and the evolution of human-Human-specific traits. Nature 471, 216-219.
Morreale de Escobar, G., Obregon, M.J., and Escobar del Rey, F. (2004). Role of thyroid hormone during early brain development. Eur. J. Endocrinol. 151, U25-U37.
Pennacchio, L.A., Ahituv, N., Moses, A.M., and Prabhakar, S. (2006). In vivo enhancer analysis of human conserved non-coding sequences. Nature 444, 499-502.
Pollard, K.S., Hubisz, M.J., Rosenbloom, K.R., and Siepel, A. (2010). Detection of nonneutral substitution rates on mammalian phylogenies. Genome Res. 20, 110-121.
Evolution of the Regulatory Sequences in Brain Development Kang Seon Lee et al. Siepel, A., Pedersen, J.S., Bejerano, G., Baertsch, R., et al. (2006). Forces
shaping the fastest evolving regions in the human genome. PLoS Genet. 2, e168.
Prabhakar, S., Noonan, J.P., Svante, P., and Rubin, E.M. (2006). Accelerated evolution of conserved noncoding sequences in humans. Science 314, 786.
Prabhakar, S., Visel, A., Akiyama, J.A., Shoukry, M., Lewis, K.D., Holt, A., Plajzer-Frick, I., Morrison, H., Fitzpatrick, D.R., Afzal, V., et al. (2008). Human-specific gain of function in a developmental enhancer. Science 321, 1346-1350.
Prabhakar, S., Visel, A., Akiyama, J.A., Shoukry, M., Lewis, K.D., Holt, A., Plajzer-Frick, I., Morrison, H., FitzPatrick, D.R., Afzal, V., et al. (2009). Response to comment on “Human-specific gain of function in a developmental enhancer”. Science 323, 714d.
Roth, G. (2015). Convergent evolution of complex brains and high intelligence. Philos. Trans. R. Soc. Lond. B Biol. Sci. 370, 20150049. Sandhu, K.S., Li, G., Poh, H.M., Quek, Y.L.K., Sia, Y.Y., Peh, S.Q., Mulawadi,
F.H., Lim, J., Sikic, M., Menghi, F., et al. (2012). Large-scale functional organization of long-range chromatin interaction networks. Cell Rep. 2, 1207-1219.
Siepel, A., Bejerano, G., Pedersen, J.S., Hinrichs, A.S., Hou, M., Rosenbloom, K., Clawson, H., Spieth, J., Hillier, L.W., Richards, S., et al. (2005). Evolutionarily conserved elements in vertebrate, insect, worm, and yeast genomes. Genome Res. 15, 1034-1050.
Spielmann, M. and Mundlos, S. (2016). Looking beyond the genes: the role of non-coding variants in human disease. Hum. Mol. Genet. 25, R157-R165.
Stein, J.L., Hua, X., Lee, S., Ho, A.J., Leow, A.D., and Toga, A.W. (2010). Voxelwise genome-wide association study (vGWAS). Neuroimage 53, 1160-1174.
Yang, D., Jang, I., Choi, J., Kim, M.S., Lee, A.J., Kim, H., Eom, J., Kim, D., Jung, I., and Lee, B. (2018). 3DIV: a 3D-genome Interaction Viewer and database. Nucleic Acids Res. 46, D52-D57.