Background: This study was designed to statistically analyze the year, gender, age, insurance type, and
condition/disease of patients who were admitted to the Department of Acupuncture and Moxibustion Medicine at DaeJeon Korean Medicine Hospital over a 5-year period (2015-2020).
Methods: Patients who visited the Department of Acupuncture and Moxibustion Medicine at DaeJeon
Korean Medicine Hospital were classified according to year, gender, age, insurance type, and condition/ disease. The statistical analysis was performed using IBM SPSS 23.0.
Results: There is an increasing number of patients attending the Department of Acupuncture and
Moxibustion Medicine year-on-year over the 5-year period, with a higher frequency of females than males each year. The largest age groups represented in these patients were those aged in their 50s, followed by those aged in their 40s, and 60s. Furthermore, the number of patients using health insurance was greater than those using automobile insurance each year. Of the 5,061 patients, the most common group was the patients (n = 991) who reported sprain and strain of cervical spine, followed by lumbar spine, lumbar herniation of the intervertebral disc, and facial paralysis.
Conclusion: The number of patients seeking traditional Korean medicine treatment continues to increase,
particularly in the 40s to 60s age group, with a larger proportion using health insurance and sprain or strain of the cervical spine. The results of this study may be used as a local (Daejeon) reference to develop Korean medicine policies, such as setting up medical benefits for patients using Korean medicine hospitals.
©2021 Korean Acupuncture & Moxibustion Medicine Society. This is an open access article under the CC BY-NC-ND license (http://creativecommons.org/licenses/by-nc-nd/4.0/). Article history: Submitted: October 14, 2020 Revised: December 10, 2020 Accepted: February 26, 2021 Keywords: acupuncture,
Korean traditional medicine, moxibustion, statistics
https://doi.org/10.13045/jar.2020.00353 pISSN 2586-288X eISSN 2586-2898
Original Article
Statistical Analysis of Patients Attending the Department of
Acupuncture and Moxibustion Medicine at DaeJeon Korean Medicine
Hospital: from March 2015 to February 2020
Ki Jung Sung, Ye Ji Lee, Hyo Bin Kim, Beom Seok Kim, Ju Hyun Jeon, Eun Seok Kim, Young Il Kim*
Department of Acupuncture and Moxibustion Medicine, College of Korean Medicine, Daejeon University, Daejeon, Korea
ABSTRACT
Journal of Acupuncture Research
Journal homepage: http://www.e-jar.orgIntroduction
Acupuncture and moxibustion medicine are representative areas of Korean medicine that aim to prevent and treat conditions/ diseases by provoking reactions in the body using physical stimulation in certain areas, based on theories of traditional Korean medicine [1]. Between 2005 and 2014, the main conditions/ diseases which were treated in the Department of Acupuncture and Moxibustion Medicine, DaeJeon Korean medicine hospital, DaeJeon University were spinal, joint, and paralysis conditions/ diseases which accounted for 21.2% of total patient population [2]. It has been reported in 2006 and 2010 that there has been an increase in the number of patients visiting Korean medicine
hospitals for the treatment of spine, joint, and paralysis conditions/ diseases [3,4]. As of the 3rd quarter of 2019, the medical expense’s
statistics index of Health Insurance Review and Assessment Service and National Health Insurance Service, reported that the allowance of medical care paid to Korean medicine centers for spine, joint and paralysis conditions/diseases was about 578.6 billion Korean won, which was a 10.38% increase from about 524.2 billion Korean won in the 3rd quarter of 2018 [5]. An increasing interest
of patients towards Korean medicine treatment of spine, joint, and paralysis conditions/diseases is apparent. Therefore, there is a need to analyze the patient demographics of those individuals who seek Korean medicine treatment. Previously, the change in the number of patients by year from 1980 to 2004 has been studied [5], with
*Corresponding author. Young Il Kim
Department of Acupuncture and Moxibustion Medicine, College of Korean Medicine, Daejeon University, 75, Daedeok-daero 176 Beon-gil, Seo-gu, Daejeon, Korea Email: [email protected]
ORCID: Ki Jung Sung https://orcid.org/0000-0001-8440-1191, Ye Ji Lee https://orcid.org/0000-0002-2759-5644, Hyo Bin Kim https://orcid.org/0000-0002-2752-4221, Beom
Seok Kim https://orcid.org/0000-0001-9572-288X, Ju Hyun Jeon https://orcid.org/0000-0001-6666-7922, Eun Seok Kim https://orcid.org/0000-0002-9342-3082, Young Il Kim https://orcid.org/0000-0001-9221-3238
©2021 Korean Acupuncture & Moxibustion Medicine Society. This is an open access article under the CC BY-NC-ND license (http://creativecommons.org/licenses/by-nc-nd/4.0/).
one study on the number of facial palsy patients by year from 2004 to 2008 [4], analysis of the sociodemographic characteristics and usage by year of hospitalized patients from 2004 to 2015 [2], and analysis of the patient distribution of age, sex, month, systematic categorization of condition/disease, single condition/disease, and number of conditions/diseases for hospitalized patients from 2011 to 2012 [6] has been published. However, there are currently no studies on the outpatients of the Department of Acupuncture and Moxibustion Medicine, only studies on a single condition/disease, and a lack of studies that comprehensively analyze the insurance types of categorization for a particular condition/disease. To address these criteria the medical records of patients who visited the Department of Acupuncture and Moxibustion Medicine of DaeJeon Korean medicine hospital, DaeJeon University from March 1, 2015 to February 29, 2020 were retrospectively analyzed.
Materials and Methods Participants
The medical records for 5 years from March 1, 2015 to February 29, 2020, of 13,591 first visit and repeat patients at the Department of Acupuncture and Moxibustion Medicine, DaeJeon Korean Medicine hospital, DaeJeon University as inpatients and outpatients were analyzed. The first visit patients were categorized using their condition/disease. There were 5,816 medical records analyzed for frequency of conditions/diseases. When there were more than 2 conditions/diseases, then analysis was performed using the main condition/disease.
Method
This study was performed after receiving review exemption from the Institutional Review Board of DaeJeon Korean medicine hospital, DaeJeon University. (IRB no: DJDSKH-20-E-17-1)
The data in this study was collected from the electronic medical records of the patients, and it was compiled after consultation with the professors at the Department of Korean Medicine and the Department of Statistics, DaeJeon University. The patient demographics collected included year, sex, age, type of insurance, and category of condition/disease the insurance company assigned. Year
Year 2015: March 1, 2015–February 29, 2016 Year 2016: March 1, 2016–February 28, 2017 Year 2017: March 1, 2017–February 28, 2018 Year 2018: March 1, 2018–February 28, 2019 Year 2019: March 1, 2019–February 29, 2020 Sex
Male Female Age groups
Children: 0–9 years old Adolescents: 10–19 years old Twenties: 20–29 years old Thirties: 30–39 years old Forties: 40–49 years old Fifties: 50–59 years old Sixties: 60–69 years old Seventies: 70–79 years old Eighties: 80–89 years old Over nineties: > 90 years old
Types of insurance Automobile insurance Health insurance Medical care Other insurance Categorization of condition/disease
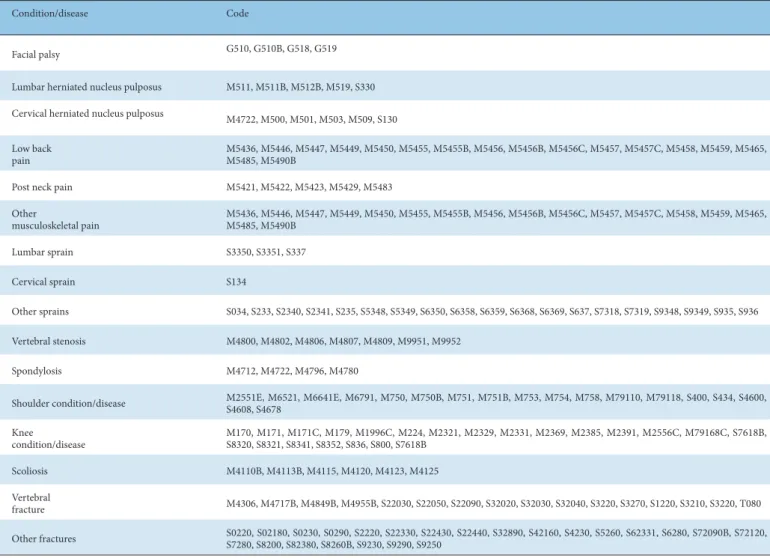
The condition/disease was based on the information from the electronic medical record via the KCD7 (Korean Standard Classification of Disease and Cause of Death), and when there were more than 2 conditions/diseases, the main condition/disease was used. A total of 5,816 patients’ conditions/diseases were categorized upon injury, condition/disease, and main condition/ disease categorization. Of these, the top 16 conditions/diseases were analyzed, and the total number of first visit patients with 1 of these 16 conditions/diseases accounted for 5,061 out of 5,816 patients. Details of conditions/diseases are shown in Table 1.
Statistical analysis
IBM SPSS Inc., Chicago, IL, USA Version 23.0 for Windows (2016, USA) was used to statistically analyze the electronic medical records, and perform crosstabulation using the Chi-square test and linear regression analysis. Statistical significance was identified when the p value was less than 0.05. The statistical analysis performed to determine the number of patients:
1) Per year by sex 2) Per year by age
3) Per year by automobile insurance and health insurance 4) Per year by medical care and other than medical care of health
insurance
5) Per year by injury condition/disease and sickness condition/ disease
6) By frequently presented condition/disease
Results
Number of patients per year by sex
The total number of patients who visited the Department of Acupuncture and Moxibustion Medicine of DaeJeon Korean medicine hospital, DaeJeon University over the 5-year period from March 1, 2015 to February 29, 2020 was 13,591. There were 5,423 males, and 8,168 females. The sex and number of first visit or repeat patients showed there were more females than males every year, and the number showed an annual increase. To identify the number of patients per year by sex, crosstabulation using the Chi-square test was performed, and there was no statistical significance in the number of patients per year by sex (p = 0.083; Table 2).
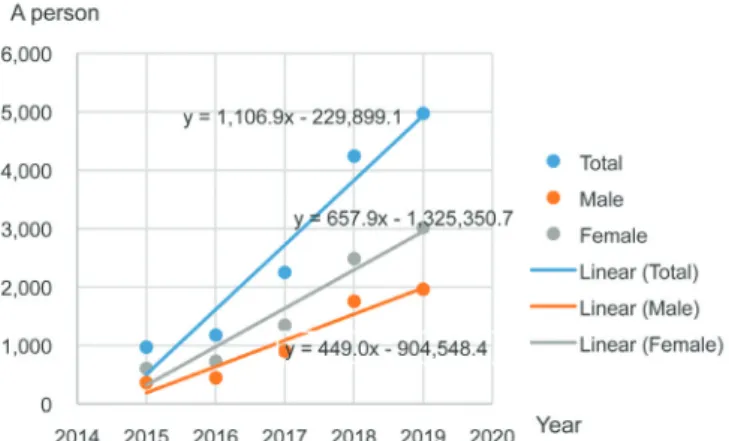
Regression analysis was performed to identify the trend, and tendency in the number of patients per year by sex, and showed a bilateral increase in the number of male and female patients. There was an annual increase in male patients of 449.0 patients, and 657.9 in female patients. The rate of increase was higher in females compared with males (Table 3; Fig. 1).
Number of patients per year by age
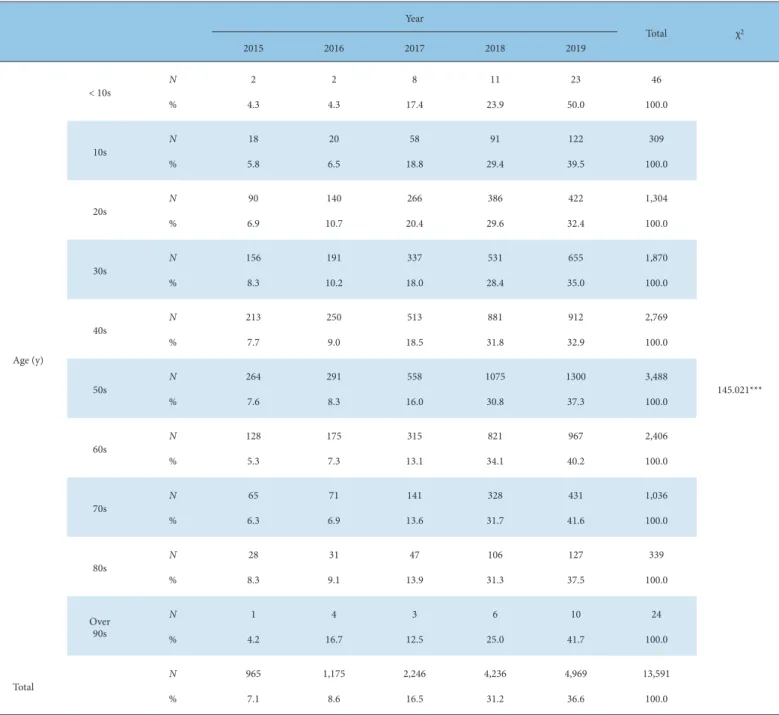
Of the 13,591 patients who visited as a first visit or repeat patients, patients in their 50s were the age group with the highest number of attendees (25.7%), followed by patients in their 40s and 60s. Middle-aged and elderly patients (40–69 years; n = 8,663) consisted of 63.7% of the total number of visiting patients. The number of patients by age increased annually, with the largest
increase from 2016 to 2018. Crosstabulation using the Chi-square test to identify the number of patients per year by age, showed statistical significance (p < 0.001; Table 4).
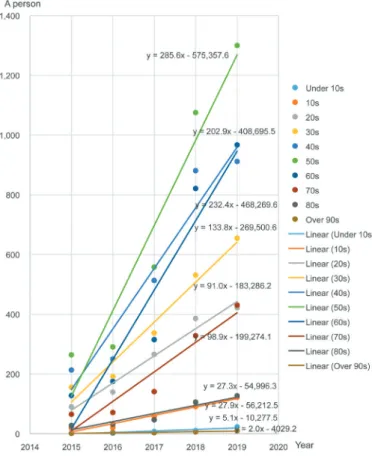
Regression analysis to determine trend and tendency of number
of patients per year by age, showed the year affected the number of patients per year in every age group. The number of patients by age increased year by year. The annual increase in the number of patients was 5.1 in the under tens, 27.9 in adolescents, 91.0 in their
Condition/disease Code
Facial palsy G510, G510B, G518, G519
Lumbar herniated nucleus pulposus M511, M511B, M512B, M519, S330 Cervical herniated nucleus pulposus M4722, M500, M501, M503, M509, S130 Low back
pain M5436, M5446, M5447, M5449, M5450, M5455, M5455B, M5456, M5456B, M5456C, M5457, M5457C, M5458, M5459, M5465, M5485, M5490B
Post neck pain M5421, M5422, M5423, M5429, M5483
Other musculoskeletal pain M5436, M5446, M5447, M5449, M5450, M5455, M5455B, M5456, M5456B, M5456C, M5457, M5457C, M5458, M5459, M5465, M5485, M5490B Lumbar sprain S3350, S3351, S337 Cervical sprain S134 Other sprains S034, S233, S2340, S2341, S235, S5348, S5349, S6350, S6358, S6359, S6368, S6369, S637, S7318, S7319, S9348, S9349, S935, S936 Vertebral stenosis M4800, M4802, M4806, M4807, M4809, M9951, M9952 Spondylosis M4712, M4722, M4796, M4780
Shoulder condition/disease M2551E, M6521, M6641E, M6791, M750, M750B, M751, M751B, M753, M754, M758, M79110, M79118, S400, S434, S4600, S4608, S4678 Knee condition/disease M170, M171, M171C, M179, M1996C, M224, M2321, M2329, M2331, M2369, M2385, M2391, M2556C, M79168C, S7618B, S8320, S8321, S8341, S8352, S836, S800, S7618B Scoliosis M4110B, M4113B, M4115, M4120, M4123, M4125 Vertebral fracture M4306, M4717B, M4849B, M4955B, S22030, S22050, S22090, S32020, S32030, S32040, S3220, S3270, S1220, S3210, S3220, T080 Other fractures S0220, S02180, S0230, S0290, S2220, S22330, S22430, S22440, S32890, S42160, S4230, S5260, S62331, S6280, S72090B, S72120, S7280, S8200, S82380, S8260B, S9230, S9290, S9250 Table 1. Correlation Condition/Disease Code.
Sex Year Total χ2
2015 2016 2017 2018 2019 Male 365 446 902 1,754 1,956 5,423 8.254 (6.7) (8.2) (16.6) (32.3) (36.1) (100.0) Female 600 729 1,344 2,482 3,013 8,168 (7.3) (8.9) (16.5) (30.4) (36.9) (100.0) Total 965 1,175 2,246 4,236 4,969 13,591 (7.1) (8.6) (16.5) (31.2) (36.6) (100.0)
Data are presented as n (%).
Variable Unstandardized regression coefficient Standardized regression coefficient t (p) F (p) R2 B SE β Male (Constant) -904,548.400 142,814.081 -6.334** 40.213** 0.931 Year 449.000 70.805 0.965 6.341** Female (Constant) -1,325,350.700 189,462.494 -6.995** 49.055** 0.942 Year 657.900 93.933 0.971 7.004** *p < 0.05, **p < 0.01, ***p < 0.001.
Table 3. Linear Regression Analysis of Number of Patients by Year According to Sex.
Year Total χ2 2015 2016 2017 2018 2019 Age (y) < 10s N 2 2 8 11 23 46 145.021*** % 4.3 4.3 17.4 23.9 50.0 100.0 10s N 18 20 58 91 122 309 % 5.8 6.5 18.8 29.4 39.5 100.0 20s N 90 140 266 386 422 1,304 % 6.9 10.7 20.4 29.6 32.4 100.0 30s N 156 191 337 531 655 1,870 % 8.3 10.2 18.0 28.4 35.0 100.0 40s N 213 250 513 881 912 2,769 % 7.7 9.0 18.5 31.8 32.9 100.0 50s N 264 291 558 1075 1300 3,488 % 7.6 8.3 16.0 30.8 37.3 100.0 60s N 128 175 315 821 967 2,406 % 5.3 7.3 13.1 34.1 40.2 100.0 70s N 65 71 141 328 431 1,036 % 6.3 6.9 13.6 31.7 41.6 100.0 80s N 28 31 47 106 127 339 % 8.3 9.1 13.9 31.3 37.5 100.0 Over 90s N 1 4 3 6 10 24 % 4.2 16.7 12.5 25.0 41.7 100.0 Total N 965 1,175 2,246 4,236 4,969 13,591 % 7.1 8.6 16.5 31.2 36.6 100.0 *p < 0.05, **p < 0.01, ***p < 0.001.
20s, 133.8 in their 30s, 202.9 in their 40s, 285.6 in their 50s, 232.4 in their 60s, 98.9 in their 70s, 27.3 in their 80s, and 2.0 in patients older than 90 years (Table 5; Fig. 2).
Number of patients per year by automobile insurance and health insurance
Automobile insurance and health insurance
There were 5,816 patients who attended their first visit and were categorized into automobile insurance and health insurance. The number of patients per year by types of insurance, was higher in the health insurance than the automobile insurance group. The number of patients increased annually in both types of insurance, and the increase was the greatest between 2016 and 2018. Crosstabulation using the Chi-square test to identify the number of patients per year by automobile insurance and health insurance showed statistical significance in the number of patients per year by automobile insurance and health insurance (p < 0.001; Table 6).
Regression analysis performed to identify the trend and
Variable Unstandardized Regression Coefficient Standardized Regression Coefficient t (p) F (p) R2 Age (y) B SE β < 10s (Constant) -10,277.500 2,290.872 -4.486* 20.163* 0.870 Year 5.100 1.136 0.933 4.490* 10s (Constant) -56,212.500 7,109.271 -7.907** 62.657** 0.954 Year 27.900 3.525 0.977 7.916** 20s (Constant) -183,286.200 18,931.173 -9.682** 94.003** 0.969 Year 91.000 9.386 0.984 9.695** 30s (Constant) -269,500.600 30,738.805 -8.767** 77.082** 0.963 Year 133.800 15.240 0.981 8.780** 40s (Constant) -408,695.500 67,689.026 -6.038** 36.554** 0.924 Year 202.900 33.559 0.961 6.046** 50s (Constant) -575,357.600 92,036.243 -6.251** 39.175** 0.929 Year 285.600 45.630 0.964 6.259** 60s (Constant) -468,269.600 88,303.167 -5.303* 28.179* 0.904 Year 232.400 43.779 0.951 5.308* 70s (Constant) -199,274.100 36,863.317 -5.406* 29.283* 0.907 Year 98.900 18.276 0.952 5.411* 80s (Constant) -54,996.300 10,935.913 -5.029* 25.353* 0.894 Year 27.300 5.422 0.946 5.035* > 90s (Constant) -4,029.200 960.284 -4.196* 17.647* 0.855 Year 2.000 0.476 0.925 4.201* *p < 0.05, **p < 0.01, ***p < 0.001.
Table 5. Linear Regression Analysis of Number of Patients by Year According to Age. Fig. 1. Linear regression of number of patients by year according to sex.
Year Total χ2 2015 2016 2017 2018 2019 Type Auto insurance N 87 137 274 352 475 1,325 20.618*** % 6.6 10.3 20.7 26.6 35.8 100.0 Health insurance N 245 344 825 1,370 1,707 4,491 % 5.5 7.7 18.4 30.5 38.0 100.0 Total N 332 481 1,099 1,722 2,182 5,816 % 5.7 8.3 18.9 29.6 37.5 100.0 *p < 0.05, **p < 0.01, ***p < 0.001.
Table 6. Crossover Analysis of Insurance Type (Auto or Health) and Year for Total Patients by Year.
increase was higher in the health insurance group compared with the automobile insurance group (Table 7; Fig. 3).
Medical care and other insurances
There were 4,491 patients with health insurance in their first visit who were categorized into medical care and other insurance. The number of patients per year by types of insurance showed a decrease in 2017 in medical care insurance, but an increase in the other years, and the number of patients with other insurance showed annual increase of which the greatest increase was from 2017 to 2018. Crosstabulation using the Chi-square test to identify the number of patients per year by types of insurance, showed statistical significance in the annual difference in the number of patients with medical care insurance, and other insurances (p < 0.001 ; Table 8).
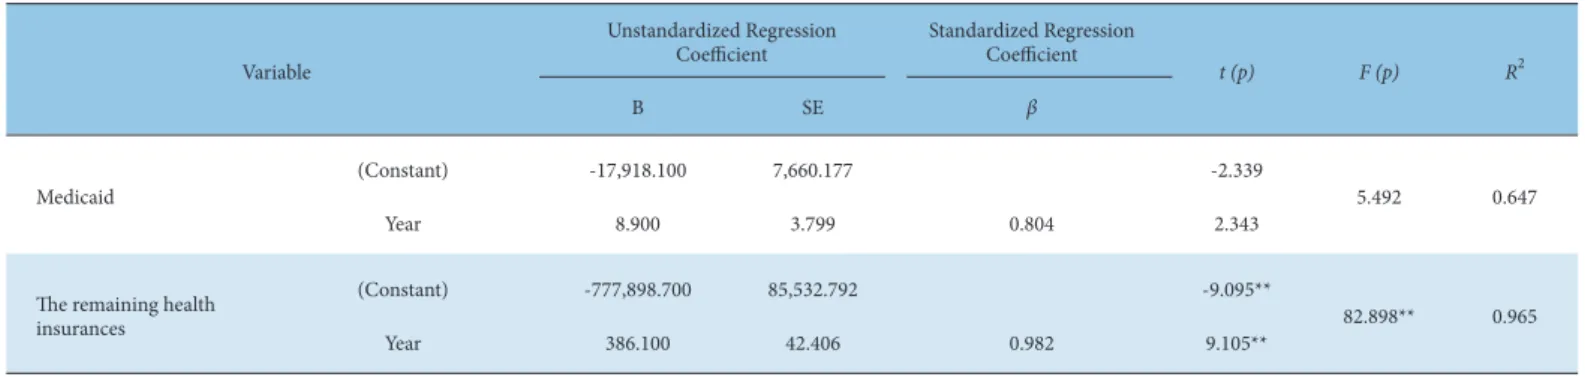
Regression analysis to identify the trend and tendency of number of patients per year by types of insurance, showed that year does not affect the number of medical care patients with health insurance, and that year affects other insurances. The number of medical care patients with health insurance showed an increase after decrease in 2017, and the number of patients with
Fig. 2. Linear regression of number of patients by year according to age. Fig. 3. Linear regression of number of patients by year according to insurance type (auto or health).
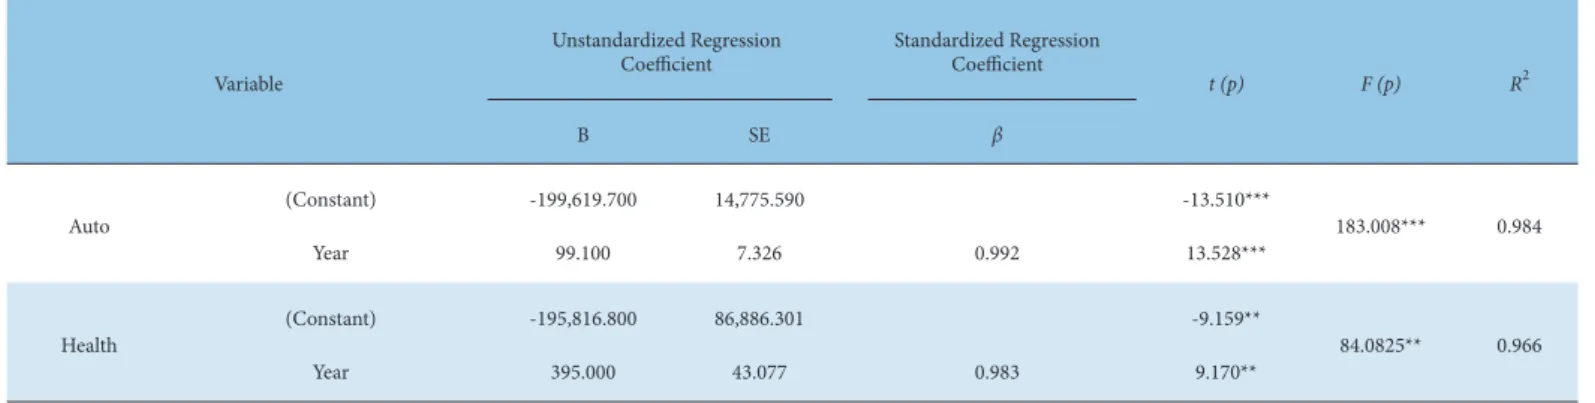
tendency of number of patients by types of insurance showed that year affects the number of patients both in automobile insurance and health insurance groups. The number of patients increased annually in both the automobile insurance and health insurance group. The annual increase was 99.1 patients in the automobile insurance and 395.0 patients in health insurance group. The rate of
Variable
Unstandardized Regression
Coefficient Standardized Regression Coefficient
t (p) F (p) R2 B SE β Auto (Constant) -199,619.700 14,775.590 -13.510*** 183.008*** 0.984 Year 99.100 7.326 0.992 13.528*** Health (Constant) -195,816.800 86,886.301 -9.159** 84.0825** 0.966 Year 395.000 43.077 0.983 9.170** *p < 0.05, **p < 0.01, ***p < 0.001.
Table 7. Linear Regression Analysis of Number of Patients by Year According to Insurance Type (Auto or Health).
Year Total χ2 2015 2016 2017 2018 2019 Type Medicaid insurance N 21 29 17 38 61 166 47.564*** % 12.7 17.5 10.2 22.9 36.7 100.0 The remaining health insurances N 224 315 808 1,332 1,646 4,325 % 5.2 7.3 18.7 30.8 38.1 100.0 Total N 245 344 825 1,370 1,707 4,491 % 5.5 7.7 18.4 30.5 38.0 100.0 *p < 0.05, **p < 0.01, ***p < 0.001.
Table 8. Crossover Analysis of Insurance Type (Medicaid or the Remaining Health Insurances) and Year for Total Patients by Year.
other insurances showed annual increase. The number of patients in the other insurance category showed an annual increase of 386.1 patients (Table 9; Fig. 4).
Analysis of number of patients per year by condition/disease 1) Injury condition/disease and sickness condition/disease There were 5,816 patients who attended their first visit and were categorized into a main condition/disease of injury condition/ disease, and sickness condition/disease, who were diagnosed according to the Korean Standard Classification of Disease and Cause of Death (KCD 7). The number of patients per year by the condition/disease code was higher every year in the sickness condition/disease compared with the injury condition/disease, and there was annual increase in the number of patients per year by condition/disease codes. Crosstabulation using the Chi-square test to identify the number of patients per year by condition/disease code, showed statistical significance in the difference of number of patients per year in the injury condition/disease group, and sickness condition/disease group (p < 0.001; Table 10).
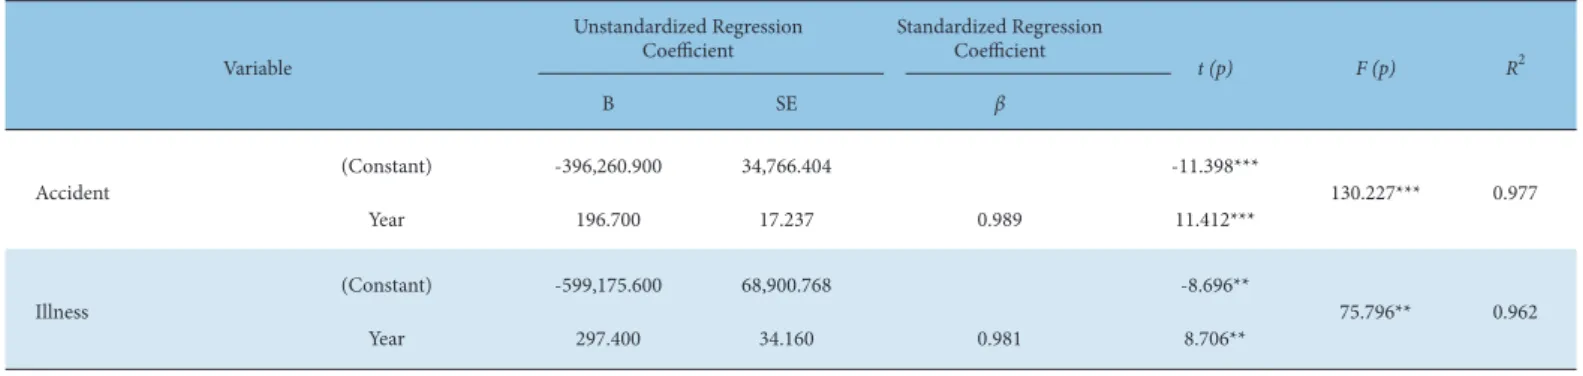
Regression analysis was performed to identify the trend and tendency of number of patients per year by types of insurance and showed that year affects the number of patients in the injury condition/disease and the sickness condition/disease group. The
number of patients, both in the injury condition/disease, and sickness condition/disease increased annually. The annual increase in the number of patients in the injury condition/disease group was 196.7, and 297.4 in the sickness condition/disease group. The rate of increase was higher in the sickness condition/disease group compared with the injury condition/disease (Table 11; Fig. 5).
2) Condition/disease frequently presented
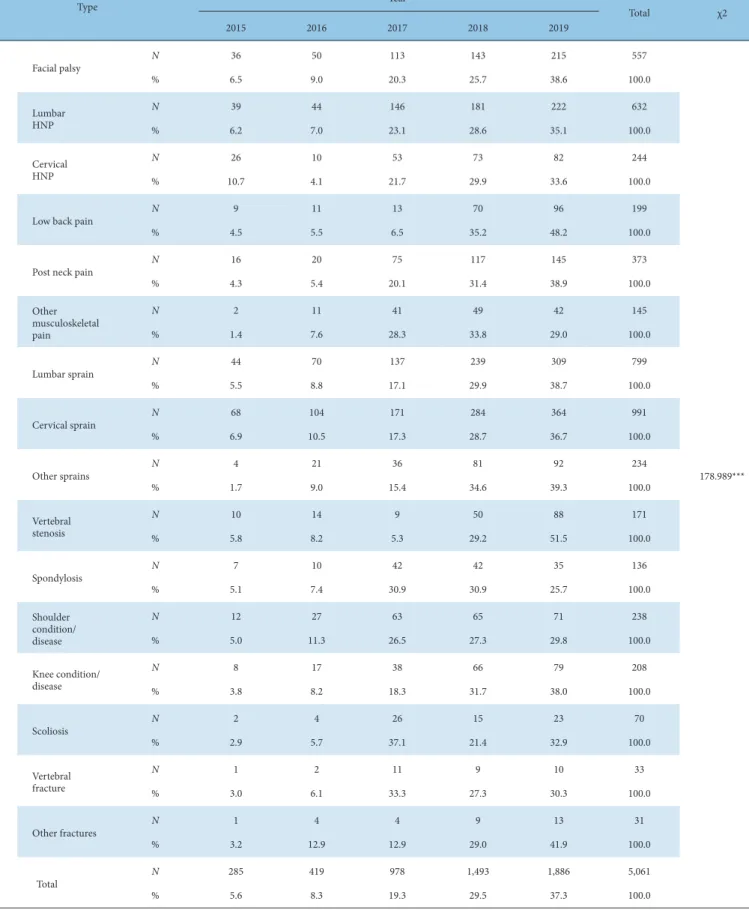
Categorizing 5,816 patients into their first visit, there were 5,061 patients (87.0%) according to the 16 groups of frequently presented condition/diseases. Of these 5,061 patients, the number of patients per year by frequently presented condition/disease, there was 991 (17.0%) in the sprain and strain of cervical spine group which ranked top, followed by sprain and strain of the lumbar spine, lumbar herniation of the intervertebral disk, and facial paralysis. In the cervical herniation of the intervertebral disk group, the number of patients decreased in 2016, as did the number of patients in 2017 with spinal stenosis, and the number of patients in 2018 with scoliosis. There was a similar number of patients with fracture of the vertebra from 2017 onwards. The number of patients in the other 12 groups showed a steady increase over the 5-year period. Crosstabulation performed for identification of number of patients per year by frequently presented condition/disease showed
Year Total χ2 2015 2016 2017 2018 2019 Type Accident N 137 246 427 723 882 2,415 22.811*** % 5.7 10.2 17.7 29.9 36.5 100.0 Sickness N 195 235 672 999 1,300 3,401 % 5.7 6.9 19.8 29.4 32.2 100.0 Total N 332 481 1,099 1,722 2,182 5,816 % 5.7 8.3 18.9 29.6 37.5 100.0 *p < 0.05, **p < 0.01, ***p < 0.001.
Table 10. Crossover Analysis of Condition/disease Code (Accident or Illness) and Year for Total Patients by Year. Variable
Unstandardized Regression
Coefficient Standardized Regression Coefficient
t (p) F (p) R2
B SE β
Medicaid (Constant) -17,918.100 7,660.177 -2.339 5.492 0.647
Year 8.900 3.799 0.804 2.343
The remaining health insurances
(Constant) -777,898.700 85,532.792 -9.095**
82.898** 0.965
Year 386.100 42.406 0.982 9.105**
*p < 0.05, **p < 0.01, ***p < 0.001.
Table 9. Linear Regression Analysis of Number of Patients by Year According to Insurance Type (Medicaid or the Remaining Health Insurances).
Fig. 4. Linear regression of number of patients by year according to insurance type (medicaid or the remaining health insurances).
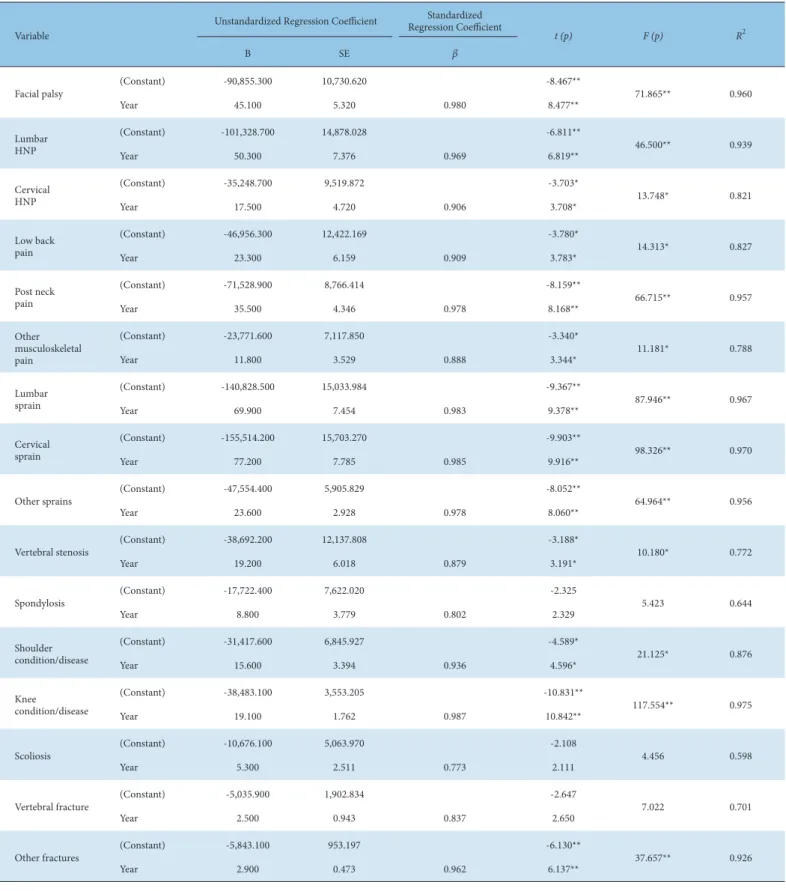
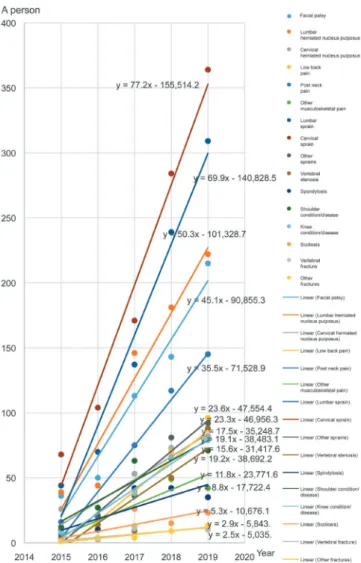
Regression analysis for the identification of trend and tendency of number of patients per year by frequently presented condition/ disease, showed that the year affects the number of patients in the 13 groups, besides the vertebral condition/disease, scoliosis, and fracture of vertebra. The number of patients in the 13 groups showed annual increase. The annual increase in the number of patients who presented with facial palsy was 45.1, lumbar herniation of intervertebral disk was 50.3, cervical herniation of intervertebral disk was 17.5, low back pain was 23.3, post neck pain was 35.5, other musculoskeletal pain was 11.8, sprain and strain of lumbar vertebra was 69.9, sprain and strain of cervical spine was 77.2, other sprains and strains 23.6, spinal stenosis was 19.2, shoulder condition/disease was 15.6, knee condition/disease was 19.1, and other fractures was 2.9 (Table 13; Fig. 6).
Discussion
The demand for Korean medicine is expected to rise with the aging demographic of the population in Korea, and a change in the condition/disease structure of the insurance companies reported in 2012 [6]. The allowance of medical care paid to Korean medicine hospitals in the 3rd quarter of 2019 was approximately 314.5 billion
Korean won, and the allowance of medical care paid to Korean statistical significance in the difference of number of patients
per year by frequently presented conditions/diseases. Therefore, the tendency of the number of patients per year by frequently presented condition/disease is different (p < 0.001 ; Table 12).
Variable
Unstandardized Regression
Coefficient Standardized Regression Coefficient
t (p) F (p) R2 B SE β Accident (Constant) -396,260.900 34,766.404 -11.398*** 130.227*** 0.977 Year 196.700 17.237 0.989 11.412*** Illness (Constant) -599,175.600 68,900.768 -8.696** 75.796** 0.962 Year 297.400 34.160 0.981 8.706** *p < 0.05, **p < 0.01, ***p < 0.001.
Table 11. Linear Regression Analysis of Number of Patients by Year According to Condition/disease Code (Accident or Illness).
Fig. 5. Linear regression of number of patients by year according to condition/disease code (accident or illness).
medicine hospitals in the 3rd quarter of 2018 was approximately
274.3 billion Korean won, showing an annual increase of 14.70% [5]. Thus, as the demand for Korean medicine treatment increases, there is need for understanding the sociodemographic characteristics and patient use of Korean medicine institutions, to sharpen the competitiveness of Korean medicine hospitals. The patient demographic characteristics according to sex, age, type of insurance, and condition/disease of the patients who visited the Department of Acupuncture and Moxibustion Medicine, DaeJeon Korean medicine hospital, DaeJeon University from March 1, 2015 to February 29, 2020, was analyzed.
The number of first visit and repeat patients at the Department of Acupuncture and Moxibustion Medicine, DaeJeon Korean medicine hospital, DaeJeon University, in the last 5 years was 13,591. There were 5,423 (39.9%) male and 8,168 (60.1%) female patients. Every year the mean number of male patients increased by 449.0, and the mean number of female patients increased by 657.9 every year. Inquiring into the difference of health status between male and female patients and the difference of use of medical care, more female patients were determined to be in morbid state of chronic condition/disease and felt unhealthy, as
well as experiencing limitations in activities in everyday life [7]. On the use of medical services, as shown in previous studies [7], more female patients visited outpatient clinics and used Korean medicine treatments. Whilst the number of both male and female patients increased, the annual rate of increase was higher in female patients and accounted for an increase of 657.9 patients per year compared with 449.0 male patients.
The most common age of all patients was those in the 50’s group, followed by 40’s, and 60’s. The number of middle-aged patients in their 40’s, 50’s, and 60’s combined was 8,663, which was 63.7% of the total number of patients who visited the hospital. The allowance spent on medical care in the 3rd quarter of 2019 was the highest in
the patients aged in their 60’s [5], confirming that the major age group that visited the Korean medicine hospital in Daejeon was the same age group that takes up a large proportion of the national medical care. The life expectancy of Koreans is 82.1 years in 2019, which is on a sharp increase from 62.3 years in 1970, showing increase of 19.8 years in 33 years [8]. In addition, according to an index calculated using a survey on health by the Organization for Economic Co-operation and Development, only 32.5% of Koreans answered they had “very good” or “good” health, which is less than half of the Organization for Economic Co-operation and Development average 68.2% [8]. Due to the low level of subjective recognition of health status, the middle-aged population using medical services is steadily rising. It has been reported that the older the age, the higher the subjective expectation of receiving medical services provided by the government, and the satisfaction level is higher [9]. The number of hospital visits by the middle-aged patients is thought to be of great importance. In most age groups the number of patients visiting hospitals is increasing, which shows that the general demand for Korean medicine treatment is on the rise, and the rate of increase of patients in their 50’s (285.6 patients per year) is the highest, followed by patients in their 60’s (232.4 patients per year), and 40’s (202.9 patients per year).
Among the 5,816 first visit patients 1,325 patients (22.8%) used automobile insurance which increased by 99.1 patients per year, and 4,491 patients (77.2%) used health insurance which increased by 395.0 patients per year. It was reported in 2019 that the number of patients receiving only Western medicine treatment is decreasing whilst the number of patients receiving only Korean medicine treatment is increasing, and the number of patients choosing Korean medicine institutions as the first medical service when using automobile insurance is on the rise [10]. This shows that some of the patients who used Western medicine moved over
Type Year Total χ2 2015 2016 2017 2018 2019 Facial palsy N 36 50 113 143 215 557 178.989*** % 6.5 9.0 20.3 25.7 38.6 100.0 Lumbar HNP N 39 44 146 181 222 632 % 6.2 7.0 23.1 28.6 35.1 100.0 Cervical HNP N 26 10 53 73 82 244 % 10.7 4.1 21.7 29.9 33.6 100.0
Low back pain N 9 11 13 70 96 199
% 4.5 5.5 6.5 35.2 48.2 100.0
Post neck pain N 16 20 75 117 145 373
% 4.3 5.4 20.1 31.4 38.9 100.0 Other musculoskeletal pain N 2 11 41 49 42 145 % 1.4 7.6 28.3 33.8 29.0 100.0 Lumbar sprain N 44 70 137 239 309 799 % 5.5 8.8 17.1 29.9 38.7 100.0 Cervical sprain N 68 104 171 284 364 991 % 6.9 10.5 17.3 28.7 36.7 100.0 Other sprains N 4 21 36 81 92 234 % 1.7 9.0 15.4 34.6 39.3 100.0 Vertebral stenosis N 10 14 9 50 88 171 % 5.8 8.2 5.3 29.2 51.5 100.0 Spondylosis N 7 10 42 42 35 136 % 5.1 7.4 30.9 30.9 25.7 100.0 Shoulder condition/ disease N 12 27 63 65 71 238 % 5.0 11.3 26.5 27.3 29.8 100.0 Knee condition/ disease N 8 17 38 66 79 208 % 3.8 8.2 18.3 31.7 38.0 100.0 Scoliosis N 2 4 26 15 23 70 % 2.9 5.7 37.1 21.4 32.9 100.0 Vertebral fracture N 1 2 11 9 10 33 % 3.0 6.1 33.3 27.3 30.3 100.0 Other fractures N 1 4 4 9 13 31 % 3.2 12.9 12.9 29.0 41.9 100.0 Total N 285 419 978 1,493 1,886 5,061 % 5.6 8.3 19.3 29.5 37.3 100.0 *p < 0.05, **p < 0.01, ***p < 0.001.
Variable
Unstandardized Regression Coefficient Regression CoefficientStandardized
t (p) F (p) R2
B SE β
Facial palsy (Constant) -90,855.300 10,730.620 -8.467** 71.865** 0.960
Year 45.100 5.320 0.980 8.477** Lumbar HNP (Constant) -101,328.700 14,878.028 -6.811** 46.500** 0.939 Year 50.300 7.376 0.969 6.819** Cervical HNP (Constant) -35,248.700 9,519.872 -3.703* 13.748* 0.821 Year 17.500 4.720 0.906 3.708* Low back pain (Constant) -46,956.300 12,422.169 -3.780* 14.313* 0.827 Year 23.300 6.159 0.909 3.783* Post neck pain (Constant) -71,528.900 8,766.414 -8.159** 66.715** 0.957 Year 35.500 4.346 0.978 8.168** Other musculoskeletal pain (Constant) -23,771.600 7,117.850 -3.340* 11.181* 0.788 Year 11.800 3.529 0.888 3.344* Lumbar sprain (Constant) -140,828.500 15,033.984 -9.367** 87.946** 0.967 Year 69.900 7.454 0.983 9.378** Cervical sprain (Constant) -155,514.200 15,703.270 -9.903** 98.326** 0.970 Year 77.200 7.785 0.985 9.916**
Other sprains (Constant) -47,554.400 5,905.829 -8.052** 64.964** 0.956
Year 23.600 2.928 0.978 8.060**
Vertebral stenosis (Constant) -38,692.200 12,137.808 -3.188* 10.180* 0.772
Year 19.200 6.018 0.879 3.191* Spondylosis (Constant) -17,722.400 7,622.020 -2.325 5.423 0.644 Year 8.800 3.779 0.802 2.329 Shoulder condition/disease (Constant) -31,417.600 6,845.927 -4.589* 21.125* 0.876 Year 15.600 3.394 0.936 4.596* Knee condition/disease (Constant) -38,483.100 3,553.205 -10.831** 117.554** 0.975 Year 19.100 1.762 0.987 10.842** Scoliosis (Constant) -10,676.100 5,063.970 -2.108 4.456 0.598 Year 5.300 2.511 0.773 2.111
Vertebral fracture (Constant) -5,035.900 1,902.834 -2.647 7.022 0.701
Year 2.500 0.943 0.837 2.650
Other fractures (Constant) -5,843.100 953.197 -6.130** 37.657** 0.926
Year 2.900 0.473 0.962 6.137**
*p < 0.05, **p < 0.01, ***p < 0.001.
to using Korean medicine, and that Korean medicine is sufficiently performing the role of an alternative to Western medicine. In addition, the increase of the number of patients using both Western medicine and Korean medicine indicates that patients who previously received only Western medicine treatment, are additionally receiving Korean medicine treatment, which concurs with the previous study [10].
Among the patients who used health insurance, the number of patients with medical care was 166 (3.7%), showing a decrease in the number of patients in 2017, and a gradual increase since then. The number of patients using health insurance without medical care was 4,325 (96.3%), showing an increase of 386.1 patients per year. The ratio of patients using medical care was low but gradually increasing, and this is thought to be the result of the total number of patients in the near poverty group who receive Korean medicine treatment as a benefit by the state being small. However, it seems to be gradually increasing over the 5 years.
Conditions/diseases are classified as injury or sickness, and whether it is identified as injury depends on the presence of a
reasonable cause-and-effect relationship. Other condition/diseases with past symptoms are categorized as sickness. Among the patients who visited the hospital for the first time, the number of patients with an injury was 2,415 (41.5%), and showed an increase of 196.7 patients per year. The number of patients who visited with sickness was 3,401 (58.5%), an increase of 297.4 patients per year. The main form of the existing medical service was the treatment of the condition/disease. In recent times, the development of technology, and diversity of careers may have created more possibilities of accidents, and the number of patients visiting hospitals with injuries is on the rise considerably, compared with the number of patients visiting with sicknesses [11]. In this study, the result showed the number and rate of increase of patients with sicknesses was greater than those patients with injuries, but the number and the rate of increase of patients visiting with injuries was also on the rise. These results are thought to show the recognition of Korean medicine treatment has expanded to the treatment of injuries from simple convalescence, chronic condition/disease, and strength enhancement [12].
In recent times, most patients who visit Korean medicine hospitals belong to condition/disease code M which is “condition/ disease of musculoskeletal system and connective tissue,” and condition/disease codes S and T which are “other specific result of injury, intoxication, and external cause.” As shown in a previous study [13] patients who visited local clinics to be treated using the M, S, or T codes consisted of 40% of the total patients. In the Department of Acupuncture and Moxibustion Medicine, DaeJeon Korean Medicine hospital, DaeJeon University, most patients visited with complaints including pain, joint illness, and paralysis. Among the illnesses 16 groups of frequently presented conditions/ diseases were categorized, and the number of first visit patients belonging to the 16 groups was 5,061 (87.0%) out of a total of 5,816 patients.
Amongst the 16 groups of frequently presented conditions/ diseases, there were 991 patients (17.0%) who were categorized into the sprain and strain of the cervical spine category ranking first, followed by 145 patients (13.7%) who belonged to the sprain and strain of the lumbar spine, 632 patients (10.9%) with lumbar herniation of the intervertebral disk, and 557 patients (9.7%) with facial paralysis. It can be observed that the demand is high in conditions/diseases of the vertebrae, joint, and paralysis. The increase was also high in sprain and strain of the cervical spine (77.2 patients), followed by lumbar herniation of the intervertebral disk (50.3 patients), and facial paralysis (45.1 patients).
In case of sprains and strains, most patients were involved in a traffic accident. It is possible to conjecture the increase of patients choosing alternative medicine rather than Western medicine was associated with automobile insurance policies [10]. In case of vertebral conditions/diseases, surgical treatment is recommended for severe symptoms, and a poor prognosis. However, in some cases Korean medicine treatment can be performed as conservative care before surgery, and the number of patients who seek Korean medicine for the purpose of rehabilitation after surgery is increasing [14]. Demand for Korean medicine in a study was high in conditions/diseases that were not completely cured after using Western medicine surgery and drugs [15]. Therefore, the number of patients who receive Korean medicine treatment for pain conditions/diseases is gradually increasing. In the case of facial paralysis, more patients are visiting Korean medicine hospitals whilst taking steroids for a better, and faster recovery.
The statistics on frequently presented condition/diseases showed that the tendency for visiting Korean medicine hospitals switched from the previous painful illnesses, chronic condition/ diseases, anti-aging, lifestyle condition/diseases to conservative
Fig. 6. Linear regression of number of patients by year according to condition/disease code (16 types).
care for a specific diagnosis, treatment of injury, or rehabilitation after surgery. The number of patients seeking Korean medicine treatment is on the rise.
This study statistically analyzed patients who visited the Department of Acupuncture and Moxibustion Medicine, DaeJeon Korean medicine hospital, DaeJeon University in the past 5 years. However, this study used medical data from a single department at a single hospital, so it is difficult to generalize to the total condition/ disease prevalence, or actual use of Korean medicine hospitals within a region or nationally. However, the tendencies of patients visiting Korean medicine institutions can be identified through this study and be used to guide the direction of future medical service. It provides basic data for qualifying medical treatment and can be used as an index for patients’ tendencies for visiting Korean medicine institutions, to be considered when making decisions for future studies or governmental policies for Korean medicine hospitals. Further study on the sociodemographic characteristics and usage of Korean medicine treatment is warranted.
Conflicts of Interest
The authors have no conflicts of interest to declare.
References
[1] Korean Acupuncture Medical Society Textbook Compilation Committee. The Acupuncture and Moxibustion Medicine. Seoul (Korea): Jipmoondang; 2012. p. 5-11, 625-631. [in Korean].
[2 Kim HS, Kim SY, Kim JH, Kim YI. The Analysis on Annual Utilization Patterns of Inpatients in Korean Medical Hospitals for the Past 10 years. J Acupunct Res 2016;33:61-76. [in Korean].
[3] Park KS, Lee JH, Chung SH. The Statistical Study of Hospitalized Spinal Disease Patients. J Orient Rehabil Med 2006;16:73-81. [in Korean]. [4] Hong KE. Prevalence and Treatment Pattern of Korean Patients with Facial
Palsy. J Korean Acupunct Moxib Soc 2010;27:137-146. [in Korean]. [5] Health Insurance Review & Assessment Service [Internet]. 2019 [cited
2021 Mar 20]. Available from: https://opendata.hira.or.kr/op/opc/ selectStcPblcList.do. [in Korean].
[6] Yoon KJ. Annual Utilization Patterns and perception of Koreans. Issue Focus 2012;140:1-8. [in Korean].
[7] Jeon KS, Choi ES, Lee HY. Study of Gender Differences and Influencing Factors in Medical Use. J Korean Acad Public Health Nurs 2010;24:182-196. [in Korean].
[8] KIM CD [Dissertation]. Study on Managing the Medical Expenses Caused by Population Aging. Dong-A University; 2019. [in Korean].
[9] Shin JE. Determinants of System Satisfaction with the National Health Insurance in Korea: Evidence from the Korea Welfare Panel Survey. Korean J Health Econ Policy 2009;15:21-44. [in Korean].
[10 Lee CS, Lee HJ, Chae JM. A Study on the Analysis of Factors for the Increase of Oriental Medicine Expenditure in the Automobile Insurance. Korea Acad Ind Coop Soc 2019;20:121-130. [in Korean].
[11] Choi BG. A study on correlation between disease and accidental death. Korean Insur Law Assoc 2018;12:207-228. [in Korean].
[12] Chung SH, Lee SM, Jeon JH, Kim JH, Kim YI. The Research about Recognition and Satisfaction on Korean Medicine. Res Inst Korean Med 2013;22:105-118. [in Korean].
[13] Moon JH, Park JJ, Ko SW, Kim KT, Shin SM, Go H. Single Hospital-based Clinical Analysis of Inpatients and Outpatients in the Korean Hospital. J Int Korean Med 2013;7:21-47. [in Korean].
[14] Rankine JJ. The postoperative spine. Semin Musculoskelet Radiol 2014;18:300-308.
[15] Kang BJ, Chae BJ, Kwon DH, Kim PT, Kim JS. Survey on the Understanding of Modern vs. Oriental Medicine in Korea. J Korean Soc Biol Ther Psychiatry 1999;5:158-166. [in Korean].