R E S E A R C H A R T I C L E
Open Access
The effect of aircraft noise on sleep
disturbance among the residents near
a civilian airport: a cross-sectional study
Kyeong Min Kwak
1,2, Young-Su Ju
1*, Young-Jun Kwon
1, Yun Kyung Chung
1, Bong Kyu Kim
1,2, Hyunjoo Kim
3and Kanwoo Youn
4Abstract
Background: Aircraft noise is a major environmental noise problem. This study was conducted in order to investigate the relationship between sleep disturbance and exposure to aircraft noise on the residents who are living near an airport.
Methods: There were 3308 residents (1403 in the high exposure group, 1428 in the low exposure group, and 477 in the non-exposure group) selected as the subjects for this study. The Insomnia severity Index (ISI) and Epworth Sleepiness Scale (ESS) questionnaires were used to evaluate sleep disturbance.
Results: The mean ISI and ESS scores were 6.9 ± 6.4 and 5.5 ± 3.7, respectively, and the average scores were significantly greater in the aircraft noise exposure group, as compared to the non-exposure group. The percentage of the abnormal subjects, which were classified according to the results of the ISI and ESS, was also significantly greater in the noise exposure group, as compared to the control group. The odd ratios for insomnia and daytime hypersomnia were approximately 3 times higher in the noise exposure group, as compared to the control group. Conclusions: The prevalence of insomnia and daytime hypersomnia was higher in the aircraft noise exposure group, as compared to the control group. Further study is deemed necessary in order to clarify the causal relationship.
Keywords: Aircraft, Noise, Sleep disturbance, Insomnia, Daytime hypersomnia Background
Noise is defined as any unwanted, or mentally or physic-ally harmful sound [1]. As described in its definition, noise involves psychological factors as well as physiological fea-tures. As a result, it may unfavorably affect a person’s hearing ability or cause various health problems, such as hypertension [2], myocardial infarction [3], psychological disease [4], and sleep disturbance [5].
With the rapid growth of air traffic, aircraft noise has recently become a major environmental noise problem. The aircraft noise can affect a person’s hearing ability [6], blood pressure [7], mental health [8], and sleep quality [9, 10]. A continuous exposure to aircraft noise
increases the frequency of waking up during sleep and decreases slow-wave sleep, sometimes called deep sleep. This condition can cause a decreased quality of sleep and sleep disturbance [9]. Sleep disturbance is an im-portant health issue and it has been associated with other health problems [10]. Sleep deprivation, which is caused by sleep disturbance, is related to obesity, hyper-tension, diabetes, cardiovascular disease, depression,
and increased risk of mortality [11–15]. Many studies
have been conducted on the effect of aircraft noise on sleep [16, 17]; however, the population sizes of most studies are insufficient. There are only a few studies conducted in the large populations of more than 1000 subjects [18, 19]. Large population studies that directly evaluate sleep disturbance have not sufficiently sup-ported the clear correlation between noises and sleep disturbance.
* Correspondence:[email protected]
1Department of Occupational and Environmental Medicine, Hallym University
Sacred Heart Hospital, Anyang, South Korea
Full list of author information is available at the end of the article
© 2016 The Author(s). Open Access This article is distributed under the terms of the Creative Commons Attribution 4.0 International License (http://creativecommons.org/licenses/by/4.0/), which permits unrestricted use, distribution, and reproduction in any medium, provided you give appropriate credit to the original author(s) and the source, provide a link to the Creative Commons license, and indicate if changes were made. The Creative Commons Public Domain Dedication waiver (http://creativecommons.org/publicdomain/zero/1.0/) applies to the data made available in this article, unless otherwise stated.
This study conducted a survey on more than 3000 subjects by using a structured questionnaire. The pur-pose of this study is to investigate the relationship be-tween sleep disturbance and exposure to aircraft noise on residents who are living near an airport.
Methods
Noise measurement
This study did not measure the aircraft noise level dir-ectly, but instead, we used the result of the aircraft noise measurement in the official announcement of the Seoul Regional Aviation Administration (SRAA) [20] that was issued on October 8, 2010. This announce-ment was based on the noise measureannounce-ment of the areas near the Gimpo International Airport that was per-formed by noise specialists in 2008. For this measure-ment, 50 sites were chosen to measure the aircraft noise, and the Weighted Equivalent Continuous Perceived Noise Level (WECPNL) was used as the noise metric. The WECPNL was recommended by the International Civil Aviation Organization (ICAO) for measuring the aircraft noise [21]. The WECPNL used in Korea is defined as follows [22]:
WECPNL ¼ LA þ 10 log Nð 2 þ 3N3 þ 10 Nð 1 þ N4ÞÞ − 27;
where LA is the energy mean of all maximum aircraft
noise level during daytime. N1 is the number of flight
events during midnight from 00:00 to 07:00, N2 is the
number of events during daytime from 07:00 to 19:00, N3is the number of flight events during nighttime from
19:00 to 22:00, and N4 is the number of flight events
during late nighttime from 22:00 to 24:00.
Study subjects
This study has chosen the aircraft noise exposure areas based on the official announcement of SRAA. This announcement divided the areas near the Gimpo International Airport into
3 districts (type 1 [95+ WECPNL]), type 2 [90–95 WECPNL], and type 3 [75–90 WECPNL]) based on the air-craft noise level. There were no residents living in type 1 and 2 districts. The type 3 district was divided again into 3 sub-districts (‘Ga’ [85–90 WECPNL], ‘Na’ [80–85 WECPNL],
and‘Da’ [75–80 WECPNL]).
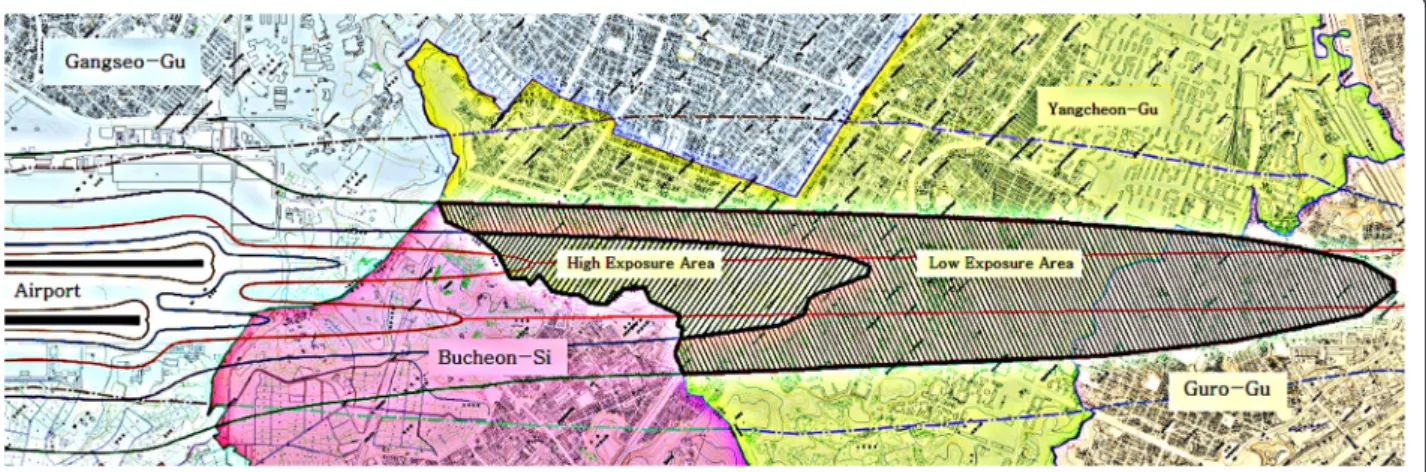
According to this official announcement by SRAA, the areas in Seoul City near the Gimpo International Airport, which required measurement for noise monitoring, were selected for this study. This study classified‘Ga’ and ‘Na’ into a high noise exposure group (80-90 WECPNL) and ‘Da’ into a low noise exposure group (75-80 WECPNL) (Fig. 1). ‘A’-dong was selected as the control area with similar demographic, socioeconomic, and geologic charac-teristics, and without aircraft noise, as it is far from the airport. However, the control area did not have a noise measurement result.
This study was conducted as a door-to-door visit by the researchers from March to April 2015 in order to investigate the effect of aircraft noise on the health of the residents living near the Gimpo International Airport. Adults, who are 20 years old and above, were included in the study, but those who are older than 75 years old were excluded. A total of 3531 residents (1516 in the high exposure group, 1515 in the low ex-posure group, and 500 in the non-exex-posure group) participated in this survey. The 166 residents (61 in the high exposure group, 90 in the low exposure group, and 15 in the non-exposure group), who had been treated for depression within 1 year, were ex-cluded from the study. In addition, 57 residents (27 in the high exposure group, 22 in the low exposure group, and 8 in the non-exposure group), whose questionnaire missed a significant amount of informa-tion, were also excluded from the study. Finally, 3308 residents (1428 in the high exposure group, 1403 in the low exposure group, and 477 in the non-exposure group) were selected as subjects for the analysis.
Survey tool
Survey tools for insomnia and daytime hypersomnia were used to evaluate sleep disturbance. The Insomnia Severity Index (ISI) [23, 24] was used to measure in-somnia. The ISI is a self-reported questionnaire that consists of 7 questions for evaluating the difficulties of
sleep onset and sleep maintenance, satisfaction with current sleep pattern, interference with daily function-ing, noticeability of impairment attributed to the sleep problem, and degree of distress or concern caused by the sleep problem. Each question is scored between 0 and 4, and a higher score means a more severe status. The
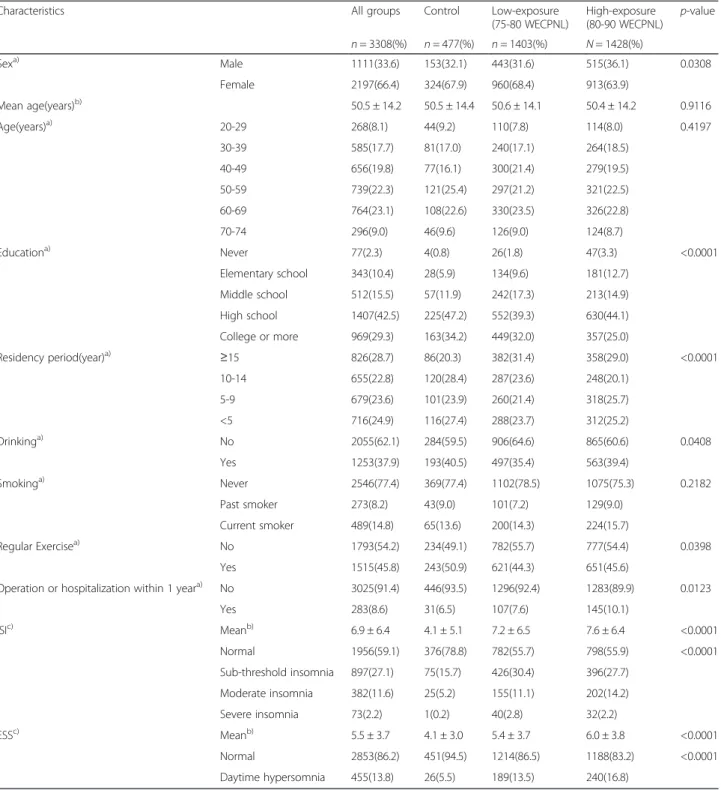
Table 1 General characteristics and Insomnia Severity Index (ISI)/Epworth Sleepiness Scale (ESS) results by noise exposure groups
Characteristics All groups Control Low-exposure
(75-80 WECPNL) High-exposure (80-90 WECPNL) p-value n = 3308(%) n = 477(%) n = 1403(%) N = 1428(%) Sexa) Male 1111(33.6) 153(32.1) 443(31.6) 515(36.1) 0.0308 Female 2197(66.4) 324(67.9) 960(68.4) 913(63.9) Mean age(years)b) 50.5 ± 14.2 50.5 ± 14.4 50.6 ± 14.1 50.4 ± 14.2 0.9116 Age(years)a) 20-29 268(8.1) 44(9.2) 110(7.8) 114(8.0) 0.4197 30-39 585(17.7) 81(17.0) 240(17.1) 264(18.5) 40-49 656(19.8) 77(16.1) 300(21.4) 279(19.5) 50-59 739(22.3) 121(25.4) 297(21.2) 321(22.5) 60-69 764(23.1) 108(22.6) 330(23.5) 326(22.8) 70-74 296(9.0) 46(9.6) 126(9.0) 124(8.7) Educationa) Never 77(2.3) 4(0.8) 26(1.8) 47(3.3) <0.0001 Elementary school 343(10.4) 28(5.9) 134(9.6) 181(12.7) Middle school 512(15.5) 57(11.9) 242(17.3) 213(14.9) High school 1407(42.5) 225(47.2) 552(39.3) 630(44.1) College or more 969(29.3) 163(34.2) 449(32.0) 357(25.0) Residency period(year)a) ≥15 826(28.7) 86(20.3) 382(31.4) 358(29.0) <0.0001 10-14 655(22.8) 120(28.4) 287(23.6) 248(20.1) 5-9 679(23.6) 101(23.9) 260(21.4) 318(25.7) <5 716(24.9) 116(27.4) 288(23.7) 312(25.2) Drinkinga) No 2055(62.1) 284(59.5) 906(64.6) 865(60.6) 0.0408 Yes 1253(37.9) 193(40.5) 497(35.4) 563(39.4) Smokinga) Never 2546(77.4) 369(77.4) 1102(78.5) 1075(75.3) 0.2182 Past smoker 273(8.2) 43(9.0) 101(7.2) 129(9.0) Current smoker 489(14.8) 65(13.6) 200(14.3) 224(15.7) Regular Exercisea) No 1793(54.2) 234(49.1) 782(55.7) 777(54.4) 0.0398 Yes 1515(45.8) 243(50.9) 621(44.3) 651(45.6)
Operation or hospitalization within 1 yeara) No 3025(91.4) 446(93.5) 1296(92.4) 1283(89.9) 0.0123
Yes 283(8.6) 31(6.5) 107(7.6) 145(10.1) ISIc) Meanb) 6.9 ± 6.4 4.1 ± 5.1 7.2 ± 6.5 7.6 ± 6.4 <0.0001 Normal 1956(59.1) 376(78.8) 782(55.7) 798(55.9) <0.0001 Sub-threshold insomnia 897(27.1) 75(15.7) 426(30.4) 396(27.7) Moderate insomnia 382(11.6) 25(5.2) 155(11.1) 202(14.2) Severe insomnia 73(2.2) 1(0.2) 40(2.8) 32(2.2) ESSc) Meanb) 5.5 ± 3.7 4.1 ± 3.0 5.4 ± 3.7 6.0 ± 3.8 <0.0001 Normal 2853(86.2) 451(94.5) 1214(86.5) 1188(83.2) <0.0001 Daytime hypersomnia 455(13.8) 26(5.5) 189(13.5) 240(16.8) a) By Chi-square test b) By ANOVA c)
total score is ranged between 0 and 28. A score of 0-7 is considered as normal, 8-14 is considered as sub-threshold insomnia, 15–21 is considered as moderate insomnia, and 22–28 is considered as severe insomnia. The Epworth Sleep Scale (ESS) [25] was used in order to measure daytime hypersomnia. ESS uses a scoring sys-tem from 0 to 3 to indicate the degree of drowsiness in 8 different situations. A score of 3 indicates that a per-son feels sleepy the most. The total score is ranged
from 0 to 24 and a score above 10 is considered as day-time hypersomnia.
Analysis method
A technical analysis was performed in order to investi-gate the demographic and sociological characteristics, as well as the degree of sleep disturbance of the subjects. ANOVA and Chi-square test were used to investigate if there was any difference in the demographic and
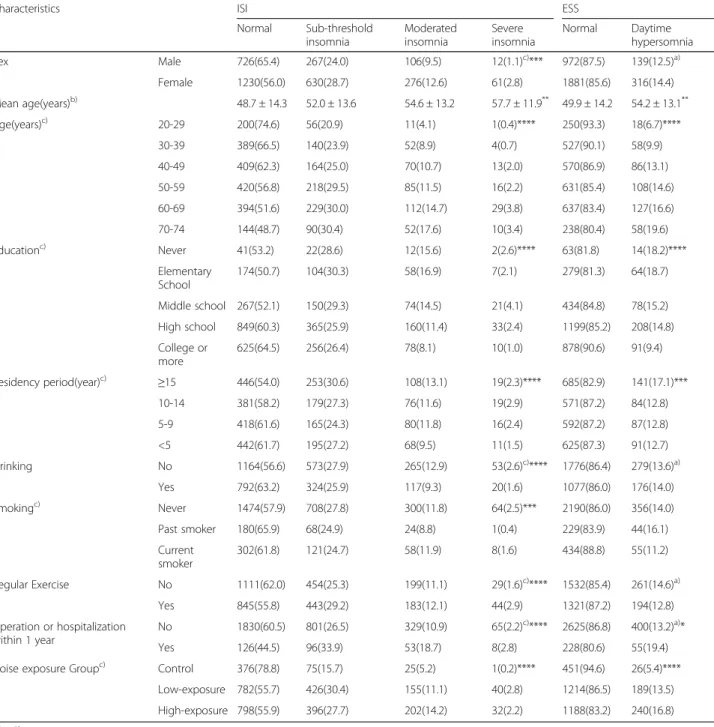
Table 2 Insomnia Severity Index (ISI)/Epworth Sleepiness Scale (ESS) according to subject characteristics
Characteristics ISI ESS
Normal Sub-threshold insomnia Moderated insomnia Severe insomnia Normal Daytime hypersomnia Sex Male 726(65.4) 267(24.0) 106(9.5) 12(1.1)c)*** 972(87.5) 139(12.5)a) Female 1230(56.0) 630(28.7) 276(12.6) 61(2.8) 1881(85.6) 316(14.4) Mean age(years)b) 48.7 ± 14.3 52.0 ± 13.6 54.6 ± 13.2 57.7 ± 11.9** 49.9 ± 14.2 54.2 ± 13.1** Age(years)c) 20-29 200(74.6) 56(20.9) 11(4.1) 1(0.4)**** 250(93.3) 18(6.7)**** 30-39 389(66.5) 140(23.9) 52(8.9) 4(0.7) 527(90.1) 58(9.9) 40-49 409(62.3) 164(25.0) 70(10.7) 13(2.0) 570(86.9) 86(13.1) 50-59 420(56.8) 218(29.5) 85(11.5) 16(2.2) 631(85.4) 108(14.6) 60-69 394(51.6) 229(30.0) 112(14.7) 29(3.8) 637(83.4) 127(16.6) 70-74 144(48.7) 90(30.4) 52(17.6) 10(3.4) 238(80.4) 58(19.6) Educationc) Never 41(53.2) 22(28.6) 12(15.6) 2(2.6)**** 63(81.8) 14(18.2)**** Elementary School 174(50.7) 104(30.3) 58(16.9) 7(2.1) 279(81.3) 64(18.7) Middle school 267(52.1) 150(29.3) 74(14.5) 21(4.1) 434(84.8) 78(15.2) High school 849(60.3) 365(25.9) 160(11.4) 33(2.4) 1199(85.2) 208(14.8) College or more 625(64.5) 256(26.4) 78(8.1) 10(1.0) 878(90.6) 91(9.4) Residency period(year)c) ≥15 446(54.0) 253(30.6) 108(13.1) 19(2.3)**** 685(82.9) 141(17.1)*** 10-14 381(58.2) 179(27.3) 76(11.6) 19(2.9) 571(87.2) 84(12.8) 5-9 418(61.6) 165(24.3) 80(11.8) 16(2.4) 592(87.2) 87(12.8) <5 442(61.7) 195(27.2) 68(9.5) 11(1.5) 625(87.3) 91(12.7) Drinking No 1164(56.6) 573(27.9) 265(12.9) 53(2.6)c)**** 1776(86.4) 279(13.6)a) Yes 792(63.2) 324(25.9) 117(9.3) 20(1.6) 1077(86.0) 176(14.0) Smokingc) Never 1474(57.9) 708(27.8) 300(11.8) 64(2.5)*** 2190(86.0) 356(14.0) Past smoker 180(65.9) 68(24.9) 24(8.8) 1(0.4) 229(83.9) 44(16.1) Current smoker 302(61.8) 121(24.7) 58(11.9) 8(1.6) 434(88.8) 55(11.2) Regular Exercise No 1111(62.0) 454(25.3) 199(11.1) 29(1.6)c)**** 1532(85.4) 261(14.6)a) Yes 845(55.8) 443(29.2) 183(12.1) 44(2.9) 1321(87.2) 194(12.8) Operation or hospitalization within 1 year No 1830(60.5) 801(26.5) 329(10.9) 65(2.2)c)**** 2625(86.8) 400(13.2)a)* Yes 126(44.5) 96(33.9) 53(18.7) 8(2.8) 228(80.6) 55(19.4)
Noise exposure Groupc) Control 376(78.8) 75(15.7) 25(5.2) 1(0.2)**** 451(94.6) 26(5.4)****
Low-exposure 782(55.7) 426(30.4) 155(11.1) 40(2.8) 1214(86.5) 189(13.5) High-exposure 798(55.9) 396(27.7) 202(14.2) 32(2.2) 1188(83.2) 240(16.8) a) By Chi-square test b) By ANOVA c)
By Mantel-Haeszel Chi-square test
sociological characteristics between the groups. The Mantel-Haenszel Chi-square test was performed to in-vestigate if the demographic and sociological characteris-tics, as well as the degree of noise exposure, were related to insomnia or daytime hypersomnia. In addition, the results that showed a significance in the univariate analysis (age, sex, education level, residency period, smoking, drinking, exercise, and medical his-tory) were corrected by using a multiple logistic re-gression model. The odds ratio and 95 % confidence
interval were obtained for the effect of the exposure degree on insomnia and daytime hypersomnia.
Results
General characteristics of the subjects
There were 3308 subjects, and their characteristics were analyzed by using a frequency analysis. The female subjects accounted for 66.4 % among the entire jects, which were twice the number of the male sub-jects. The mean age of the subjects was 50.5 years old. Based on the age groups, 764 (23.1 %) subjects aged 60–69 years old accounted for the majority of the sub-jects, closely followed by the group with 739 (22.3 %) subjects aged 50–59 years old. For the education level, high school drop-out or graduate took up the greatest portion with a total of 1407 subjects (42.5 %). For the residency period, the greatest number of subjects, which was 826 (28.7 %), had lived for over 15 years in their residences.
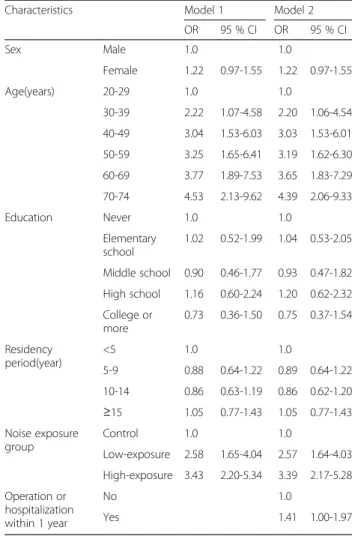
Table 3 Multiple logistic regression model for Insomnia Severity Index (ISI) according to subject characteristics
Characteristics Model 1 Model 2
OR 95 % CI OR 95 % CI Sex Male 1.0 1.0 Female 1.54 1.31-1.81 1.57 1.24-1.97 Age(years) 20-29 1.0 1.0 30-39 1.39 0.95-2.04 1.40 0.95-2.06 40-49 1.74 1.22-2.50 1.73 1.21-2.49 50-59 2.27 1.59-3.25 2.17 1.51-3.12 60-69 2.97 2.05-4.30 2.76 1.89-4.02 70-74 3.88 2.52-5.98 3.64 2.35-5.65 Education Never 1.0 1.0 Elementary school 1.07 0.64-1.77 1.09 0.65-1.81 Middle school 1.22 0.74-2.01 1.25 0.76-2.07 High school 1.15 0.70-1.89 1.19 0.73-1.96 College or more 1.17 0.69-1.96 1.18 0.73-1.98 Residency period(year) <5 1.0 1.0 5-9 0.93 0.75-1.16 0.93 0.75-1.16 10-14 1.02 0.82-1.27 1.01 0.81-1.26 ≥15 0.96 0.77-1.19 0.96 0.77-1.19 Noise exposure group Control 1.0 1.0 Low-exposure 3.45 2.64-4.50 3.41 2.61-4.46 High-exposure 3.24 2.48-4.22 3.26 2.50-4.25 Drinking No 1.0 Yes 0.98 0.82-1.16 Smoking Never 1.0 Past smoker 0.86 0.62-1.21 Current smoker 1.16 0.88-1.53 Regular Exercise No 1.0 Yes 1.25 1.07-1.45 Operation or hospitalization within 1 year No 1.0 Yes 1.75 1.37-2.25
Table 4 Multiple logistic regression model for Epworth Sleepiness Scale (ESS) according to subject characteristics
Characteristics Model 1 Model 2
OR 95 % CI OR 95 % CI Sex Male 1.0 1.0 Female 1.22 0.97-1.55 1.22 0.97-1.55 Age(years) 20-29 1.0 1.0 30-39 2.22 1.07-4.58 2.20 1.06-4.54 40-49 3.04 1.53-6.03 3.03 1.53-6.01 50-59 3.25 1.65-6.41 3.19 1.62-6.30 60-69 3.77 1.89-7.53 3.65 1.83-7.29 70-74 4.53 2.13-9.62 4.39 2.06-9.33 Education Never 1.0 1.0 Elementary school 1.02 0.52-1.99 1.04 0.53-2.05 Middle school 0.90 0.46-1.77 0.93 0.47-1.82 High school 1.16 0.60-2.24 1.20 0.62-2.32 College or more 0.73 0.36-1.50 0.75 0.37-1.54 Residency period(year) <5 1.0 1.0 5-9 0.88 0.64-1.22 0.89 0.64-1.22 10-14 0.86 0.63-1.19 0.86 0.62-1.20 ≥15 1.05 0.77-1.43 1.05 0.77-1.43 Noise exposure group Control 1.0 1.0 Low-exposure 2.58 1.65-4.04 2.57 1.64-4.03 High-exposure 3.43 2.20-5.34 3.39 2.17-5.28 Operation or hospitalization within 1 year No 1.0 Yes 1.41 1.00-1.97
A total of 1253 (37.9 %) subjects answered that they drink, while 489 (14.8 %) subjects answered that they are current smokers. A great number of subjects (1515, 45.8 %) answered that they exercise regularly. There were 283 (8.6 %) subjects who had been hospitalized or had undergone operations in the previous year.
Comparison of general characteristics by noise exposure groups
For sex, the male subjects accounted for a significantly greater portion in the high exposure group (36.1 %) than the low exposure group (31.4 %) and the control group (32.1 %). The mean age and age distribution did not show any significant difference between the groups.
The education level results showed that the subjects, who received a high school education level or an even higher education, were smaller in numbers in the high exposure group and low exposure group, as compared to the control group (69.1 % vs 71.3 % vs 81.4 %), and the difference was statistically significant. For the resi-dency period, 29.0 % of the subjects in the high exposure group and 31.4 % in the low exposure group lived in the area for 15 years or longer, which was significantly higher than that of the control group (20.3 %). For the drinking factor, 39.4 % of the subjects in the high expos-ure group and 40.5 % in the control group answered that they drink, which was significantly higher than that of the low exposure group (35.4 %). There was no signifi-cant difference in the results for the smoking factor between the groups. The 45.6 % of the subjects in the high exposure group and 44.3 % of the subjects in the low exposure group answered that they exercise regu-larly, which was significantly lower than that of the control group (50.9 %). The 10.1 % of the subjects in the high exposure group had been hospitalized or had undergone operations in the previous year, which was sig-nificantly higher than that of the low exposure group (7.6 %) and the control group (6.5 %).
Comparison of ISI and ESS results by the noise exposure groups
The mean score of the ISI in all subjects was 6.9 ± 6.4. There were 1956 (59.1 %) subjects in the normal group, 897 (27.1 %) subjects in the sub-threshold insomnia group, 382 (11.6 %) subjects in the moderate insomnia group, and 73 (2.2 %) subjects in the severe insomnia group. The mean score of ESS was 5.5 ± 3.7. There were 2853 (86.2 %) subjects in the normal group, and 455 (13.8 %) subjects in the daytime hypersomnia group.
The ISI scores of the three groups were compared, and the results showed that the mean score increased from the control group to the high exposure group, thereby showing 4.1 ± 5.1 in the control group, 7.2 ± 6.5 in the low exposure group, and 7.6 ± 6.4 in the high exposure group. The post-hoc results showed that the difference of the scores between the control group and low exposure group, and between the control group and high exposure group were statistically significant. The percentage of the subjects with moderate or severe insomnia increased from the control group to high exposure group, thereby showing 26 (5.4 %) for the control group, 195 (13.9 %) for the low exposure group, and 234 (16.4 %) for the high exposure group. The Mantel-Haenszel Chi-square test results showed that the percentage of the subjects with insomnia had a sta-tistically significant difference among the groups.
Likewise, the ESS scores of the three groups were compared, and the results showed that the mean score also increased from the control group to the high expos-ure group, thereby showing 4.1 ± 3.0 in the control group, 5.4 ± 3.7 in the low exposure group, and 6.0 ± 3.8 in the high exposure group. The post-hoc analysis re-sults showed that the difference between all groups were statistically significant. The percentage of the subjects with daytime hypersomnia increased from the control group to high exposure group, thereby showing 26 (5.5 %) for the control group, 189 (13.5 %) for the low exposure group, and 240 (16.8 %) for the high exposure group. The Mantel-Haenszel Chi-square test results showed that the percentage of the subjects with day-time hypersomnia had a statistically significant differ-ence among the groups (Table 1).
Comparison of ISI and ESS results by the characteristics of the subjects
The percentages of the subjects, who were considered as having sub-threshold insomnia, moderate insomnia, and severe insomnia based on ISI, were significantly higher in females (28.7 %, 12.6 %, and 2.8 %, respectively) than in males. The subjects with more severe insomnia showed greater mean age. Likewise, the percentages of the older subjects, who were considered as having sub-threshold insomnia, moderate insomnia, and severe insomnia, were
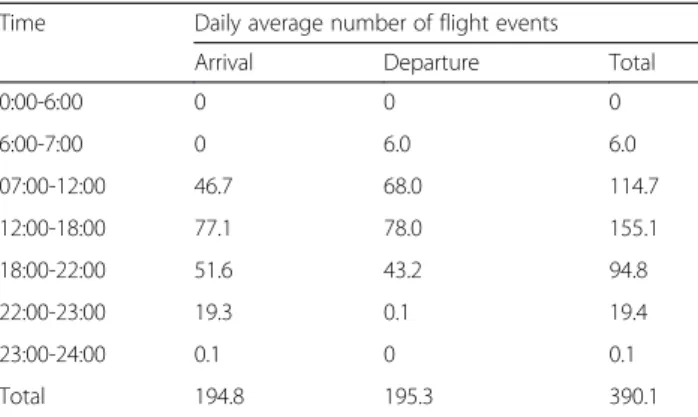
Table 5 Daily average number of flight events in Gimpo International Airport (2015. 3. ~ 2015. 4.)
Time Daily average number of flight events
Arrival Departure Total
0:00-6:00 0 0 0 6:00-7:00 0 6.0 6.0 07:00-12:00 46.7 68.0 114.7 12:00-18:00 77.1 78.0 155.1 18:00-22:00 51.6 43.2 94.8 22:00-23:00 19.3 0.1 19.4 23:00-24:00 0.1 0 0.1 Total 194.8 195.3 390.1
higher than the younger subjects. The lower education level was associated with a high percentage of the subjects with insomnia, thereby disregarding the subjects with no education. The subjects, who have lived longer in the area, showed more insomnia. Meanwhile, the subjects, who had been hospitalized or had undergone operations in the previous year, had more insomnia. The subjects who are non-smokers and non-drinkers, as well as the subjects who exercise regularly, had more insomnia.
Based on the ESS, the percentage of the subjects suf-fering from daytime hypersomnia was 14.4 % in fe-males, which was significantly higher than in males. The subjects with daytime hypersomnia showed greater mean age. The older subjects also showed more day-time hypersomnia. The lower education level was asso-ciated with a high percentage of subjects with daytime hypersomnia. The subjects, who have lived longer in the area, showed more daytime hypersomnia. Mean-while, the subjects, who had been hospitalized or had undergone an operation in the previous year, showed more insomnia. No statistically significant relationship be-tween smoking, drinking, exercise, and daytime hyper-somnia was confirmed (Table 2).
Multiple logistic regression for insomnia and daytime hypersomnia
The variables that showed significance in the univariate analysis were corrected by using the multiple logistic regression model. The odds ratio and 95 % confidence interval for the degree of noise exposure and sleep disturbance were obtained. For insomnia, the variables, including sex, age, education level, and residency period, were corrected in the first regression model. The other variables, including operation and hospitalization history for the previous year, smoking, drinking, and regular exercise performance, were additionally corrected in the second model.
The risk of insomnia was 3.45 times (95 % CI 2.64-4.50) higher in the low exposure group and 3.24 times (95 % CI 2.48-4.22) higher in the high exposure group, as compared to that of the control group. The risk of insomnia was 3.41 times (95 % CI 2.61-4.46) higher in the low exposure group and 3.26 times (95 % CI 2.50-4.25) in the high exposure group after additionally cor-recting the factors of operation and hospitalization his-tory, smoking, drinking, and regular exercise (Model 2), as compared to that of the control group. The female subjects showed a significantly greater risk of insomnia than the males in both Model 1 (OR 1.51, 95 % CI 1.30-1.77) and Model 2 (OR 1.55, 95 % CI 1.24-1.94). The older aged group had a greater risk of insomnia than the younger aged group, and the odds ratio increased with age. However, the risk of insomnia was not signifi-cantly different according to the education level and
residency period in both Models 1 and 2. The risk of insomnia was 1.71 times (95 % CI 1.35-2.17) greater in the subjects, who had been hospitalized or had undergone operations in the previous year, than the subjects who had not. For the lifestyle habits, the risk of insomnia was not significantly different according to smoking or drinking factors. However, the subjects who regularly exercised had 1.3 times (1.12-1.50) greater risk of insomnia than those who do not (Table 3).
For daytime hypersomnia, the variables that showed significance in the univariate analysis were also corrected by using a multiple logistic regression model. The vari-ables, including sex, age, education level, and residency period, were corrected in the first regression model. Another variable of operation and hospitalization history for the previous year was additionally corrected in the second model. The results showed a similar pattern as those in the multivariate analysis of insomnia. The risk of daytime hypersomnia was 2.58 times greater (95 % 1.65-4.04) in the low exposure group and 3.43 times greater (95 % CI 2.20-5.34) in the high exposure group, as compared to the control group. In Model 2, the risk of daytime hypersomnia was still greater in the low and high exposure groups, 2.57 times (95 % CI 1.64-4.03) and 3.39 times (95 % CI 2.17-5.28), respectively, as compared to the control group even after the additional variable of the operation and hospitalization history in the previous year has been corrected. The odds ratio of Model 2 was similar to that of Model 1. The female sub-jects showed a greater risk of daytime hypersomnia than the males in both Model 1 (OR 1.30, 95 % CI 1.03-1.63) and Model 2 (OR 1.29, 95 % CI 1.03-1.62). The older subjects had a greater risk of daytime hypersomnia, as shown in the results for insomnia. The odds ratio in-creased with age. The risk of daytime hypersomnia was 1.41 times greater (95 % CI 1.02-1.93) in the subjects, who had been hospitalized or had undergone operations in the previous year, than those who had not (Table 4).
Discussion
The subjects within the exposed area showed a signifi-cantly higher mean of ISI than the subjects within the non-exposed area. The ESS mean also showed signifi-cantly higher results in the subjects within the exposed area than the subjects within the non-exposed area. The percentage of insomnia and daytime hypersomnia, which were classified according to the results of the ISI and ESS, was also significantly greater in the sub-jects within the exposed area than the subsub-jects within the non-exposed area. The multiple logistic regression model reflecting the corrected variables, including sex, age, education level, residency period, lifestyle habits, operation, and hospitalization history, showed approxi-mately 3 times higher risk of insomnia and daytime
hypersomnia in the subjects within the exposed area than the subjects within the non-exposed area. In summary, the degree of noise exposure and sleep disturbance showed significant association based on the results.
The number of aircraft arrivals and departures by time from Gimpo International Airport can be found from the Airport Statistics [26] that was published by the Korea Airports Corporation. The average number of flight events daily was 51.6 in the evening from 18:00 to 22:00, and 19.5 after 22:00 during this study period between March and April of 2015. The air services during the evening and nighttime change the depth of sleep, maintain wakefulness, and disturb the process of falling into sleep [27]. This study used WECPNL as the noise metric. The WECPNL is an appropriate metric for reflecting the impact on sleep because the flight events during the evening and night-time are weighted in this metric. As a result, it can be assumed that the air traffic has a direct impact on the sleep pattern of the residents in the area, where the survey was performed, thereby increasing the risk of sleep disturbance (Table 5).
The previous studies have confirmed that continuous exposure to noise can increase the risk of sleep disturb-ance [28–31]. There are a few studies that evaluated the relationship between aircraft noise and sleep dis-turbance, including a community-based cross-sectional study, which is similar to this study, that was conducted by Kim et al. [9]. The sleep quality of the residents adjacent to the airport was evaluated by using the Pittsburgh Sleep Quality Index (PSQI) [32]. The results showed that the quality of sleep was poor in the resi-dents, who were exposed to the aircraft noise, and there was a greater risk of sleep disturbance.
Sleep is also influenced by the sex and age of a person [33]. In this study, female and older subjects showed significant results in terms of their association with sleep disturbance. The prevalence of sleep disturbance showed a difference according to the education level and resi-dency period of the subjects in the univariate analysis. However, the multiple logistic regression model results did not show a statistical significance after the adjust-ment of such variables.
The subjects, who had been hospitalized or had under-gone operations in the previous year, also showed a higher prevalence of sleep disturbance. The chronic co-morbidities and health status that may affect the sleep quality [34] and the reverse effect of sleep disturbance can also be considered. Patients with sleep disturbance are more likely to develop affective disorders [35, 36]. Likewise, the prevalence of the hospitalizations or opera-tions was greater in the noise exposure group than that in the control group. It could be considered as a health effect of the aircraft noise [6–10].
For the lifestyle habits, there was no variable that showed a significant association with the occurrence of daytime hypersomnia. In the univariate analysis, the prevalence of insomnia showed some difference based on the lifestyle habits, but only regular exercise performance showed a significance in the multivariate analysis. The subjects, who exercised regularly, showed a higher preva-lence of insomnia, which was different from the general understanding that regular exercise improves the quality of sleep [37, 38]. However, exercise near bedtime changes the circardian phase [39], increases the core body temperature [40], and increases the physiological arousal [41], which would disturb sleep. However, this study did not collect the information on the exercise time, so the re-lationship could not be confirmed. On the contrary, this is a cross-sectional study and a reverse causation can be sus-pected. It is possible that people, who experience sleep disturbance, tend to exercise more than others.
There are some limitations to this study. First, the sub-jects of the exposure group were selected based on the official announcement of the Seoul Regional Aviation Administration 5 years earlier without using a direct noise measurement. As it used the past noise level, the current exposure to the noise could not be accurately reflected, and the possibility of a misclassification could not be ruled out. Second, a subjective method was used to evaluate sleep disturbance rather than objective methods, such as EEG and polysomnography. There was a study that evaluated sleep disturbance by using EEG and polysomnography [42], but these objective methods are practically difficult to use in a large-scale epidemio-logical study. Third, other factors that might have an impact on sleep, such as drinking coffee and watching television at night, were not taken into consideration.
Despite such limitations, this was a large-scale epi-demiological study that enrolled more than 3000 subjects. It was the largest scale study among those on aircraft noise conducted in South Korea. This study was signifi-cant, as it was conducted on the residents, who live in city areas near the airport, whereas the previous studies on aircraft noise were conducted in the suburbs or towns located outside the city.
Sleep disturbance caused by aircraft noise is an im-portant public health issue. In particular, the airport, on which this study was conducted, was located near the city with residents living in the area, and this might lead to more serious problems. The air services during the evening or nighttime also have a direct impact on the sleep pattern of the residents. For this reason, appropri-ate measures need to be considered.
Conclusion
In conclusion, the prevalence of insomnia and daytime hypersomnia was higher in the residents, who are exposed
to aircraft noise, as compared to the control group. This study was significant, as it was a large-scale epi-demiological study. Further research needs to be con-ducted by using a direct measurement of the noise and objective sleep evaluation methods in order to clarify the cause-effect relationship.
Acknowledgements
This study was conducted with financial support from Seoul Metropolitan City in 2015.
Authors’ contributions
KMK analyzed the data and drafted the manuscript. YSJ suggested the study design, analyzed the data, and revised the manuscript. YJKwon collected and interpreted the data. YKC participated to analyze the data. BKK helped to draft the manuscript. HJK participated in the study design. KWY participated to collect the data. All authors read and approved the final manuscript. Competing interests
The authors declare that they have no competing interests. Author details
1
Department of Occupational and Environmental Medicine, Hallym University Sacred Heart Hospital, Anyang, South Korea.2Department of Occupational
and Environmental Health, Graduate School of Public Health, Seoul National University, Seoul, South Korea.3Department of Occupational and
Environmental Medicine, Ewha Womans University Mokdong Hospital, Seoul, South Korea.4Department of Occupational and Environmental Medicine,
Wonjin Institute for Occupational and Environmental Health Green Hospital, Seoul, South Korea.
Received: 13 March 2016 Accepted: 22 August 2016
References
1. Kim KS. Hearing Loss. In: Occupational Disease. 1st ed. Seoul: Gyechuk Munwhasa; 2007.
2. Haralabidis AS, Dimakopoulou K, Vigna-Taglianti F, Giampaolo M, Borgini A, Dudley M-L, et al. Acute effects of night-time noise exposure on blood pressure in populations living near airports. Eur Heart J. 2008;29:658–64. 3. Willich SN, Wegscheider K, Stallmann M, Keil T. Noise burden and the risk of
myocardial infarction. Eur Heart J. 2006;27:276–82.
4. Hardoy MC, Carta MG, Marci AR, Carbone F, Cadeddu M, Kovess V, et al. Exposure to aircraft noise and risk of psychiatric disorders: the Elmas survey. Soc Psychiatry Psychiatr Epidemiol. 2005;40:24–6.
5. Muzet A. Environmental noise, sleep and health. Sleep Med Rev. 2007;11:135–42. 6. Chen TJ, Chen SS, Hsieh PY, Chiang HC. Auditory effects of aircraft noise on
people living near an airport. Arch Environ Occup Health. 1997;52(1):45–50. 7. Rosenlund M, Berglind N, Pershagen G, Järup L, Bluhm G. Increased
prevalence of hypertension in a population exposed to aircraft noise. Occup Environ Med. 2001;58:769–73.
8. Tarnopolsky A, Watkins G, Hand DJ. Aircraft noise and mental health: I. Prevalence of individual symptoms. Psychol Med. 1980;10:683–98. 9. Kim SJ, Chai SK, Lee KW, Park J-B, Min K-B, Kil HG, et al. Exposure–response
relationship between aircraft noise and sleep quality: A community-based cross-sectional study. Osong Public Health Res Perspect. 2014;5:108–14. 10. World Health Organization. Night Noise Guidelines For Europe. 2009.
http://www.euro.who.int/__data/assets/pdf_file/0017/43316/E92845.pdf. Accessed 15 Jan 2016.
11. Grandner MA, Jackson NJ, Pak VM, Gehrman PR. Sleep disturbance is associated with cardiovascular and metabolic disorders. J Sleep Res. 2012;21:427–33.
12. Vgontzas AN, Liao D, Pejovic S, Calhoun S, Karataraki M, Basta M, et al. Insomnia with short sleep duration and mortality: the Penn State cohort. Sleep. 2010;33:1159–64.
13. Phillips B, Mannino DM. Do insomnia complaints cause hypertension or cardiovascular disease. J Clin Sleep Med. 2007;3:489–94.
14. Mallon L, Broman J-E, Hetta J. Relationship between insomnia, depression, and mortality: a 12-year follow-up of older adults in the community. Int Psychogeriatr. 2000;12:295–306.
15. Jones K, Rhodes DP. Aircraft noise, sleep disturbance and health effects: A review. Stationery Office. 2013. http://publicapps.caa.co.uk/docs/33/ ERCD1208.pdf. Accessed 10 Jan 2016.
16. Michaud DS, Fidell S, Pearsons K, Campbell KC, Keith SE. Review of field studies of aircraft noise-induced sleep disturbance. Acoust Soc Am. 2007; 121:32–41.
17. Perron S, Tétreault L-F, King N, Plante C, Smargiassi A. Review of the effect of aircraft noise on sleep disturbance in adults. Noise Health. 2012;14:58–67. 18. Franssen EAM, Wiechen CMAG, Nagelkerke NJD, Lebret E. Aircraft noise
around a large international airport and its impact on general health and medication use. Occup Environ Med. 2004;61:405–13.
19. Floud S, Vigna-Taglianti F, Hansell A, Blangiardo M, Houthuijs D, Breugelmans O, et al. Medication use in relation to noise from aircraft and road traffic in six European countries: results of the HYENA study. Occup Environ Med. 2011;68:518–24.
20. Seoul Regional Aviation Administration. The official announcement of Seoul Regional Aviation Administration (No. 2010-53), The alteration of the areas affected by aircraft noise in Gimpo International Airport. 2010. http://www.moi.go.kr/frt/sub/a05/gwanboMain/screen.do. Accessed 23 Dec 2014.
21. Lim C, Kim J, Hong J, Lee S, Lee S. The relationship between civil aircraft noise and community annoyance in Korea. J Sound Vib. 2007;299:575–86. 22. Lim C, Kim J, Hong J, Lee S. Effect of background noise levels on
community annoyance from aircraft noise. Acoust Soc Am. 2008;123: 766–71.
23. Bastien CH, Vallieres A, Morin CM. Validation of the Insomnia Severity Index as an outcome measure for insomnia research. Sleep Med. 2001;2:297–307. 24. Ensrud KE, Joffe H, Guthrie KA, Larson JC, Reed SD, Newton KM, et al. Effect
of escitalopram on insomnia symptoms and subjective sleep quality in healthy menopausal women with hot flashes: a randomized controlled trial. Menopause. 2012;19:848.
25. Johns MW. A new method for measuring daytime sleepiness: the Epworth sleepiness scale. Sleep. 1991;14:540–5.
26. Korea Airport Corporation. Airport Statistics. 2015. http://www.airport.co.kr/ user/www/396/stats/airportStats/jsp/LayOutPage.do. Accessed 23 Jan 2016. 27. Porter ND, Kershaw AD, Ollerhead JB. Adverse effects of night-time aircraft
noise: Civil Aviation Authority in London. 2000.
28. Jakovljević B, Belojević G, Paunović K, Stojanov V. Road traffic noise and sleep disturbances in an urban population: cross-sectional study. Croat Med J. 2006;47:125–33.
29. Marks A, Griefahn B. Associations between noise sensitivity and sleep, subjectively evaluated sleep quality, annoyance, and performance after exposure to nocturnal traffic noise. Noise Health. 2007;9:1.
30. Öhrström E. Longitudinal surveys on effects of changes in road traffic noise—annoyance, activity disturbances, and psycho-social well-being. J Acoust Soc Am. 2004;115:719–29.
31. Miedema HM, Vos H. Associations between self-reported sleep disturbance and environmental noise based on reanalyses of pooled data from 24 studies. Behav Sleep Med. 2007;5:1–20.
32. Buysse DJ, Reynolds CF, Monk TH, Hoch CC, Yeager AL, Kupfer DJ. Quantification of subjective sleep quality in healthy elderly men and women using the Pittsburgh Sleep Quality Index (PSQI). Sleep. 1991;14:331–8.
33. Thase ME. Depression and sleep: pathophysiology and treatment. Dialogues Clin Neurosci. 2006;8:217–26.
34. Katz DA, McHorney CA. The relationship between insomnia and health-related quality of life in patients with chronic illness. J Fam Pract. 2002;51:229–36.
35. Ford DE, Kamerow DB. Epidemiologic study of sleep disturbances and psychiatric disorders: an opportunity for prevention? JAMA. 1989;262(11): 1479–84.
36. Eaton WW, Badawi M, Melton B. Prodromes and precursors: Epidemiologic data for primary prevention of disorders with slow onset. Am J Psychiatry. 1995;152:967–72.
37. Youngstedt SD, Kline CE. Epidemiology of exercise and sleep*. Sleep Biol Rhythms. 2006;4:215–21.
38. Driver HS, Taylor SR. Exercise and sleep. Sleep Med Rev. 2000;4:387–402. 39. Buxton OM, Lee CW, L'Hermite-Balériaux M, Turek FW, Van Cauter E.
Exercise elicits phase shifts and acute alterations of melatonin that vary with circadian phase. Am J Physiol Regul Integr Comp Physiol. 2003; 284:R714–R24.
40. Davies C. Thermoregulation during exercise in relation to sex and age. Eur J Appl Physiol Occup Physiol. 1979;42:71–9.
41. Hauri P. Effects of evening activity on early night sleep. Psychophysiology. 1968;4:267–77.
42. Pirrera S, De Valck E, Cluydts R. Nocturnal road traffic noise: A review on its assessment and consequences on sleep and health. Environ Int. 2010;36:492–8.
• We accept pre-submission inquiries
• Our selector tool helps you to find the most relevant journal
• We provide round the clock customer support
• Convenient online submission
• Thorough peer review
• Inclusion in PubMed and all major indexing services
• Maximum visibility for your research Submit your manuscript at
www.biomedcentral.com/submit