A Doctorial Dissertation
Regulation of Tumor Necrosis Factor-Alpha
Gene Expression and Signal Transduction
during Orientia tsutsugamushi Infection
by
Ji-Hyun Yun
Department of Medicine
Graduate School
Orientia tsutsugamushi 감염 시
신호전달과 Tumor Necrosis Factor-Alpha
유전자 발현의 조절
지도교수 고 영 상
윤 지 현
이 논문을 의학 박사학위 논문으로 제출함
2006년 6월
윤지현의 의학 박사학위 논문을 인준함
심사위원장 印
위 원 印
위 원 印
위 원 印
위 원 印
Regulation of Tumor Necrosis Factor-Alpha
Gene Expression and Signal Transduction
during Orientia tsutsugamushi Infection
Ji Hyun Yun
(Supervised by Professor Young-Sang Koh)
A Thesis Submitted in Partial Fulfillment of the Requirements for the Degree of
Docotor of Philosophy
in Medicine
Date Approved:Department of Medicine
Graduate School
ABSTRACT
Orientia tsutsugamushi, an obligate intracellular bacterium, is the causative agent of scrub typhus. The disease is histopathologically characterized by inflammatory manifestations, indicating that orientiae induce mechanisms that amplify the inflammatory response. To understand the pathogenesis of scrub typhus, I examined the induction of tumor necrosis factor alpha (TNF-α) after infection with O. tsutsugamushi in mice, peritoneal macrophage, and macrophage cell line. Peak expression of TNF-α gene was observed between 4 and 8 days after infection in mice. The TNF-α mRNA were induced and showed a transitory peak for 6 to 24 h after infection in macrophage cell line. TLR4 defective mice were found to lack the ability to respond to O. tsutsugamushi as measured by secretion of TNF-α by macrophages. Western blot analysis of cell lysates indicates that extracellular signal-regulated kinase 1/2 (ERK1/2), Jun N-terminal kinase 1/2 (JNK1/2), and p38 mitogen activated protein kinases (MAPKs) become phosphorylated, and hence activated in O. tsutsugamushi-stimulated macrophages. Selective inhibitors of ERK1/2 (PD98059), JNK1/2 (SP600125), and p38 (SB203580) MAPK pathways could all completely prevent TNF-α secretion. However, these drugs did not prevent either bacterial internalization and invasion into the host cells or TNF-α processing and secretion. Host TNF-α production via p38 and JNK pathways by this bacterium was found to be regulated by post-transcriptional mechanism, mainly by translational control. In contrast, ERK pathway mainly control the transcription step of TNF-α gene expression. Orientia inactivation by heat did not abolish induction of TNF-α
production. However, inhibition of cellular invasion by treatment of host cell with cytochalasin D led to a diminished TNF-α induction, suggesting requirement of invasion by bacteria for this host cell response. In conclusion, our data indicate that MAPKs pathways are required to induce maximal TNF-α production in host cells during Orientia tsutsugamushi infection.
Key words: Orientia tsutsugamushi, TNF-α, ERK, JNK, p38, signal transduction, regulation of gene expression
CONTENTS
Page ABSTRACT ⅰ CONTENTS ⅲ LIST OF TABLE ⅴ LIST OF FIGURES ⅵ LIST OF ABBREVIATIONS ⅷ INTRODUCTION 1MATERIALS AND METHODS 8
1. Reagents 8
2. Bacteria 8
3. Mice 10
4. Cell culture and infection 11
5. Cytotoxicity test 12
6. Indirect immunofluorescent antibody (IFA) test 12
7. RNase protection assay 13
8. Semiquantitative reverse transcriptase(RT)-PCR analysis 14
9. ELISA assay 15
10. Western blot analysis 16
RESULTS 18
1.
O. tsutsugamushi
induces TNF-α gene expression2.
O. tsutsugamushi
-stimulated TNF-α production isindependent of TLR4 and LPS 21
3.
O. tsutsugamushi-
stimulated TNF-α gene expressiondoes not require eukaryotic protein synthesis 23
4. Various inhibitors block
O. tsutsugamushi
-stimulatedTNF-α secretion specifically 25
5.
O. tsutsugamushi
activates MAPKs pathwaysduring infection 31
6.
O. tsutsugamushi
-stimulated TNF-α production isregulated via ERK pathway by transcriptional mechanism but regulated via p38 or JNK pathways by
post-transcriptional and translational mechanism 34
7.
O. tsutsugamushi
induces NF-κB activation, butblockage of NF-κB activation by PDTC did not
reduce
O. tsutsugamushi
-stimulated TNF-α induction 37 8. Bacterial invasion but not viability was required for
O. tsutsugamushi
-stimulated TNF-α production 40DISCUSSION 43
REFERENCES 48
ABSTRACT IN KOREAN 55
LIST OF TABLES
Page Table 1. Effects and working concentration of inhibitors used
LIST OF FIGURES
Page
Figure 1. TNF-α mRNA exprssion in cells from infected mice
and J774A.1 19
Figure 2. Time course of TNF-α protein production 20
Figure 3. Effect of polymyxin B or TLR4 mutation on
O. tsutsugamushi
-stimulated TNF-α productionin macrophage 22
Figure 4. Effect of cycloheximide (CHX) on
O. tsutsugamushi
stimulated TNF-α gene expression in J774A.1 24
Figure 5. Effect of various inhibitors on
O. tsutsugamushi
stimulated TNF-α production in J774A.1 26
Figure 6. Effect of
O. tsutsugamushi
or/and each inhibitoron the viability of J774A.1 cells 27
Figure 7. Effect of cytochalasin D or TPCK on the bacterial
invasion into J774A.1 28
Figure 8. Effect of PD98059 or SB203580 on the bacterial
invasion into J774A.1 29
Figure 9. Effect of SP600125 on the bacterial invasion
into J774A.1 30
Figure 10. Time-dependent phosphorylation of MAPKs of
J774A.1 by
O. tsutsugamushi
infection 32Figure 11. Effects of various MAPK inhibitors on
O. tsutsugamushi
-induced phosphorylation ofPage
Figure 12. Effect of PD98059 or SB203580 on
O. tsutsugamushi
stimulated TNF-α production in J774A.1 35
Figure 13. Effect of SP600125 on
O. tsutsugamushi
-stimulatedTNF-α production 36
Figure 14. Time course of IκBα degradation during
O. tsutsugamushi
infection and effects of TPCK or PDTC onO. tsutsugamushi
-stimulated IκBαdegradation 38
Figure 15. Effect of TPCK or PDTC on
O. tsutsugamushi
stimulated TNF-α production in J774A.1 39
Figure 16. Effect of cytochalasin D (CD) or heat-inactivated
O. tsutsugamushi
(HOT) onO. tsutusgamushi
induced TNF-α production and IκBα degradationin J774A.1 42
Figure 17. Model of signaling and gene regulatory mechanisms of TNF-α biosynthesis during
O. tsutsugamushi
LIST OF ABBREVIATIONS
AP-1 Activator protein 1
ATF-2 Activating transcription factor 2
BSA Bovine serum albumin
CD Cytochalsin D
CBP CREB binding protein
CHX Cycloheximide
c-FOS v-fos oncogene cellular homolog
c-Myc Avian myelocytomatosis virus oncogene cellular
homolog
CREB cAMP response element-binding protein
DMEM Dulbecco's modified eagle medium
DMSO Dimethyl sulfoxide
dNTP deoxynucleotide triphosphate
ELISA Enzyme linked immunosorbent assay
Elk-1 Ets-like transcription factor
ERK Extracellular signal-regulated kinases
Eta-1 Early T-lymphocyte activation 1
Ets-1 E26-AMV virus oncogene cellular homolog,
a transcription factor
HBSS Hank's balanced salt solution
HRP Horseradish peroxidase
HSF-1 Heat shock factor 1
ICU Infected-cell counting units
IFN-γ Interferon-gamma
IκB Inhibitor of nuclear factor kappa B
IKK IκB kinase
IL-8 Interleukin 8
IRAK IL-1R-associated kinase
IP-10 IFN-γ-inducible 10 protein
JNK N-terminal c-Jun kinases
LPS Lipopolysaccharide
MAPK Mitogen-activated protein kinase
MCP-1 Monocyte chemoattractant protein 1
MEF2 Myocyte enhancer factor 2
MEK MAPK/Erk kinase
MIP-1 α Macrophage inflammatory proteins 1 α
MIP-1 β Macrophage inflammatory proteins 1 β
MIP-2 Macrophage inflammatory proteins 2
MK2 MAPK activated protein kinase 2
MK3 MAPK activated protein kinase 3
MKP-1 MAPK phosphatase-1
MNK MAP kinase interacting kinase
MSK Mitogen and stress activated kinases
MTT Thiazolyl blue tetrazolium bromide
MyD88 Myeloid differentiation primary-response protein 88
NOD Nucleotide-binding site and leucine-rich repeat
NF-AT Nuclear factor of activated T-cells
NF-κB Nuclear factor-kappa B
NK cell Natural killer cell
Op Osteopontin
p300 A histone acetyltransferase
p53 Tumor suppressor protein that protects from DNA
damage
PAMP Pathogen-associated molecular pattern
Pax Paxillin
PB Polymyxin B sulfate
PBS Phosphate-saline buffer
PD PD98059
PDTC Pyrrolidinedithiocarbamate
PEC Peritoneal exudate cells
PRAK p38 regulated activated kinase
PRR Pattern recognition receptor
PVDF Polyvinylidene fluoride
RANTES Regulated upon activation, normal T-cell expressed
and secreted
RIP2 Receptor interacting protein 2
RSK Ribosomal protein S6 kinase
SB SB203580
SP SP600125
STAT Signal transducer and activator of transcription
TBST Tris buffered saline containing 0.1% Tween-20
TEPM Thioglycollate exudate peritoneal macrophages
TLR Toll-like receptor
TNF-α Tumor necrosis factor α
TNFR TNF receptor
TRAF Tumor necrosis factor receptor-associated factors
INTRODUCTION
Scrub typhus (tsutsugamushi disease), caused by an intracellular bacterium Orientia tsutsugamushi, is one of the most prevalent febrile illnesses in South Korea (Chang et al., 1990). Tsutsugamushi disease is characterized by fever, rash, eschar, pneumonitis, meningitis, and disseminated intravascular coagulation, which leads to severe multiple organ failure in untreated cases (Allen et al., 1945; Chi et al., 1997). This disease extends from northern Japan and far eastern Rusia in the North, to northern Australia in the south, and to Pakistan and Afganistan in the west (Oaks et al., 1983). In addition to the three prototype strains, Gilliam, Karp and Kato, more than 30 antigenically distinct serotypes are present in the definite geographic region (Enatsu et al., 1999). The bacteria is approximately 0.5 μm wide and 1.2-3.0 μm long (Tamura et al., 1991). Phylogenetic analysis of 16S rRNA sequence homology proved that O. tsutsugamushi locates in the Proteobacteria α-subdivision and this suggests that O. tsutsugamushi is a member of Gram-negative bacteria (Ohashi et al., 1995). But this bacteria has little or no peptidoglycan or lipopolysaccharide components (Amano et al., 1987). Bacterial doubling time is about 8-9 h (Kawamura et al., 1995). It propagates in host cytoplasm by binary fission (Tamura et al., 1988). This bacterium infects a variety of host cells in vitro and in vivo, including macrophages, polymorphonuclear leukocytes (PMN), lymphocytes, and endothelial cells, where it replicates in the cytoplasm without being surrounded by a phagolysosomal membrane (Ng et al., 1985; Rikihisa et al., 1979; Cho et al., 2000). O. tsutsugamushi causes local inflammations accompanying eschars at the site of infection, which then spread systemically (Burnett
et al., 1980). Inflammation is initiated by O. tsutsugamushi-infected macrophages and endothelial cells in the dermis.
Analysis of early immunologic responses to O. tsutsugamushi infection in mice showed that macrophage-mediated cellular immunity is essential for resolution of this infection (Nacy et al., 1981), since macrophages are one of the potent effector cells that are able to remove bacterial pathogens. Resistance to the lethal effects of acute rickettsial infection is under unigenic dominant control by the Ric locus (Groves et al., 1980). Macrophages infiltrate both susceptible (Rics) and resistant (Ricr) mouse
strains in response to O. tsutsugamushi Gilliam infection (Nacy et al., 1981; Jerrells et al., 1981). Susceptible mice died within 2 weeks of infection, whereas resistant strains showed that inflammatory response was significantly reduced over 2 weeks and survived the infection (Nacy et al., 1981; Jerrells et al., 1981). Early host inflammatory responses seem to play a key role in determining the fate of the host infected with O. tsutsugamushi (Nacy et al., 1981; Jerrells et al., 1981). The explanation for a susceptible/resistant mouse phenotype to O. tsutsugamushi infection was provided by the analysis of the early T-lymphocyte activation 1 (Eta-1)/osteopontin (Op) gene, which maps to the Ric locus (Groves et al., 1980; Patarca et al., 1989). The expression of Eta-1 represents an essential early step in the pathway that leads to Th1 immunity (Ashkar et al., 2000). Eta-1/Op has been thought to enchance resistance to rickettsial infection by affecting the ability of macrophages to migrate to sites of infection and/or to express bacterial activity (Patarca et al., 1989).
In general, inflammatory cytokines have been known to determine the fate of T-cell development (Hedrick et al., 1999). Proinflammatory cytokines and chemokines are the main factors responsible for the
recruitment of distinct leukocytes into inflamed tissues during inflammatory disease (Baggiolini et al., 1994). Members of the CC chemokine subfamily such as regulated upon activation, normal T-cell expressed and secreted (RANTES), macrophage inflammatory proteins 1 α /β (MIP-1 α/β), monocyte chemoattractant protein 1 (MCP-1) preferentially attract monocytes and lymphocytes, while those of the CXC chemokine subfamily such as interleukin 8 (IL-8) and MIP-2 are potent neutrophil attractants (Baggiolini et al., 1994). The chemokines RANTES, MIP-1α, MIP-1β were found to efficient chemoattractants for Th1 cells whereas MCP-1 provokes Th2 cell development (Siveke et al., 1998). Thus, chemokine profile induces the kinetics of infiltration of different kinds of inflammatory cells. It may be important that regulation of cytokine gene expression and the resulting macrophage activation can contributes to host immune response during O. tsutsugamushi infection. Recently, the chemokine and cytokine family produced during infection by O. tsutsugamushi has been reported. The mRNAs levels that were upregulated included RANTES, MIP-1 α/β, MCP-1, MIP-2, interferon-gamma-inducible 10 protein (IP-10), TNF-α after O. tsutsugamushi infection in murine macrophages (Cho et al., 2000; Koh, 2001). Gene induction in mice was followed by the secretion of various chemokines and cytokine proteins including TNF-α and interferon-gamma (IFN-γ) (Koh et al., 2004; Yun et al., 2005). O. tsutsugamushi stimulates TNF-α production in a macrophages cell line (Choi et al., 1998) as well as in mice. It was found that the spleen cells from mice immunized with O. tsutsugamushi produced TNF-α in response to O. tsutsugamushi antigens, and TNF-α activity was found in the sera of immune mice after injection with the rickettsial antigen (Jerrells et al., 1994). Significant increases in TNF-α levels in serum were observed during the
convalescent phase in patients (Iwasaki et al., 1997). Cytokine hyper-production is associated with host susceptibilty by O. tsutsugamushi infection (Yun et al., 2005). It was known that TNF-α plays a critical role in host defense, immune regulation and inflammatory responses. Whereas TNF-α has numerous beneficial roles in immune regulation, TNF-α has been implicated in the pathogenesis of both acute and chronic inflammatory disease (Beutler et al., 1986). However, mechanisms which are involved in O. tsutsugamushi-induced TNF-α induction are little investigated.
Innate immunity is triggered when pathogen-associated molecular patterns (PAMPs) that are shared by group of microbial pathogens are recognized by pattern recognition receptors (PRRs) in host (Medzhitov et al., 1997). Microbial products such as lipopolysaccharide (LPS) induce production of cytokines and other proteins of the inflammatory response. TNF-α is one of the most potent cytokines and plays a central role in various immune and inflammatory phenomena (Vassalli, 1992; Pasparakis et al., 1996). TNF-α is produced by various cell types including macrophages, lymphocytes and natural killer (NK) cells. Mitogens such as LPS or PMA/ionomy stimulate TNF-α induction in various cell types. The most powerful inducer of TNF-α production by macrophages is the bacterial LPS (sanghera et al., 1996; Medvedev et al., 1998). Microbial products as ligands bind to receptors, which initiate the signal transduction cascade leading to TNF-α production.
Toll-like receptors (TLRs) are one of the PRRs and the signaling receptors and play a central role in early host defense against microbial pathogens. Different TLRs can recognize PAMPs. For example, TLR4 is involved in recognition of LPS components of Gram-negative bacteria, TLR2 detects Gram-positive cell wall components, bacterial
lipoproteins/lipopeptides, mycobacterial components and zymosan of fungi. TLR1, TLR2 and TLR4 are located on the cell surface and are recruited to phagosomes after activation. In contrast, TLR3, TLR7 and TLR9 are not expressed on the cell surface and are involved in the recognition of nucleic acid-like structures (Matsumoto et al., 2003; Ahmad-Nejad et al., 2002; Heil et al., 2003). These signaling pathways control the expression of genes of the inflammatory response at both transcriptional and post-transcriptional levels.
Signal transduction relies on mitogen-activated protein kinase (MAPK) and nuclear factor-kappa B (NF-κB) pathways. Once MAPK were activated, they phosphorylate and regulate a variety of transcription factors. MAPKs include extracellular signal-regulated kinases (ERK1/ERK2), p38 MAPK, N-terminal c-Jun kinases (JNKs). ERK is activated by a variety of receptors involved in growth and differentiation. Activated ERK translocate to the nucleus where it phosphorylate a variety of transcription factors regulating gene expression. Activated ERK1 and ERK2 phosphorylate numerous substrates in all cellular compartments including various membrane proteins such as CD120a, a tyrosine-protein kinase (Syk), and calnexin, and nuclear substrates such as paxillin (Pax6), nuclear factor of activated T-cells (NF-AT), ets-like transcription factor (Elk-1), myocyte enhancer factor 2 (MEF2), v-fos oncogen cellular homolog (c-Fos), avian myelocytomatosis virus oncogene cellular homolog (c-Myc), and signal transducer and activator of transcription 3 (STAT3), and cytoskeletal proteins such as neurofilaments and paxillin, and several MAPKAPKs (MKs) (Chen et al., 2001). Ribosomal protein S6 kinases (RSKs), mitogen and stress activated kinases (MSKs), and MAP kinase interacting kinases (MNKs) represent three kinase subfamilies of ERK1/2 substrates. While MSKs and MNKs have been shown to be activated by
both the ERK1/2 and p38 pathways, RSK family members are exclusively activated by the ERKs (Frodin et al., 2000).
JNK and p38 MAPK are activated by a variety of stimuli including environmental stresses and inflammatory cytokines. p38 MAPK is involved in regulation of MK2, MK3, and several transcription factors including activating transcription factor 2 (ATF-2), Stat1, Max/Myc complex, MEF-2, NF-κB, E26-AMV virus oncogene cellular homolog, a transcriptiion factor (Ets-1), tumor suppressor protein that protects from DNA damage (p53), Elk-1, and cAMP response element-binding protein (CREB) via MSK1 (Kyriakis et al., 2001;Roux et al., 2004). p38 also activates MSK1/2, MNK1, p38 regulated activated kinase (PRAK), heat shock protein 27 (HSP27) (Roux et al., 2004). JNK translocate to the nucleus where it can regulate the activity of multiple transcription factors. A well-known substrate for JNKs is the transcription factor c-Jun. Several other transcription factors have been shown to be phosphorylated by the JNKs, such as ATF-2, NF-ATc1, heat-shock facotr 1 (HSF-1), and STAT3 (Chen et al., 2001; Kyriakis et al., 2001).
NF-κB function as transcription factors that control genes regulating biological processes including innate and adaptive immunity, inflammtion, stress responses and B cell development. After activation by upstream signals, inhibitor of nuclear factor kappa B [IκB] kinase complex (IKK complex) phosphorylates the IκB leading to a polyubiquitination and preteasome-mediated degradation. And then NF-κB is activated and translocates to nucleus where, either alone or in combination with other transcription factor families including activator protein 1 (AP-1: c-JUN and c-FOS), Ets and STAT, they induce target gene expression.
However pattern recognition receptors and signal transduction mechanisms involved in O. tsutsugamushi-induced TNF-α production have
not yet been investigated. To address this issue, signal transduction and regulation of TNF-α gene expression during O. tsutsugamushi infection was investigated in this study.
MATERIALS AND METHODS
1. Reagents
Lipopolysaccharide (LPS, at a final concentration of 1 ㎍/ml) derived from Escherichia coli (Sigma, MO, USA) was used. In the inhibition assays, J774A.1 cells were preincubated with N-tosyl-L-phenylalanine
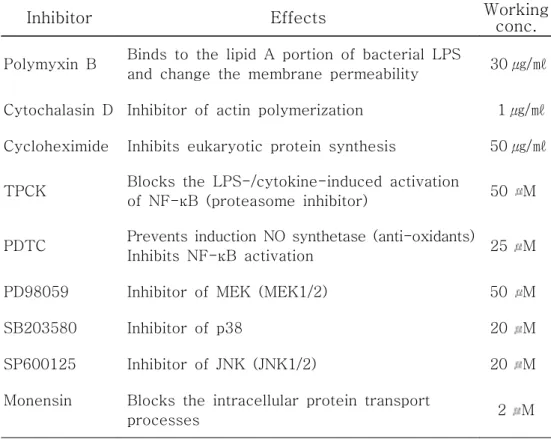
chloromethyl ketone (TPCK, Sigma), pyrrolidinedithiocarbamate (PDTC, Sigma), PD98059 (PD, Calbiochem, CA, USA), SB203580 (SB, Calbiochem) and SP600125 (SP, Sigma) for 1 h before O. tsutsugamushi was inoculated. J774A.1 cells were also pretreated for 1 h with cycloheximide (CHX, Sigma) or cytochalsin D (CD, Sigma) before O. tsutsugamushi was inoculated. Monensin (Becton Dickinson Biosciences, CA, USA) was added to J774A.1 cells for 1 h before infection of O. tsutsugamushi. Also inhibitors were maintained during the course of inhibition assays. To exclude the possible LPS contamination in the medium or in the inoculum, polymyxin B sulfate (PB, Sigma) was added to the cell culture to neutralize LPS. Heat-inactivated bacterial inoculum was obtained by heating O. tsutsugamushi at 56℃ for 30 min. The effects and working concentration of inhibitors used in this study are shown in Table 1.
2. Bacteria
Table 1. Effects and working concentration of inhibitors used in this study.
Inhibitor Effects Working conc.
Polymyxin B Binds to the lipid A portion of bacterial LPS
and change the membrane permeability 30 ㎍/㎖ Cytochalasin D Inhibitor of actin polymerization 1 ㎍/㎖ Cycloheximide Inhibits eukaryotic protein synthesis 50 ㎍/㎖ TPCK Blocks the LPS-/cytokine-induced activation
of NF-κB (proteasome inhibitor) 50 M PDTC Prevents induction NO synthetase (anti-oxidants)
Inhibits NF-κB activation 25 M PD98059 Inhibitor of MEK (MEK1/2) 50 M
SB203580 Inhibitor of p38 20 M
SP600125 Inhibitor of JNK (JNK1/2) 20 M Monensin Blocks the intracellular protein transport
Colleage of Medicine, Korea) was propagated in monolayers of L-929 cells as described previously (Kim et al., 1993). When more than 90% of the cells were infected, as determined by an indirect immunofluorescent-antibody technique (Chang et al., 1990), the cells were collected, homogenized with a glass Dounce homogenizer (Wheaton Inc., NJ, USA), and centrifuged at 500 × g for 5 min at 4℃. The supernatant was recovered and the stored in liquid nitrogen until use. The infectivity titer of the inoculum was determined (Tamura et al.. 1981). Five-fold serially diluted oriential samples were inoculated onto L-929 cell layers on 24-well tissue culture plates. After 3 days of incubation, the cells were collected, fixed, and stained (Chang et al., 1990). The ratio of infected cells to the counted number of cells was determined microscopically, and infected-cell counting units (ICU) of the oriential sample were calculated as followed (Tamura et al. 1981): ICU = (total number of cells used in infection) × (percentage of infected cells) × (dilution rate of the orientiae suspension)/100. A total of 1 × 10⁶ to 1 × 10⁸ ICU of O. tsutsugamushi was used to infect cultured cells.
3. Mice
Specific pathogen free, female C3H/HeN and C3H/HeJ mice purchased from SLC Inc. (Japan) were kept in the animal facility located in the Cheju National University College of Medicine. Utmost precautions were taken so the mice remained free from infection environmental pathogens. All mice used for peritoneal macrophages were 6 to 8 weeks old. Animal procedures were performed according to the guidelines of the Laboratory Animal Care Committee of Cheju National University College of Medicine.
4. Cell culture and infection
J774A.1 cells and L-929 cells were obtained from the American Type Culture Collection and cultured in Dulbecco's modified eagle medium (DMEM, GIBCO, NY, USA) containing 10% heat-inactivated fetal bovine serum (FBS, GIBCO), 100 U of penicillin G per ml, 100 ㎍ of streptomycin per ml (DMEM-10) in a humidified 5% CO2 atmosphere at
37℃. J774A.1 cells cultured in six-well plates for the preparation of total RNA, in 24-well plates for the measurement of TNF-α production, and in 40-mm dishes for the examination of MAP kinase activity.
Thioglycollate exudate peritoneal macrophages (TEPM) were obtained from mice that had been injected intraperitoneally 3 days previously with 1 ml of 4% Brewer's thioglycollate broth (Difco Laboratories, MI, USA) by peritoneal lavage with 10 ml of phosphate-saline buffer (PBS). The cells were pelleted, washed with cold PBS and resuspended in DMEM-10. The cells were counted on a hemacytometer and then plated in 24-well plates (Corning Inc., NY, USA). Nonadherent cells were removed after 2 h of incubation in a humidified 5% CO2 atmosphere at 37℃ by washing the
cells three times with cold PBS. Adherent macrophages were then cultured in a humidified 5% CO2 atmosphere at 37℃ for 18 h before
initiation of each experiment.
For RNase protection assay, infected mice were sacrificed by cervical dislocation, and peritoneal exudate cells (PEC) were harvested by washing the peritoneal cavity with 5 ml of Hanks' balanced salt solution (HBSS, GIBCO) containing 10 U/ml heparin. Peritoneal lavage fluid obtained from the two washings were pooled, spun in a centrifuge at 520 × g for 5 min at 4℃, and supernatants were removed and stored at -7 0℃ for cytokine analysis. Cell pellets were washed once with cold HBSS,
and resuspended in PBS. PEC suspension was snap-frozen in liquid nitrogen, and stored at -70℃ for RNA analysis.
5. Cytotoxicity test
The effect of the inhibitors on the J774A.1 cell growth was determined by measuring the metabolic activity using a Thiazolyl blue tetrazolium bromide (MTT) assay (Carmichael et al., 1987). J774A.1 cells were dispensed to 48-well culture plates at a concentration of 1 × 10⁵ cells/ml, and incubated for 24 h at 37℃ in 5% CO2. After the cells were
treated for 24 h or 6 h with inhibitors, 200 ㎕ of MTT (Sigma) was added to each well and cells continuously were incubated at 37℃ for 4 h. During this incubation period, viable cells convert MTT to a water-insoluble formazan dye. The plates were centrifuged at 500 × g for 20 min at room temperature and supernatants were removed carefully. 250 ㎕ of dimethyl sulfoxide (DMSO, Sigma) was added to each well and the plates were gently rocked to resolve the formazan dye. Absorbance was measured at wavelength of 540 nm. The results were calculated the percentage of inhibition or viability.
6. Indirect immunofluorescent antibody (IFA) test
O. tsutsugamushi Boryong-infected cells were collected for IFA staining (Chang et al., 1990). The infected cells were centrifuged at 500 × g for 5 min and supernatants were removed. And then the cells were resuspended with PBS. Repeat the process two times for a total of three
washes. The cells were resuspended with PBS and were mixed well by vortexing. The cells were smeared onto spot slides and fixed with acetone. Human sera reacting with O. tsutsugamushi were kindly provided by Dr. Ik-Sang Kim, Seoul National University College of Medicine. The cells on slides were reacted with this sera at 37℃ for 30 min. After three washes with PBS, goat anti-human IgG-FITC conjugate (Caltag, Burlingame, CA) was added, and incubated at 37℃ for 30 min. After three washes, counter-staining was performed with 0.003% evans blue (Sigma) solution in PBS. After wash with distilled water, the stained cells were mounted with glycerol and examined with a fluorescene microscope.
7. RNase protection assay
Total RNA was extracted from spleen tissue or PEC from uninfected and infected C3H/HeN mice using Trizol reagent (GIBCO) and was quantitated spectrophotometrically. Detection and quantitation of murine TNF-α mRNA was performed with the RiboQuant multiprobe RNase protection assay kit from PharMingen (CA, USA). In brief, a mixture of [32P]UTP-labeled antisense riboprobes was generated from a panel of
different cytokine or chemokine template DNAs. These panels also included templates for the murine housekeeping gene encoding L32 to ensure equal loading of total RNA onto the gels. Total RNAs from each sample (30 ㎍ each) were hybridized overnight at 56℃ with 3 × 10⁶ cpm
of the 32P-labeled antisense riboprobe mixture. After hybridization, the samples were digested with a mixture of RNases A and T1. Nuclease-protected RNA fragments were precipitated with ethanol. The samples were resolved on a 5% polyacrylamide sequencing gel. The
bands were observed after autoradiography. The specific bands were identified on the basis of their individual mobilities compared with the undigested probes. The band intensities shown in autoradiography were digitized by scanning the images and analyzed using a Gel Doc 2000 Gel Documentation System and Quantity One software (Bio-Rad, CA, USA). The densitometric intensity was normalized with respect to the intensities of the band for the housekeeping genes, L32.
8. Semiquantitative reverse transcriptase (RT)-PCR analysis
Total RNA was prepared with SV total RNA isolation system (Promega, WI, USA) according to the manufacturer's instructions. Amount of RNA was determined spectrophotometrically. After about 1 ㎍ total RNA extracted from each sample was treated with DNase (Promega), it was subjected to first-strand cDNA synthesis at 42℃ for 30 min in a 20 ㎕ reaction mixture containing 10 mM Tris-HCl (pH 9.0), 50 mM KCl, 0.1% Triton X-100, 5 mM MgCl2, 1 mM deoxynucleotide triphosphate
mixture (dNTP mixture), 1 u/㎕ RNasin, 0.5 ㎍ Oligo(dT)15 primer, and 15
u/㎍ AMV Reverse Transcriptase (Promega). The cDNA was heated at 9 5℃ for 5 min and diluted with nuclease-free water. The diluted cDNA were subjected to PCR amplification in a 25 ㎕ reaction mixture containing 10 mM Tris-HCl (pH 9.0), 50 mM KCl, 0.1% Triton X-100, 1.5 mM MgCl2, 0.2 mM dNTP mixture, 0.1 μ M each primer, and 1.25 U
of Taq DNA polymerase (Promega) in a GeneAmp PCR system 9600 (Perkin-Elmer, CT, USA). Primer sequences of TNF-α were as follows: 5'-GCG ACG TGG AAC TGG CAG AAG-3' (forward primer) and 5'-TCC ATG CCG TTG GCC AGG AGG-3' (reverse primer), giving a 340 bp
product. Primer sequences of β-actin were as follows: 5'-TGG AAT CCT GTG GGA TCC ATG AAA C-3' (forward primer) and 5'-TAA AAC GCA GCT CAG TAA CAG TCC G-3' (reverse primer), giving a 349 bp product. The reaction mixture was prepared as a master mixture to minimize reaction variation. One PCR cycle consisted of denaturation at 95℃ for 30 s, annealing at 55℃ for 30 s, and extension at 72℃ for 1min. During the first cycle, the 95℃ step extended to 2 min, and on the final cycle the 72℃ step extended to 5 min. 10 ㎕ of the PCR products were electrophoresed in a 2% agarose gel containing 0.5 ㎍ of ethidium bromide per ml. 100bp DNA ladder (Promega) was used 1 ㎍/lane as a molecular size marker. The amplified DNA fragment in the gels were identified and the densities of the bands were analyzed using a Gel Doc 2000 Gel Documentation System and Quantity One software (Bio-Rad). The densitometric intensity was normalized by comparing the ratio of TNF-α bands with that of β-actin.
9. Enzyme linked immunosorbent assay (ELISA).
J774A.1 cells and peritoneal macrophage were dispensed to plates at a concentration of 2 × 10⁵ cells/ml and cultured for 24 h. After 6 h
infection of O. tsutsugamushi with and without inhibitors, supernatants were collected from culture dishes and were centrifuged at 500 × g for 15 min at 4℃. In some cases, J774A.1 cells were infected for 2 h with each inhibitor in the absence or presence of monensin. And then bacterial inocula were removed from the cells and the cells were incubated for 4 h with each new medium and inhibitor in the absence or presence of monensin. For measurement of TNF-α levels inside cultured cell, the
cells were lyzed in lysis buffer (the same buffer for western blot analysis). The cell-free supernatants and cell lysate were analyzed for TNF-α using murine TNF-α ELISA kits (R & D systems, MN, USA) according to the manufacturer's instructions. The lower limits of detection of these assays were less than 5.1 pg/ml.
10. Western blot analysis
J774A.1 cells were dispensed to 40 mm culture dishes (Nunc, Roskilde, Denmark) at a concentration of 1 × 10⁶ cells/ml and cultured for 24 h.
After infection with O. tsutsugamushi with or without inhibitors or LPS or plain medium as a control, J774A.1 cells were collected at indicated time point and washed twice with ice-cold PBS. And then the cells were lyzed in lysis buffer (50 mM Tris-HCl, 150 mM NaCl, IGEPAL CA-630, 2 mM EDTA, 1 mM EGTA, 1 mM NaVO3, 10 mM NaF, 1 mM DTT, 1 mM
PMSF, 1 mM aprotinin, 1 mM leupeptin, 1 mM pepstatin A) by incubation on ice for 30 min. Lysates were then centrifuged at 13,000 × g for 15 min at 4℃. Protein concentration in each sample was determined using a Bicinchoninic acid protein assay kit (Sigma). A protein sample (30 ㎍) was electrophoresed in 10% SDS-polyacrylamide gels, transfered to a polyvinylidene fluoride (PVDF) membrane (Millipore, MA, USA), and the membrane was blocked in tris buffered saline containing 0.1% Tween-20 (TBST) supplemented with 5% milk for 1 h at room temperature. The membrane was incubated overnight with 1/1000-diluted primary polyclonal antibodies in 5% w/v bovine serum albumin (BSA), 1X TBS, 0.1% Tween 20 at 4℃ with gentle shaking. Antibodies were as follows: phospho-p44/42 MAP Kinase (ERK1/2), p44/42 MAP Kinase, phospho-p38
MAP Kinase, p38 MAP Kinase, phospho-SAPK/JNK, SAPK/JNK and IκBα (Cell Signaling Technology, Inc., MA, USA). After washing, the membrane was incubated with a horseradish peroxidase (HRP)-linked anti-rabbit IgG (Cell Signaling Technology, Inc.) as secondary antibody at a 1/2000 dilution for 1 h at room temperature. Immunoactive bands were detected using the WEST-ZOL plus Western blot detection system (iNtRON Biotechnology, Korea) according to the manufacturer's instructions.
RESULTS
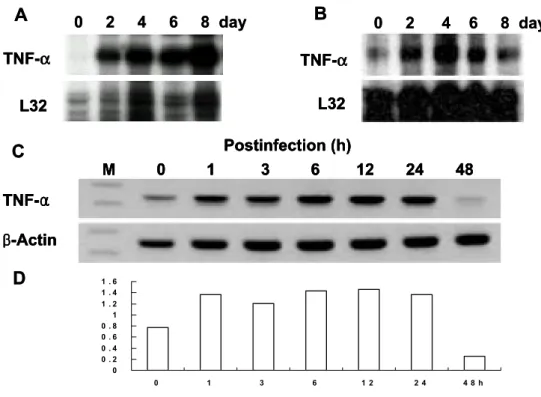
1. O. tsutsugamushi induces TNF-α gene expression in vivo and in vitro. To determine whether O. tsutsugamushi stimulates TNF-α gene expression in vivo and in vitro, mRNA and protein levels of TNF-α during infection were analyzed in mice and murine J774A.1 cell (Figures 1 and 2). Before and after infection of mice with O. tsutsugamushi, the level of TNF-α mRNA in PEC and spleen was assayed at each time point by a RNase protection assay (Figures 1A and B). TNF-α transcript was constitutively expressed at low level in PEC from uninfected mice (Figure 1A). TNF-α mRNA induced as early as 2 day after infection, increased by 8 day, and peaked at 8 day after infection (Figure 1A). TNF-α mRNA increased as early as 2 day after infection, peaked at 4 day, and began to decrease or approach uninfected baseline levels by 8 day (Figure 1B). The induction fold of TNF-α gene expression in splenic tissue was significantly lower than that in PEC. This suggests that TNF-α induction during O. tsutsugamushi infection may be a localized event.
J774A.1 cells, murine macrophage cell lines, were infected with O. tsutsugamushi and the mRNA level of TNF-α was analyzed by semiquantitative RT-PCR (Figure 1C and D). The mRNA for TNF-α increased as early as 1 h after infection, persisted by 24 h then began to decrease by 48 h (Figure 1C and D). The induction of TNF-α gene expression increased significantly at the initial stage of infection. This indicates that upregulation of TNF-α gene expression during O. tsutsugamushi infection occured rapidly.
Figure 1. TNF-α mRNA expression in cells from infected mice and J774A.1. TNF-α mRNA expression of peritoneal exudate cells (PEC) (A) and splenic tissue (B) removed from C3H/HeN mice after infection O. tsutsugamush. At various times after infection of mice, total RNA was extracted from PEC and spleen, and mRNA expression was determined by RNase protection assay. L32, a murine ribosomal protein. (C) Determination of TNF-α mRNA induction in J774A.1 treated with O. tsutsugamush. Kinetics of O. tsutsugamush-stimulated TNF-α mRNA level induced by the infection of O. tsutsugamushi was analyzed by RT-PCR at each time point. M, 100-bp DNA ladder. (D) The band intensities were determined and normalized with mRNA level of β-actin.
0 2 4 6 8 day
A
TNF-α L32 0 2 4 6 8 dayA
TNF-α TNF-α L32 L32B
TNF-α L32 0 2 4 6 8 dayB
TNF-α TNF-α L32 L32 0 2 4 6 8 day 0 0 . 2 0 . 4 0 . 6 0 . 8 1 1 . 2 1 . 4 1 . 6 0 1 3 6 1 2 2 4 4 8 h TN F -α /β -a cD
0 0 . 2 0 . 4 0 . 6 0 . 8 1 1 . 2 1 . 4 1 . 6 0 1 3 6 1 2 2 4 4 8 h TN F -α /β -a cD
C
Postinfection (h) M 0 1 3 6 12 24 48 β-Actin TNF-αC
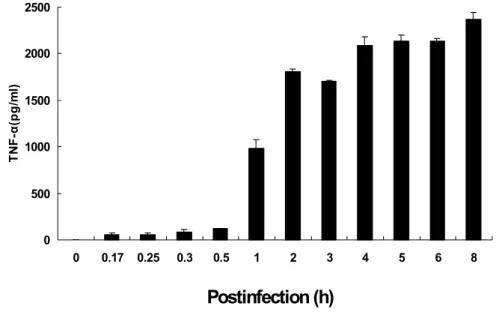
Postinfection (h) M 0 1 3 6 12 24 48 Postinfection (h) M 0 1 3 6 12 24 48 β-Actin β-Actin TNF-α TNF-αFigure 2. Time course of TNF-α protein production. Secreted TNF-α protein in macrophage J774A.1 cells infected with O. tsutsugamushi was measured. Supernatants were colleted at indicated time after the infection of O. tsutsugamushi and were tested for the presence of TNF-α protein using a ELISA kit. Mean ± SD from duplicate experiments.
0 500 1000 1500 2000 2500 0 0.17 0.25 0.3 0.5 1 2 3 4 5 6 8 TN F-α (pg/ m l)
Postinfection (h)
The secretion of TNF-α protein was determined in O. tsutsugamushi-infected J774A.1 cells by ELISA assay (Figure 2). TNF-α protein from uninfected cells was undetectable (Figure 2). TNF-α secretion increased from 1 h after infection and persisted by 8 h (Figure 2). These results show that the production pattern of TNF-α protein correlats with mRNA induction pattern of TNF-α gene expression (Figure 1C and D).
2. O. tsutsugamushi-stimulated TNF-α production is independent of TLR4 and LPS.
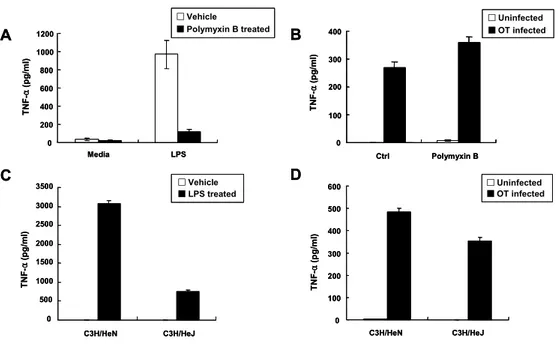
To determine whether O. tsutsugamushi-stimulated TNF-α production is due to exogenous LPS contaimination or endogenous LPS components of the bacteria, TNF-α level was determined from cells treated with LPS or O. tsutsugamushi with or without polymyxin B (PB). PB is an inhibitor of LPS signaling. Therefore, LPS-stimulated TNF-α production was dramatically reduced in the presence of PB (Figure 3A). However, level of TNF-α production in the O. tsutsugamushi-infected cells with PB was not reduced, compared with that in O. tsutsugamushi-infected cells without PB (Figure 3B). These results reveal that possible LPS contamination in O. tsutsugamushi inoculum was not cause for stimulated TNF-α production and demonstrate that O. tsutsugamushi has no LPS. Although O. tsutsugamushi activates adaptive immunity, the major PAMPs which play in the activation is not known. Since there is no LPS and very little (or no) peptidoglycan, it is likely that these bacteria do not activate TLR4. To ascertain whether O. tsutsugamushi activates TLR4 or not, peritoneal macrophage derived from both C3H/HeN (Tlr4wild-type)
Figure 3. Effect of polymyxin B or TLR4 mutation on O. tsutsugamushi- stimulated TNF-α production in macrophage. (A and B) Determination of TNF-α production in J774A.1 cells treated for 6 h with LPS (1 ㎍/ml) or O. tsutsugamushi (OT) in the absence or presence of polymyxin B (30 ㎍ /ml). (C and D) TNF-α production in infected C3H/HeN (Tlr4wild-type) and
C3H/HeJ (Tlr4mutant-type) macrophages. Macrophages were stimulated with
LPS or O. tsutsugamushi. Supernatants were collected and tested using a ELISA kit. Mean ± SD from duplicate experiments.
A 0 200 400 600 800 1000 1200 Media LPS TN F -α (pg/ml) □Vehicle ■Polymyxin B treated A 0 200 400 600 800 1000 1200 Media LPS TN F -α (pg/ml) □Vehicle ■Polymyxin B treated □Vehicle ■Polymyxin B treated B 0 100 200 300 400 Ctrl Polymyxin B □Uninfected ■OT infected TN F -α (p g/ml ) B 0 100 200 300 400 Ctrl Polymyxin B □Uninfected ■OT infected □Uninfected ■OT infected TN F -α (p g/ml ) D 0 100 200 300 400 500 600 C3H/HeN C3H/HeJ □Uninfected ■OT infected TN F -α (p g/ml ) D 0 100 200 300 400 500 600 C3H/HeN C3H/HeJ □Uninfected ■OT infected □Uninfected ■OT infected TN F -α (p g/ml ) C 0 500 1000 1500 2000 2500 3000 3500 C3H/HeN C3H/HeJ □Vehicle ■LPS treated TN F -α (p g/ml ) C 0 500 1000 1500 2000 2500 3000 3500 C3H/HeN C3H/HeJ □Vehicle ■LPS treated □Vehicle ■LPS treated TN F -α (p g/ml )
and C3H/HeJ (Tlr4mutant-type) mice were stimulated with LPS or O. tsutsugamushi (Figure 3C and D). C3H/HeJ mice have mutation in TLR4 and are hyporesponder to LPS stimulation. So, LPS-stimulated TNF-α production in C3H/HeJ macrophages was greatly reduced compared with C3H/HeN macrophages (Figure 3C). However, O. tsutsugamushi-stimulated TNF-α production in C3H/HeJ macrophages did not decrease greatly compared with C3H/HeN macrophages (Figure 3D). These results suggest that TLR4 is probably not involved in O. tsutsugamushi-stimulated TNF-α production.
3. O. tsutsugamushi-stimulated TNF-α gene expression does not require eukaryotic protein synthesis.
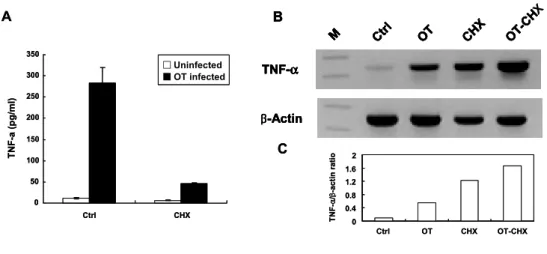
TNF-α has its own receptor and can bind to the receptor and then can amplify the signal. Finally a variety of chemokines and cytokines are produced. To examine whether TNF-α induction was a direct consequence of O. tsutsugamushi infection, the cells were treated with cycloheximide (CHX), an inhibitor of eukaryotic protein synthesis. In the CHX-treated O. tsutsugamushi-infected cells, TNF-α production decreased, whereas the mRNA level of TNF-α did not decrease compared with the level of O. tsutsugamushi-infected cells without CHX (Figure 4). These results suggest that TNF-α induction was originated from O. tsutsugamushi infection and did not require newly synthesized host proteins.
Figure 4. Effect of cycloheximide (CHX) on O. tsutsugamushi-stimulated TNF-α gene expression in J774A.1. (A) Determination of TNF-α secretion in J774A.1 cells infected O. tsutsugamushi with or without CHX. Cell-free supernatants were collected and tested using ELISA kit. Mean ± SD from three duplicate experiments. (B) Determination of TNF-α mRNA induction by RT-PCR analysis. (C) The band intensities were determined and normalized with mRNA level of β-actin. Ctrl, medium alone. OT, O. tsutsugamushi-infected cells. OT-CHX, O. tsutsugamushi-infected cells in the presence of CHX. M, size marker.
A TNF-α β-Actin CHX OT Ctrl M OT-CH X B C 0 0.4 0.8 1.2 1.6 2 Ctrl OT CHX OT-CHX TN F -α /β -actin ra ti o 0 50 100 150 200 250 300 350 Ctrl CHX TN F-a ( p g/ml) □Uninfected ■OT infected A TNF-α β-Actin CHX OT Ctrl M OT-CH X B TNF-α β-Actin CHX OT Ctrl M OT-CH X TNF-α TNF-α β-Actin β-Actin CHX OT Ctrl M OT-CH X CHX OT Ctrl M OT-CH X B C 0 0.4 0.8 1.2 1.6 2 Ctrl OT CHX OT-CHX TN F -α /β -actin ra ti o 0 50 100 150 200 250 300 350 Ctrl CHX TN F-a ( p g/ml) □Uninfected ■OT infected □Uninfected ■OT infected X
4. Various inhibitors block O. tsutsugamushi-stimulated TNF-α secretion specifically.
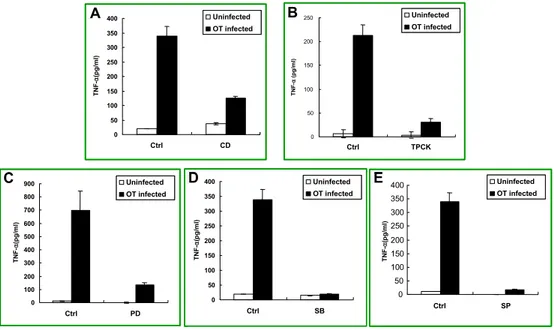
The effect of various inhibitors on TNF-α secretion in J774A.1 cells was assessed by ELISA assay (Figure 5). In the cells treated with cytochalasin D, the level of TNF-α secretion was dramatically reduced (Figure 5A). When TPCK was treated with the concentration of 50 μ M , TNF-α production decreased greatly (Figure 5B). Treatment of MAPK inhibitors, PD98059, SB203580 and SP600125, also inhibited O. tsutsugamushi-stimulated TNF-α production (Figure 5C, D, and E). These results suggest that reduction in O. tsutsugamushi-stimulated TNF-α secretion was probably due to the blockage of signal pathways by each inhibitor.
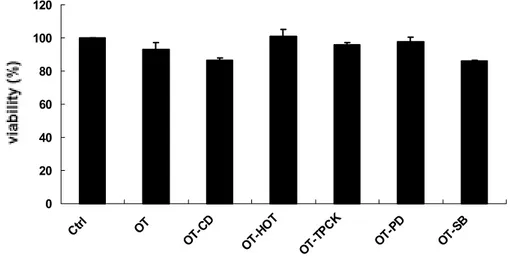
To confirm whether the inhibitors used in this study have no inhibitory effect on the cell growth and hence the reduced O. tsutsugamushi-stimulated TNF-α secretion is not due to inhibitory effect of the drugs on cell viability, cytotoxicity tests were conducted (Figure 6). The indicated concentration of each inhibitor does not lead to significant cell death. The cell viability of inhibitor-treated cells approached the level of control group, except PDTC-treated cells (data not shown). PDTC has a cytotoxicity effect to some extent on the cells when treated with O. tsutsugamushi together. These results demonstrate that inhibitory effect on the cell growth by each inhibitor was not responsible for reduction in O. tsutsugamushi-stimulated TNF-α production.
To investigate inhibitors used in this study have inhibitory effect on bacterial invasion into host cells and hence the reduced O. tsutsugamushi-stimulated TNF-α production is due to reduction in
Figure 5. Effect of various inhibitors on O. tsutsugamushi-stimulated TNF-α production in J774A.1. J774A.1 cells were pretreated for 1 h with each inhibitor and were infected with O. tsutsugamushi in the presence of each inhibitor. Cell-free supernatants were collected and tested using ELISA kit. Mean ± SD from duplicate experiments. Ctrl, medium alone. CD, O. tsutsugamushi-infected cells in the presence of CD. TPCK, O. tsutsugamushi-infected cells in the presence of TPCK. PD, O. tsutsugamushi-infected cells in the presence of PD. SB, O. tsutsugamushi-infected cells in the presence of SB.
A C D E 0 50 100 150 200 250 300 350 400 Ctrl SP 0 50 100 150 200 250 300 350 400 Ctrl SB TNF -α (pg/ m l) 0 50 100 150 200 250 300 350 400 Ctrl CD TNF-α (p g /m l) Uninfected OT infected 0 50 100 150 200 250 Ctrl TPCK TN F -α (pg/ m l) 0 100 200 300 400 500 600 700 800 900 Ctrl PD TNF -α (p g /m l) Uninfected OT infected Uninfected OT infected Uninfected OT infected Uninfected OT infected TNF -α (p g /m l) A C D E B A C D E 0 50 100 150 200 250 300 350 400 Ctrl SP 0 50 100 150 200 250 300 350 400 Ctrl SB TNF -α (pg/ m l) 0 50 100 150 200 250 300 350 400 Ctrl CD TNF-α (p g /m l) Uninfected OT infected Uninfected OT infected 0 50 100 150 200 250 Ctrl TPCK TN F -α (pg/ m l) 0 100 200 300 400 500 600 700 800 900 Ctrl PD TNF -α (p g /m l) Uninfected OT infected Uninfected OT infected Uninfected OT infected Uninfected OT infected Uninfected OT infected Uninfected OT infected Uninfected OT infected Uninfected OT infected TNF -α (p g /m l) A C D E B
Figure 6. Effect of O. tsutsugamushi or/and each inhibitor on the viability of J774A.1 cells. J774A.1 cells were pretreated for 1 h with each inhibitor and then were infected with O. tsutsugamushi in the presence of each inhibitor. After infection, J774A.1 cells were incubated 24 h with new medium in the presence of each inhibitor. Cell viability was measured by MTT assay. Medium alone (Ctrl), O. tsutsugamushi (OT) or O. tsutsugamushi-infected cells in the presence of cytochalasin D (OT-CD, 1 ㎍/ml), heat-inactivated (OT-HOT), TPCK (OT-TPCK, 50 μ M ), PD (OT-PD, 50 μ M ) and SB (OT-SB, 20 μ M ).
0 20 40 60 80 100 120 Ctrl OT OT-CD OT-H OT OT-T PCK OT-P D OT-S B V ia b ili t
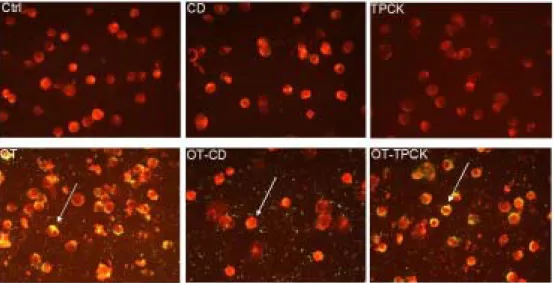
Figure 7. Effect of cytochalasin D or TPCK on the bacterial invasion into J774A.1. J774A.1 cells were treated with medium (Ctrl) or infected with O. tsutsugamushi (OT) with or without CD or TPCK (CD, TPCK, OT-CD, OT-TPCK). IFA test were performed. Stained cells were examined with a fluorescene microscope. J774A.1 cells are in red color and O. tsutsugamushi is in green color.
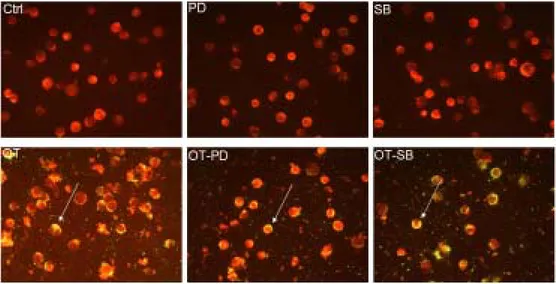
Figure 8. Effect of PD98059 or SB203580 on the bacterial invasion into J774A.1. J774A.1 cells were treated with medium (Ctrl) or infected with O. tsutsugamushi (OT) with or without PD98059 or SB203580 (PD, SB, OT-PD, OT-SB). IFA test were performed. Stained cells were examined with a fluorescene microscope. J774A.1 cells are in red color and O. tsutsugamushi is in green color.
Figure 9. Effect of SP600125 on the bacterial invasion into J774A.1. J774A.1 cells were treated with medium (Ctrl) or infected with O. tsutsugamushi (OT) with or without SP600125 (SP, OT-SP). IFA test were performed. Stained cells were examined with a fluorescene microscope. J774A.1 cells are in red color and O. tsutsugamushi is in green color.
Treatment of cytochalasin D (CD) inhibited invasion of O. tsutsugamushi into the host cells (Figure 7). CD treatment just inhibited internalization of bacteria and did not inhibit attachment of bacteria (Figure 7). All other inhibitors did not interfere with invasion of O. tsutsugamushi into the cells (Figures 7 to 9). These results confirm that reduction of TNF-α secretion by drug treatment was not caused by interference of bacterial invasion.
5. O. tsutsugamushi activates MAPK pathways during infection.
All of the MAPK inhibitors inhibited TNF-α production. So, it is possible O. tsutsugamushi induces host MAPK activation during infection. To adress this issue, western blot analysis was performed. Western blot analysis of cell lysates revealed that ERKs, JNKs, and p38 MAPKs become phosphorylated, and hence activated in O. tsutsugamushi-stimulated macrophages (Figure 10). Activation of ERK and JNK was detected at 15 min and 30 min and that of p38 was detected only at 15 min (Figure 10). To investigate whether MAPK phosphorylation was blocked by each inhibitor, selective inhibitors were treated to the cells infected with O. tsutsugamushi at indicated time and western blot analysis was performed (Figure 11). PD98059, MEK inhibitor, and SP600125, JNK inhibitor, selectively inhibited O. tsutsugamushi-stimulated ERK and JNK phosphorylation, respectively. However SB203580, p38 MAPK inhibitor did not block p38 MAPK phosphorylation itself. SB203580 treatment did not affect ERKs and JNKs phosphorylation.
Figure 10. Time-dependent phosphorylation of MAPKs of J774A.1 by O. tsutsugamushi infection. J774A.1 cells were infected with O. tsutsugamushi at indicated time. Total cell lysates were loaded on gels (25 ㎍ of protein per lane) and subjected to SDS-PAGE and immunoblotting using rabbit polyclonal antibodies specific for the phosphorylated and control MAPKs (p44/p42 ERK, p38 MAPK, JNK p54/p46). P-p44 ERK P-p42 ERK p44 ERK p42 ERK P-p38 MAPK p38 MAPK JNK p54 JNK p46 P-JNK p54 P-JNK p46 0 15 30 60 120 180 Time min P-p44 ERK P-p42 ERK p44 ERK p42 ERK P-p38 MAPK p38 MAPK JNK p54 JNK p46 P-JNK p54 P-JNK p46 P-p44 ERK P-p42 ERK P-p44 ERK P-p42 ERK p44 ERK p42 ERK p44 ERK p42 ERK P-p38 MAPK p38 MAPK P-p38 MAPK p38 MAPK JNK p54 JNK p46 JNK p54 JNK p46 P-JNK p54 P-JNK p46 P-JNK p54 P-JNK p46 0 15 30 60 120 180 Time min 0 15 30 60 120 180 Time min
Figure 11. Effects of various MAPK inhibitors on O. tsutsugamushi-induced phosphorylation of MAPKs in J774A.1. J774A.1 cells were pretreated for 1 h with each inhibitor before O. tsutsugamushi infection. The ERK inhibitor PD98059 (PD, 50 M), the p38 inhibitor SB203580 (SB, 20 M) or the JNK inhibitor SP600125 (SP, 20 M) were used in these experiments. After infection with O. tsutsugamushi with or without inhibitor, total cell lysates were loaded on gels (25 ㎍ of protein per lane) and subjected to SDS-PAGE and immunoblotting using rabbit polyclonal antibodies specific for the phosphorylated and control MAPKs (p44/p42 ERK).
6. O. tsutsugamushi-stimulated TNF-α production is regulated via ERK pathway by transcriptional mechanism but regulated via p38 or JNK pathways by post-transcriptional and translational mechanism.
To investigate whether MAPK inhibitors have effect on TNF-α induction. MAPK inhibitors, PD98059, SB203580 and SP600125 were used. When the cells were infected with O. tsutsugamushi in the presence of PD98059, SB203580 and SP600125 respectively, TNF-α production was diminished significantly (Figures 12A and 13A). To ascertain whether these results were attributed to alteration in intracellular TNF-α protein synthesis or TNF-α processing and secretion, the cells also were treated with monensin which blocked the intracellular protein transport processes. In both intracellular and extracellular parts, the level of TNF-α protein decreased in the cells treated with all MAPK inhibitors. In the cells treated with each MAPK inhibitor and monensin together, TNF-α protein decreased. These results show that TNF-α secretion was not affected by MAPK inhibitors. Namely there was no alteration in TNF-α secretion (Figures 12B and 13B).
To investigate whether MAPK inhibitors have effect on TNF-α gene induction, mRNA level was examined. PD98059, an inhibitor of MEK1/2, could reduce the level of TNF-α mRNA whereas SB203580, an inhibitor of p38 MAPK, could rather increase the level of it (Figure 12C). However, SP600125, an inhibitor of JNK, could not reduce TNF-α induction (Figure 13C). These results show that MAPK inhibitors such as SB and SP could not affect TNF-α gene expression but could affect TNF-α production. In conclusion, TNF-α production via ERK pathway could be regulated mainly by transcriptional mechanism and partly by post-transcriptional mechanism. However, TNF-α production via p38 or
Figure 12. Effect of PD98059 or SB203580 on O. tsutsugamushi-stimulated TNF-α production in J774A.1. (A) Determination of TNF-α protein secretion in J774A.1 cells infected with O. tsutsugamushi with or without PD or SB. Cell-free supernatants were collected and tested using ELISA kit. Mean ± SD from three duplicate experiments. (B) Determination of intracellular TNF-α protein level by ELISA kit. Cells were infected with O. tsutsugamushi with or without PD or SB in the absence or presence of monensin. (C) Determination of TNF-α mRNA induction by RT-PCR analysis. Medium alone (Ctrl), O. tsutsugamushi-infected cells (OT), infected cells in the presence of PD (OT-PD) or SB (OT-SB), M, size marker. (D) The band intensities were determined and normalized with mRNA level of β-actin.
β-Actin TNF-α OT-P D OT Ctrl M OT-S B C A 0 100 200 300 400 500 Ctrl PD SB TN F-α (p g /m l) □Uninfected ■OT-infected B 0 100 200 300 400 500 600 Ctrl PD SB TN F -α (pg/ ml) OT(-)/MON(-) OT(+)/MON(-) OT(+)/MON(+) D 0 0.2 0.4 0.6 0.8 1 1.2 Ctrl OT OT-PD OT-SB TNF -α /β -A ct in ra ti o β-Actin TNF-α OT-P D OT Ctrl M OT-S B C β-Actin β-Actin TNF-α TNF-α OT-P D OT Ctrl M OT-S B OT-P D OT Ctrl M OT-S B C A 0 100 200 300 400 500 Ctrl PD SB TN F-α (p g /m l) □Uninfected ■OT-infected A 0 100 200 300 400 500 Ctrl PD SB TN F-α (p g /m l) □Uninfected ■OT-infected □Uninfected ■OT-infected B 0 100 200 300 400 500 600 Ctrl PD SB TN F -α (pg/ ml) OT(-)/MON(-) OT(+)/MON(-) OT(+)/MON(+) B 0 100 200 300 400 500 600 Ctrl PD SB TN F -α (pg/ ml) OT(-)/MON(-) OT(+)/MON(-) OT(+)/MON(+) OT(-)/MON(-) OT(+)/MON(-) OT(+)/MON(+) D 0 0.2 0.4 0.6 0.8 1 1.2 Ctrl OT OT-PD OT-SB TNF -α /β -A ct in ra ti o D 0 0.2 0.4 0.6 0.8 1 1.2 Ctrl OT OT-PD OT-SB TNF -α /β -A ct in ra ti o
Figure 13. Effect of SP600125 on O. tsutsugamushi-stimulated TNF-α production. (A) Determination of TNF-α protein secretion in J774A.1 cells infected with O. tsutsugamushi with or without SP. Cell-free supernatants were collected and tested using ELISA kit. Mean ± SD from three duplicate experiments. (B) Determination of intracellular TNF-α protein level by ELISA kit. Cells were infected with O. tsutsugamushi with or without SP in the absence or presence of monensin. (C) Determination of TNF-α mRNA induction by RT-PCR analysis. Medium alone (Ctrl), O. tsutsugamushi-infected cells (OT), infected cells in the presence of SP (OT-SP), M, size marker. (D) The band intensities were determined and normalized with mRNA level of β-actin.
0 50 100 150 200 250 300 350 400 Ctrl SP TN F-α (p g /m l) □Uninfected ■OT infected B A D TNF-α β-Actin OT Ctrl M OT-SP C 0 100 200 300 400 500 600 Ctrl SP OT(-)/MON(-) OT(+)/MON(-) OT(+)/MON(+) 0 0.2 0.4 0.6 0.8 Ctrl OT OT-SP TN F-α /β -acti n ra ti o TN F-α (p g /m l) 0 50 100 150 200 250 300 350 400 Ctrl SP TN F-α (p g /m l) □Uninfected ■OT infected □Uninfected ■OT infected B A D TNF-α β-Actin OT Ctrl M OT-SP C TNF-α β-Actin OT Ctrl M OT-SP TNF-α β-Actin TNF-α TNF-α β-Actin β-Actin OT Ctrl M Ctrl OT OT-SP M OT-SP C 0 100 200 300 400 500 600 Ctrl SP 0 100 200 300 400 500 600 Ctrl SP OT(-)/MON(-) OT(+)/MON(-) OT(+)/MON(+) OT(-)/MON(-) OT(+)/MON(-) OT(+)/MON(+) 0 0.2 0.4 0.6 0.8 Ctrl OT OT-SP 0 0.2 0.4 0.6 0.8 Ctrl OT OT-SP TN F-α /β -acti n ra ti o TN F-α (p g /m l)