Research Article
Simulation-Based Optimization on the System-of-Systems
Model via Model Transformation and Genetic Algorithm: A Case
Study of Network-Centric Warfare
Bong Gu Kang ,
1Seon Han Choi ,
2Se Jung Kwon,
3Jun Hee Lee ,
4and Tag Gon Kim
41KT Institute of Convergence Technology, Seoul, Republic of Korea
2Korea Institute of Industrial Technology (KITECH), Ansan, Republic of Korea 3Samsung Electronics Co. Ltd., Seoul, Republic of Korea
4School of Electrical Engineering, Korea Advanced Institute of Science and Technology (KAIST), Daejeon, Republic of Korea Correspondence should be addressed to Seon Han Choi; [email protected]
Received 29 December 2017; Accepted 18 July 2018; Published 3 October 2018 Academic Editor: Laszlo T. Koczy
Copyright © 2018 Bong Gu Kang et al. This is an open access article distributed under the Creative Commons Attribution License, which permits unrestricted use, distribution, and reproduction in any medium, provided the original work is properly cited.
Simulation of a system-of-systems (SoS) model, which consists of a combat model and a network model, has been used to analyze the performance of network-centric warfare in detail. However,finding the combat model parameters satisfying the required combat power using simulation can take a long time for two reasons: (1) the prolonged execution time per simulation run and (2) the enormous number of simulation runs. This paper proposes a simulation-based optimization method for the SoS-based simulation model to overcome these problems. The method consists of two processes: (1) the transformation of the SoS-based model into an integrated model using the neural network to reduce the execution time and (2) the optimization of the integrated model using the genetic algorithm with ranking and selection to decrease the number of simulation runs. The experimental result reveals that the proposed method significantly reduced the time for finding the optimal combat parameters with an acceptable level of accuracy.
1. Introduction
In modern warfare, communication, responsible for theflow of information between combat entities, is a primary factor in attaining victory. That is, without proper communication, the combat commander cannot obtain detection information and forward appropriate attack orders to combat entities. Such a battlefield environment based on communication systems is called network-centric warfare (NCW) [1, 2]. Many researchers in the defense modeling and simulation (DM&S) domain have recognized the importance of NCW and have tried to analyze combat systems using war game simulators reflecting the effects of communication. In earlier studies, researchers depicted communication effects by using a simplified model or by assuming perfect communication in a combat model from the perspective of a standalone system
[3, 4]. However, as the importance of communication and the need for a detailed depiction of the network system increase, recent studies have separated the network model from the combat model [5, 6]. Namely, they have imple-mented each model with dedicated modeling development tools and have interconnected the model through an interoperation standard, such as the high-level architecture (HLA) or the test and training enabling architecture from the perspective of the system of systems (SoS) [7–10].
In the SoS, the system means a set of interrelated components working together toward some common objective or purpose, and the SoS means a set of systems for a task that none of the systems can accomplish on its own [11, 12]. This SoS-based approach has a merit in that a collection of dedicated systems offers more functional-ity and performance than simply the sum of the constituent Volume 2018, Article ID 4521672, 15 pages
systems and the conduct of various analyses by using existing models developed using the specialized tools in each domain [13–15]. For example, the combat model, which was only able to analyze the combat power, can measure the combat power under the communication environment by combin-ing with a network model, which only can describe the communication environment.
The SoS-based NCW simulation offers the advantage of enabling the conduct of the“what-if” analysis of the combat power against various combat scenarios with related parameters in the combat model, by reflecting detailed communication effects from the network model [16, 17]. However, the high complexity of the network model and the interface connecting the two models paradoxically increase the execution time per simulation trial [18–20]. Porche et al. raised the simulation overhead of the highly complex network model and then ana-lyzed the combat system with the metamodel of the network model [21]. Miner et al. also brought up the prolonged execu-tion time due to the network model when developing the SoS analysis toolset, and they constructed its metamodel [19]. Although some studies have conducted the abstraction of the SoS-based NCW simulation model, they have not entirely reflected the SoS property due to using data from the simulation of the standalone network model, not the SoS.
Furthermore, because the NCW simulation model is usually represented as a discrete-event simulation model with a stochastic property, a large number of replicated simulations are required to obtain a steady state of the combat power [22]. As a result, the “what-if” analysis based on the SoS-based NCW simulation becomes a time-consuming problem due to two challenges: (1) enormous total simulation runs due to a large number of experimental points and replicated simulations per point and (2) the long execution time per simulation run. When a decision-maker wants to find the parameters of the combat model satisfying the requirement operation capa-bility (ROC) of the combat power using the SoS-based NCW simulation, a significant computational cost is required.
One way to reduce the enormous simulation runs is to apply the optimization method for the discrete-event stochastic simulation model [17, 23, 24]. However, this process also requires the considerable time because it takes a long time per run of the SoS-based simulation model. On the other hand, another approach to dealing with the long execution time per run is to transform the SoS-based simula-tion model into an integrated simulasimula-tion model via the abstraction of the model [25–27]. Although this can reduce the time required to conduct the exploratory analysis, for example, a full search on the design space, the “what-if” analysis is also time-consuming because the integrated simu-lation model requires somewhat execution time [28, 29]. That is, independently using each approach to the SoS-based NCW simulation model has a limitation when it comes to solving the two drawbacks simultaneously.
This paper applies a simulation-based optimization method to the SoS-based NCW simulation model in the form of a hybrid approach to overcome the abovementioned challenges. It consists of two processes: (1) the transforma-tion of the SoS-based NCW simulatransforma-tion model into the integrated simulation model via the model abstraction using
the neural network [30, 31] and (2) the simulation-based optimization using the genetic algorithm (GA) with ranking and selection (R&S) [32, 33]. The former plays a role in reducing the execution time for the NCW simulation with an acceptable error; the latter plays a role in reducing the number of simulation runs required for finding the parameters of the combat model satisfying the given com-bat power in the entire design space. By integrating the merits of the two approaches, this paper finally facilitates simulation-based optimization in the SoS environment.
In our case study, we measured the accuracy and efficiency of the proposed optimization method for the SoS-based NCW simulation, which has already been validated. Consequently, the experimental results show that the first process reduced the execution time 113.31 times within the 5.6248% error range and the second process decreased the total number of simulation runs 19.76 times for obtaining the optimal solution with 95% accuracy. Considering the synergy effect, the proposed method ultimately reduced the execution time 2239 times within acceptable accuracy. Finally, our study provides an alternative method forfinding the optimized parameters satisfying the given performance requirements in the enormous design space in the SoS.
This study is organized as follows. Section 2 describes the background and related work. Section 3 explains the proposed method. Section 4 discusses the experimental results from the NCW simulation. Finally, Section 5 concludes this study.
2. Background
2.1. System-of-Systems Stochastic Simulation Model for NCW. The NCW system consists of combat entities that are geographically or hierarchically dispersed and that share information through communication [34]. To describe the NCW system as depicted in Figure 1, modelers have developed a combat model for the military operation and a network model for communication effects separately from the perspective of the SoS, and they have enabled the infor-mation between two heterogeneous models to be shared through the interoperation middleware.
In this structure, the network model reflects the commu-nication effects on information delivery among entities of the combat model, which acquires the communication effects, for example, the packet delivery ratio (PDR) or end-to-end delay. The former refers to the ratio of the number of success-fully delivered packets from the source to the destination node; the latter refers to the average time the packets take to arrive at the destination from the source node [35]. By reflecting these effects, the combat model simulates the combat power.
2.2. Optimization in the Stochastic Simulation Model. The concept of optimization in the stochastic simulation models can simply be depicted in Figure 2. Since the model cannot be expressed in an analytic closed form, conducting the optimization using the inverse model is impossible. Thereby, conducting repeated simulations for solving the optimization problem is inevitable [36]. To be specific, if we find an
optimized parameter setting that maximizes the model’s performance among k design alternatives (where design xi refers to a particular setting of the model parameters), the total k × h simulation runs are required when considering
h replications per design. To overcome the stochastic noise
and tofind the optimal design accurately, increasing h and obtaining the accurate performance of each design (i.e.,μi) are necessary. However, increasing h causes efficiency problems in the optimization due to the increased cost of repeating the simulation as previously mentioned. The greater the number of design alternativesk, the worse this problem becomes.
Many methods for solving the efficiency problem have been proposed. These methods can be classified into two
categories according to the number of alternatives [37]. Ifk is infinite or very large, classical metaheuristic search methods, such as simulated annealing [38], GA [39], and tabu search [40], can be considered efficient approaches. These methods reduce the required number of simulation runs by performing the simulations only for selected alterna-tives rather than for all alternaalterna-tives as depicted in Figure 3(a). To accurately find optimal designs using these methods, selecting alternatives for the simulation, including such optimal designs, is important.
On the other hand, if k is finite and relatively small (specifically, all alternatives can be simulated more than five times), the ranking and selection (R&S) methods in statistics, such as OCBA [41], KN [42], and UE [43], can be considered
Stochastic simulation model (f(·)) Stochastic simulation model (f(·)) Stochastic simulation model (f(·)) Stochastic simulation model (f(·)) Inverse stochastic simulation model (f−1(·)) Impossible Possible ⋮ ⋮ ⋮ ⋮ ⋯ ⋯ ⋯ x y x y x1 x2 xk 𝜇1 𝜇2 𝜇k k design al te rn at iv es, Θ y11 y12 y1h y21 y22 y2h yk1 yk2 ykh Replications k × h simulation runs S = argmax 𝜇i xi ∈ Θ 𝜇i= yij h h j = 1 1
Figure 2: Optimization in the stochastic simulation model.
M&S in SoS view Military operation Output: Combat power Input: Combat system parameter
SoS stochastic simulation modelfor NCW Interoperation Combat model Node Network model Entity Network-centric warfare (NCW) Communication effect
efficient approaches. Unlike classical metaheuristic methods, statistical R&S performs simulations for all alternatives. It reduces the total number of simulation runs by appropriately adjusting h in each design as indicated in Figure 3(b). That is, the aim of R&S is to select the optimal designs accurately by allocating the limited number of simulation runs effectively. Because the R&S performs the simulations for all designs, it is less likely to fall into a local optimiza-tion compared with metaheuristic methods that perform the simulations only for the selected alternatives, and it ensures that the discovered optimal design is the global optimum. However, it is clear that the R&S cannot be applied to the case of a large number of alternatives because
the simulation should be performed for all alternatives at least more thanfive times.
3. Proposed Method
As illustrated in Figure 4, the objective of this study is tofind the optimized input parameters of the combat model, which satisfy the given ROC corresponding to the combat model’s outputs (i.e., the combat power in the SoS-based simulation model). Tofind the parameters as efficiently as possible, this paper is aimed at minimizing the simulation cost and time due to a large number of simulation runs while retaining the accuracy. Figure 5 reveals the overall procedure of this k alternatives (large)
Increase the efficiency by classical metaheuristic methods
(reduce k) k × h simulation runs h h (a) k alternatives (small) Increase the efficiency by ranking and selection methods
(reduce h) h
h
k × h simulation runs
(b)
Figure 3: Various approaches for increasing the efficiency of the optimization in the stochastic simulation model: (a) classical metaheuristic methods and (b) R&S methods.
Given: combat power Find: combat system parameter SoS stochastic simulation model Interoperation Combat model Network model Output: combat power Input: combat system parameter Given requirement operation capability (ROC) Optimized parameter Simulation-based optimization
proposed method for minimizing the simulation cost for the optimization problem, which consists of two processes: (1) transformation and (2) optimization.
The transformation process transforms the stochastic simulation model into the integrated stochastic simulation model (upper part). For this, this paper abstracts the network model to the abstracted model. Owing to the simplified network model and the removal of the interoperation mid-dleware, this process surely shortens the execution time per simulation run.
In the optimization process subsequently, an optimiza-tion algorithm specialized in the stochastic simulaoptimiza-tion model minimizes the number of simulation runs required for finding the optimized input in the entire design space (lower part). As a result of the two processes, the proposed method can reduce the total time forfinding the parameters satisfying the required combat power. The following sections explain each process in detail.
3.1. Transformation Process. Figure 6 depicts the transforma-tion process consisting of two phases: (1) data acquisitransforma-tion from the simulation of the SoS-based NCW stochastic model (right upper part) and (2) the abstracted network model construction using the neural network (right lower part). As mentioned in the prior section, the original network model plays a role in calculating the communication effects. Likewise, the abstracted model should be able to calculate the same effects. In addition, because the original network model is the discrete-event model, the abstracted network
model should also be a discrete-event model that can participate in the discrete-event simulation.
For the abstraction, data exchanged between the two models in the original SoS simulation should be collected and analyzed. From the C response message, the PDR and end-to-end delay can be approximated. The C request messages are used for calculating the interdeparture time (intDepT) of the messages. This paper uses the interde-parture time for the identification of the original network model [44, 45]. From the raw data, we can construct each data input and output set, {intDepT, PDR} and {intDepT, DELAY}, for training the neural network of two communication effects.
After the data acquisition, the second phase involves constructing the abstracted network model through the model hypothesis in phase 2.1 and the variable estimation in phase 2.2. In the model hypothesis phase, a discrete-event system specification (DEVS) atomic model is con-structed and will participate in the discrete-event simulation with the combat model. To estimate the PDR and end-to-end delay in the variable estimation phase, the input and output sets are trained in the nonlinear autoregressive exogenous (NARX) neural network, which is suitable for representing the dynamic and nonlinear properties of the network model [46]. Finally, this paper constructs the integrated stochastic model (left lower part of Figure 6) by substituting the network model with the identified and abstracted network model from the SoS-based NCW stochastic model (left upper part of Figure 6).
Combat model as it is Output
Input
SoS model for NCW Interoperation Combat model Network model 1) Transformation Output Input Combat model Abstracted network model Output Input
Integrated model for NCW Combat model Abstracted network model 2) Optimization Abstract network model Optimizer Given Output Find Input C request C response
Integrated model for NCW
Figure 7 represents the abstracted network model (ANM) based on the DEVS formalism. We hypothesize that the abstracted model, which an atomic DEVS model describes, is a probabilistic priority queue, where the DELAY associated with events are considered to be priorities by influencing the PPDR in generating stochastic events in the mixed
time [47]. The formal specification of ANM can be found in Specification 1.
This model has three states: WAIT, q , COMM, q ,
and SEND, q . The first and second are the states of q
without and with messages received from the combat model; the third state is the state sending the message to the combat model. When receiving a message for reflecting the communication effects in WAIT, q from
δext, this model calculates DELAY and PPDR values using
calculateDelay and calculatePDR, which are trained via
the NARX model and implemented as the functions. Then, the model stores the message with a scheduled time for output (C response) and PPDR by adding the current time
and DELAY in q. Then, it updates minTA and transits to
COMM, q . After the minTA time, this model conducts
δpint to SEND, q based on PPDR and generates the
mes-sage to the combat model in SEND, q . Through such a model structure, this abstracted model can participate in the discrete-event simulation, which is impossible using only the neural network, and generates a different output according to the status of the adjacent model through the neural network.
3.2. Optimization Process. As mentioned previously, the optimization methods for the stochastic simulation model can be classified into the classical metaheuristic and R&S methods depending on the number of design alternatives
k. To increase the efficiency of the optimization (i.e., to
decrease the total number of simulation runs T denoted
as k × h in Figure 2), the metaheuristic methods reduce
the k when k is large. On the other hand, the R&S
method improves the efficiency by decreasing h when k is relatively small. Although the applicable case of each method is different, the efficiency of the optimization can be further increased by reducing k and h simulta-neously if both methods can be used together. Therefore,
SoS model for NCW
Transformation Combat model
Network model C request C response
Integrated model for NCW
Combat model Abstracted network model C request C response Substitute network model with abstracted network model
Model hypothesis & variable estimation Data set for PDR and end-to-end delay
Time Messages Interdeparture time NARX neural network for PDR PDR Var. XXX Phase 2.1 : Hypothesized model Var. PDR Var. DELAY NARX neural network for DELAY DELAY
Abstracted network model
… Phase 1 Data acquisition from SoS simulation Phase 2 Phase 2.1 : Variable estimation
{(intDepTi,PDRi,DELAYi), i: C request's packet id }
intDepT = inter-departure time of the C requests
PDR = packet-delivery ratio
DELAY = end-to-end delay
intDept
intDept
in this section, we introduce a GA with R&S to improve the efficiency of the optimization for the SoS-based NCW stochastic simulation model.
The GA is a population-based search algorithm inspired by the process of natural selection [39]. Figure 8(a) represents the procedure of the GA. Each design alternative is encoded
ANM = <X, Y, S, δext, δpint, λ, ta >
X = C request ; Y = C response ;
S = s, q ∣ s ∈ WAIT, COMM, SEND , q ∈ Q
whereQ is message queue;
δext WAIT, q , C request → COMM, q′
COMM, q , C request → COMM, q′ δpint COMM, q , PPDR → SEND, q ;
COMM, q , 1 − PPDR → WAIT, q′ where Q is empty;
COMM, q , 1 − PPDR → COMM, q′ where Q is not empty;
SEND, q → COMM, q′ where Q is not empty; SEND, q → WAIT, q′ where Q is empty; λ SEND, q → C response;
ta WAIT, q → ∞; COMM, q → minTA; SEND, q → 0;
VANM= PPDR, DELAY is ANM’s variable;
PPDRis the packet delivery ratio;
DELAY is the end-to-end delay;
minTA = the minimum remaining time related DELAY with among all messages in Q.
Specification 1
[checkQueueLength==0] !C response/popMessage
(WAIT,q) (SEND,q)
(COMM, q)
C request C response
External transition, Transition Syntax: [Condition] ?input/Object model
ta = ∞ ta = 0
ta = minTA
Internal transition, Transition Syntax: [Condition] !output/Object model ? C request/ calculateDelay, calculatePDR, insertMessageInQueue, updateTA(DELAY) ? C request/ calculateDelay, calculatePDR, insertMessageInQueue, updateTA(DELAY) [1-PPDR & checkQueueLength! = 0] /popMessage, updateTA(DELAY) [checkQueueLength! = 0] ! C response/popMessage, updateTA(DELAY) [PPDR (packet delivery ratio)] [1-PPDR & checkQueueLength==0] /popMessage
as a single chromosome represented as a series of binary bits to apply genetic operations. Since the GAfinds the optimal design by repeatedly updating the population through evalu-ating the population with stochastic simulation and applying the genetic operations, its performance highly depends on the quality of the population. That is, the more the popu-lation contains optimal or similar designs, the more the GA can find the solution efficiently with fewer repetitions. To increase the quality of the population, two parent chromosomes selected stochastically based on the evaluated ranking revealed in Figure 8(a) should be the designs with higher performance than the other designs in the popula-tion. Accordingly, the evaluated ranking needs to be more accurate. However, estimating the exact performance of a chromosome via a large number of simulation replications for each chromosome (i.e., increasing h) reduces the GA’s efficiency by increasing T. As mentioned previously, the aim of R&S is tofind optimal designs accurately by allocating limited simulation replications effectively to k design alterna-tives. Since the size of the population is small enough to apply R&S (i.e.,k is small), applying R&S to the evaluation stage of the GA can improve the quality of the population viafinding the ranking accurately without increasingT as demonstrated in Figure 8(b). Consequently, the efficiency of GA can be increased [37, 48, 49].
Among various R&S algorithms, we apply the UEmr algorithm which is the most recently developed based on the uncertainty evaluation (UE) framework [43]. Algorithm 1 represents the UEmr algorithm (see [50] for detail). This algorithm focuses on finding good designs of which the
performance is within the top-m and identifying their rankings accurately. To maximize the accuracy under the limited number of simulation runs, the algorithm allocates further simulation runsΔ sequentially based on the uncer-tainty. The uncertainty, the criterion for allocatingΔ for each design, is defined with the p value of the statistical hypothesis test. It indicates the degree to which the observed simulation results of design, such as the sample mean and standard error, can be significant evidence for the correct selection of the design. A small value of the uncertainty close to zero means that the observed results are significant evidence, so the selection of the design can be statistically considered correct. On the other hand, a relatively larger value means that the results cannot be the evidence, so it is uncertain whether the selection of the design is correct. Depending on the meaning of the uncertainty, it is necessary to allocate more simulation runs to designs with a relatively higher value of the uncertainty, as shown in step 5 of Algorithm 1.
Compared with the other similar R&S algorithms, such as UEm [23], OCBAm+ [48], OCBAm [51], and EOC-m [49], the UEmr canfind the top-m designs and their rankings with higher accuracy if the simulation model has a large amount of stochastic noise. In the case of complex models, such as the SoS-based NCW model covered in this paper, stochastic noise tends to be great due to its high complexity; thus, the UEmr property of high robustness to noise allows the GA to perform the optimization of such complex models more efficiently. To verify this, we applied the UEmr and the similar R&S algorithms to the evaluation stage of the GA and compared the improved efficiency for the three kinds
Stochastic simulation Stochastic simulation Ranking & selection Evaluation Evaluation New population (size = k) 1st 2nd 3rd kth … … 1st 2nd mth … Evaluated performance ranking of k chromosomes
Selected m good chromosomes (m < k) with accurate ranking by R&S
Genetic operations
(b) Proposed genetic algorithm with ranking and selection (GA + R&S) (a) Existing genetic algorithm (GA)
Initial population (size = k) Large design space Random sampling Mutation Cross over 1 0 1 0 0 1 0 1 0 110 1 1 1 0 The number of simulation replications T Quality of population New population (size = k) … Chromosome Rank-based selection Rank-based selection
of benchmark models of which the optimal performance value is zero. The comparative results revealed in Figure 9 demonstrate the improved efficiency of the GA with the UEmr. In particular, in the case of Schaffer’s model, in which the stochastic noise is relatively greater than that in the other models due to many similar peaks (where the
standard GA did not even converge), the GA with UEmr showed the highest efficiency improvement. Algorithm 2 represents the proposed GA with the UEmr.
Algorithm 2 has various parameters, and they can be classified into the two groups of GA and R&S. Among the parameters for the GA, k and Gmax mean the size of the
5 x 0 −5 −5 0 y 2 4 6 0 5 ×10⁵ Performance
f(x,y)=(1.5−x+xy)2 + (2.25−x+xy2)2 + (2.625−x+xy3)2
OCBAm+ OCBAm Standard (equal) UEmr UEm EOC-m Generations
The performance of the best chromosome
0.05 0.1 0.15 0.2 0.25 0.3 0.35 0 5 10 15 20
(a) Beale function
5 x 0 −5 −5 0 y 5 20 30 0 10 Performance f(x,y)=0.26(x2+y2)−0.48xy OCBAm+ OCBAm Standard (equal) UEmr UEm EOC-m Generations
The performance of the best chromosome
0.03 0.06 0.09 0.12 0.15 0.18 0 10 20 30 (b) Matyas function 5 x 0 −5 −5 0 y 5 0 0.5 1 1.5 Performance f(x,y)=0.5+(sin2(x2−y2)−0.5)/(1+0.001(x2+y2))2 OCBAm+ OCBAm Standard (equal) UEmr UEm EOC-m Generations 0 20 40 60
The performance of the best chromosome
0 0.1 0.2 0.3 0.4 0.5
(c) Schaffer N.2 function Figure 9: Comparative results of GA with various R&S algorithms on the three benchmark functions. Parameters:T ≤kn0,n0,Δ ≪T , m ≤k
INITIALIZATION:
1: simulaten0times for each designxi,i ∈ 1, … , k 2: setT ← T − kn0
LOOP:
3: whileT ≥ 0do
4: calculate the uncertaintyωifor eachxiusing the simulation results
5: allocateΔ to all designs according to ωi:
ai/aj= ωi/ωj,
wherei, j ∈ 1, … , k , i ≠ j, and Δ = 〠 k i=1ai
6: simulateaitimes for eachxiadditionally
7: update the simulation results
8: setT ← T − Δ
9: end while
FINALIZATION:
10: return the top-m designs and their performance ranking based on the simulation results
population and the number of generations, respectively.Pc and Pm refer to the crossover and mutation probabilities, respectively, used in the genetic operations. Parameter e indicates the number of chromosomes for the elitism that guarantees that the quality of the population does not degrade as the generation progresses [52]. On the other hand, among the parameters for the R&S,T is the total number of simulation runs that can be allocated to thek designs in the population via Algorithm 1 from each generation. n0 indi-cates the initial number of simulation runs for the k designs to obtain the minimum simulation results for further allocation (as mentioned previously, due to thisn0, R&S cannot be applied when k is large). Δ means the additional number of replications to be distributed to thek designs according to the evaluated uncertainties in each iteration of the loop. Finally,m is the number of the top-m designs selected by Algorithm 1.
In summary, Algorithm 2, which is a combination of the GA and R&S, can further increase the efficiency of the opti-mization for the stochastic simulation model by reducingk
and h in Figure 2 simultaneously through applying both
metaheuristic and R&S methods together. That is, applying R&S to the evaluation stage of the GA can improve the qual-ity of the population byfinding the good chromosomes and their rankings accurately under limited simulation runs. The experimental results in Section 4.2 demonstrate the improved efficiency of Algorithm 2 in the optimization of the SoS-based NCW stochastic simulation model.
4. Experimental Results
The objective of this section is to demonstrate how much the proposed method reduces the simulation costs while retaining accuracy when finding the parameters satisfying
the required combat power. Here, the given required com-bat power is to maximize the loss-exchange ratio (LER), which refers to the ratio of the number of red casualties to the number of blue casualties. That is, the optimization problem in this section is finding the optimal parameters of NCW [53, 54] that maximize the LER using the SoS-based NCW simulation.
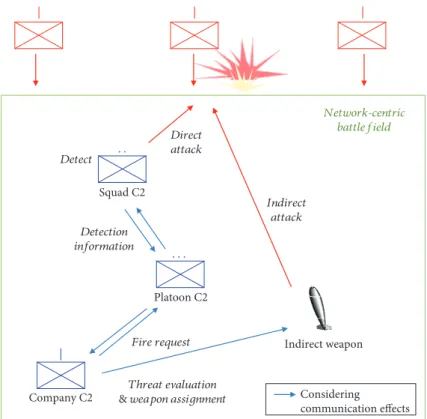
Figure 10 illustrates the scenario of the NCW simulation model that includes complex and hierarchical information exchange among combat entities [55, 56]. When the red force approaches, a blue force’s soldier detects it and hierarchically sends the detection information to company C2 through intelligence fusion (IF). Then, C2 performs threat evaluation and weapon assignment (TEWA) and transmits the results to indirect weapons for the attack. Afterward, when the red force’s combat power is below a certain level, it instructs the subordinate entities to begin close combat for the direct attack. In this situation, the information exchange (blue arrow) occurs through communication, and thereby, its performance influences the combat power.
According to this scenario, the blue force executes a defense operation against the red force with three times the military strength in a 2 km× 2 km operation area. The combat model represents the army’s military logic at an infantry company level including 131 entities, imple-mented in the DEVSimHLA [57, 58]. The network model depicts the mobile ad hoc network (MANET) based on the destination sequenced distance vector (DSDV) routing pro-tocol including 131 nodes corresponding to the entities, implemented in the ns-3 discrete-event network simulator [59–62]. The two models participate in the SoS-based NCW simulation using HLA-RTI, which manages simulation time and exchanges the data [63]. The environment for this case study is as follows. The combat model uses CPU I5-3550 Parameters:
GA:k, Gmax,e ≤m , Pc,Pm
R&S (Algorithm 1):T ≤kn0,n0,Δ ≪T , m ≤k INITIALIZATION:
1: choosek chromosomes randomly as initial population
LOOP:
2: fori = 1 to Gmaxdo
EVALUATION WITH R&S:
3: evaluate andfind elite m chromosomes from the population with Algorithm 1 (T, n0,Δ, m)
ELITISM:
4: put the best e chromosomes among the elitem chromosomes into the emptied new population
GENETIC OPERATIONS:
5: do
6: choose 2 parent chromosomes from the elitem chromosomes with the linear ranking selection
7: generate 2 child chromosomes from the 2 parents with the uniform crossover withPcrate
8: mutate the 2 children with the simple bit inversion method withPmrate
9: put the 2 children into the new population
10: while size of the new population≤k
11: end for
FINALIZATION:
12: return the best chromosome among the population
(3.3 GHz), RAM (4 GB), and DEVSim++ v.3.1; the network model uses NS3 v.3.18. They used RTI 1.3-NG and pro-gressed simulation time over 5000 sec. For the training, this paper uses the MATLAB neural network toolbox v.8.2.1 and MATLAB Coder v.2.7.
4.1. Experimental Design and Results: Transformation. For thefirst process of the proposed optimization method, we applied the transformation process of Section 3.1 to the SoS-based NCW simulation to reduce the simulation execu-tion time. To acquire the data for the transformaexecu-tion, we conducted the SoS-based NCW simulation. Among the full factorial design spaces, we selected 34 experimental points for training using a Latin hypercube design [60] and con-ducted 30 replicated simulations against each point. Accord-ing to the process in Figure 6, we constructed an abstracted network model with the NARX model, which consists of two input delays, two output delays, and 10 neurons in the hidden layer using the Levenberg-Marquardt algorithm. After the transformation, we chose an extra 17 test points at random to compare the experimental results from the SoS-based simulation with the integrated simulation with those from the replicated simulation.
From the perspective of accuracy, the absolute root-mean-square error (RMSE) of the LER indicates 0.0742, which means a relative 5.6248% error when considering the minimum and maximum values (0.8287 and 2.149, respec-tively). In addition, to analyze the speed, we compared the average simulation execution time and the average number of processed events per trial in the SoS-based and integrated simulation. The SoS-based simulation indicates
67.083 minutes and 3 0782e + 08 events, respectively, and the integrated simulation indicates 0.592 minutes and 2 5605e + 06 events, respectively. Assuming that the time for training is negligible, we could reduce the simulation execution time about 113.31 times by abstracting the network model with enormous events and removing the interoperation middleware.
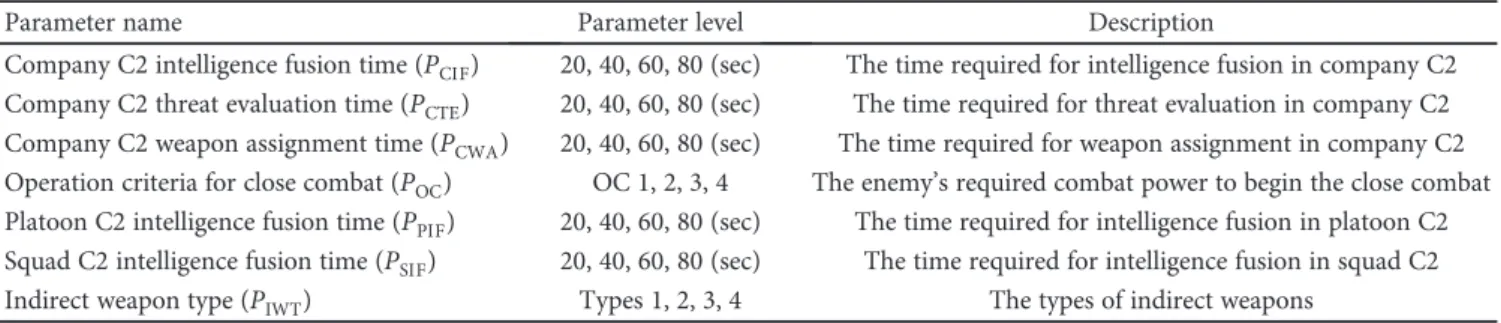
4.2. Experimental Design and Results: Optimization. For the second process of the proposed optimization method, we applied the proposed algorithm (Algorithm 2) to the integrated model, which was developed in the previous pro-cess, to efficiently find the optimal parameter setting that maximizes the LER by reducing the number of simulation runs. A total of 16,384 design alternatives were generated depending on the combat model parameters in Table 1 (i.e., xi= PCIF, PCTE, PCWA, POC, PPIF, PSIF, PIWT, and each design was encoded to a chromosome of 14 bits (i.e., two bits per parameter in Table 1). The parameters of GA in Algorithm 2 were set as follows according to the typical Dejong setting [64]: k = 50, Gmax= 1000, e = 15, Pc= 0 5, and Pm= 0 01. The parameters of R&S were set as follows according to the efficient setting guideline [43]: T = 5000,
n0= 10, Δ = 50, and m = 30. As a result, we could find the
optimal design that maximizes the LER, [20, 20, 20, OC4, 20, 20, type 4], among 16,384 alternatives very efficiently via applying Algorithm 2. Table 2 and Figure 11 demon-strate the improved efficiency of Algorithm 2 compared to the standard GA. Here, the accuracy implies the prob-ability of correct selection [37] and was estimated over 1000 independent trials. | | | Squad C2 | . . . Fire request · · Detect Detection information Indirect attack Direct attack Network-centric battlefield Platoon C2 Company C2 Indirect weapon Threat evaluation
& weapon assignment Considering communication effects
Algorithm 2 could greatly reduce the total number of simulation runs required to find the optimal design. As shown in Table 2, to find the optimal design with 95% accuracy, the standard GA required 2,470,000 simulation runs (5000× 494 generations), whereas Algorithm 2 used only 125,000 (5000× 25 generations) runs. In the case of applying only R&S instead of GA tofind the optimal design, it is inefficient compared with Algorithm 2 because 163,840 simulation runs are required even if just 10 initial replications per design are conducted for 16,384 designs. Namely, Algorithm 2, which decreases both k and h by combining GA with R&S, can perform the optimization on the inte-grated model more efficiently than GA and R&S that only reducek or h.
As mentioned previously, the improved efficiency of Algorithm 2 is due to the increased quality of the population via applying R&S thatfinds the good chromosomes and their rankings accurately under limited simulation runs. This effect can be more clearly identified by changing the param-eter settings of the algorithm, as shown in Figure 11. In Figure 11, the setting P1 means the previously mentioned set-ting, whereas P2 and P3 are the settings in which T and e were changed from P1 (i.e., P1 T = 5000, e = 15 , P2 T = 2500, e = 10 , and P3 T = 1500, e = 5 ). Here, T and e are the parameters that have the greatest effect on the quality of the population. In the case of the standard GA, as T
and e decrease, the quality of the population becomes poor
due to the inaccurately evaluated rankings of chromo-somes and the reduced effects of the elitism; thus, the efficiency is reduced greatly, as shown in Figure 11. On the other hand, the efficiency of Algorithm 2 does not decrease significantly because the algorithm finds relatively accurate ranking and good chromosomes via R&S. In addition, in the case where the stochastic noise is large due to many similar peaks as shown in Figure 12, the high robustness to noise of the applied UEmr further increases the efficiency of Algorithm 2.
5. Conclusion
To solve the time-consuming problem occurring when trying to find the combat model parameters satisfying the ROC, for example, combat power, this paper has proposed a simulation-based optimization method for the SoS-based NCW stochastic simulation model in the form of a hybrid approach with two processes.
In thefirst process, to shorten the prolonged execution time per simulation run, the SoS-based model was trans-formed into an integrated model by abstracting the highly Table 2: The number of simulation runs required to achieve the
specific accuracy for the standard GA and Algorithm 2.
Accuracy Standard GA Algo. 2 (GA + R&S) Ratio
0.8 1,350,000 85,000 15.88
0.85 1,565,000 90,000 17.39
0.9 1,835,000 110,000 16.68
0.95 2,470,000 125,000 19.76
0.99 4,000,000 215,000 18.60
The alternative index
0 2000 4000 6000 8000 10000 12000 14000 16000
Loss exchange ratio (LER) 0.50 1 1.52 2.53
Figure 12: The precise LER for 16,384 designs estimated by 200 replications per design using the integrated simulation model.
Generations 0 100 200 300 400 500 600 Accuracy 0 0.2 0.4 0.6 0.8 1 Standard GA - P1 Standard GA - P2 Standard GA - P3 Algo. 2 (GA + R&S) - P1
Algo. 2 (GA + R&S) - P2 Algo. 2 (GA + R&S) - P3
Figure 11: The accuracy curves of Algorithm 2 and the standard GA according to the three different settings of the algorithm parameters: P1, P2, and P3.
Table 1: Combat model parameters and their description.
Parameter name Parameter level Description
Company C2 intelligence fusion time (PCIF) 20, 40, 60, 80 (sec) The time required for intelligence fusion in company C2 Company C2 threat evaluation time (PCTE) 20, 40, 60, 80 (sec) The time required for threat evaluation in company C2 Company C2 weapon assignment time (PCWA) 20, 40, 60, 80 (sec) The time required for weapon assignment in company C2 Operation criteria for close combat (POC) OC 1, 2, 3, 4 The enemy’s required combat power to begin the close combat Platoon C2 intelligence fusion time (PPIF) 20, 40, 60, 80 (sec) The time required for intelligence fusion in platoon C2 Squad C2 intelligence fusion time (PSIF) 20, 40, 60, 80 (sec) The time required for intelligence fusion in squad C2 Indirect weapon type (PIWT) Types 1, 2, 3, 4 The types of indirect weapons
complex network model and removing the interoperation middleware. The transformation based on the neural network achieved a small level of error by maintaining the network model’s characteristics. In the second process, to decrease the number of simulation runs, the simulation-based optimization for the integrated model was conducted using the GA with R&S. The simulation-based optimization significantly reduced the number of simulation runs for finding the optimized parameters compared with the optimization using the GA or R&S alone.
The empirical analysis revealed that the first process reduced the simulation execution time by 113.31 times within a 5.6248% error range; the second process decreased the number of simulation runs by 19.76 times to find the optimal parameters with 95% accuracy. Taken together, the proposed method ultimately reduced the total time by 2239 times with acceptable accuracy. We expect that the pro-posed method will help to conduct the simulation-based optimization on the SoS-based model in various domains, such as the military domain.
Conflicts of Interest
The authors declare that they have no conflicts of interest.
Acknowledgments
This work was supported by the Brain Korea 21 Plus program through the National Research Foundation (NRF) of Korea funded by the Ministry of Education. The authors would like to thank the Editor, Prof. László T. Kóczy, and anonymous reviewers for their valuable comments and constructive suggestions.
References
[1] J. Moffat, Complexity Theory and Network Centric Warfare, DIANE Publishing, 2010.
[2] G. Neuneck, “The revolution in military affairs: its driving forces, elements, and complexity,” Complexity, vol. 14, no. 1, pp. 50–61, 2008.
[3] J. H. Kim, I.-C. Moon, and T. G. Kim, “New insight into doctrine via simulation interoperation of heterogeneous levels of models in battle experimentation,” Simulation, vol. 88, no. 6, pp. 649–667, 2012.
[4] A. Yang, H. A. Abbass, and R. Sarker,“Land combat scenario planning: a multiobjective approach,” in Simulated Evolution and Learning, Lecture Notes in Computer Science, pp. 837– 844, Springer, Berlin, Heidelberg, 2006.
[5] A. Tolk, Ed., Engineering Principles of Combat Modeling and Distributed Simulation, John Wiley & Sons, 2012.
[6] B. G. Kang and T. G. Kim, “Reconfigurable C3 simulation framework: interoperation between C2 and communication simulators,” in 2013 Winter Simulations Conference (WSC), pp. 2819–2830, Washington, DC, USA, December 2013. [7] HLA Working Group, “IEEE standard for modeling and
simulation (M&S) high-level architecture (HLA)-framework and rules,” IEEE Standard, 2000.
[8] US DoD,“TENA-the test and training enabling architecture,” https://www.tena-sda.org.
[9] C. E. Maldonado and N. A. Gómez Cruz,“The complexifica-tion of engineering,” Complexity, vol. 17, no. 4, pp. 8–15, 2012. [10] K. H. Lee, J. H. Hong, and T. G. Kim, “System of systems approach to formal modeling of CPS for simulation-based analysis,” ETRI Journal, vol. 37, no. 1, pp. 175–185, 2015. [11] B. S. Blanchard, W. J. Fabrycky, and W. J. Fabrycky, Systems
Engineering and Analysis, Prentice Hall, Englewood Cliffs, NJ, USA, 1990.
[12] ISO, IEC/IEEE 15288: 2015, Systems and Software Engineering-Content of Systems and Software Life Cycle Process Informa-tion Products (DocumentaInforma-tion), InternaInforma-tional OrganizaInforma-tion for Standardization/International Electrotechnical Commis-sion, 2015.
[13] M. Jamshidi, Systems of Systems Engineering Principles and Applications, CRC Press, 2008.
[14] M. Jamshidi, System of Systems Engineering Innovations for the Twenty-First Century, Wiley, 2011.
[15] S. W. Popper, S. C. Bankes, R. Callaway, and D. DeLaurentis, System of Systems Symposium: Report on a Summer Conver-sation, Potomac Institute for Policy Studies, 2004.
[16] S. H. Choi, K.-M. Seo, and T. G. Kim,“Accelerated simulation of discrete event dynamic systems via a multi-fidelity modeling framework,” Applied Sciences, vol. 7, no. 10, article 1056, 2017. [17] J. H. Hong, K. M. Seo, and T. G. Kim, “Simulation-based optimization for design parameter exploration in hybrid system: a defense system example,” Simulation, vol. 89, no. 3, pp. 362–380, 2013.
[18] I. Porche, L. Jamison, and T. Herbert, Framework for Measuring the Impact of C4ISR Technologies and Concepts on Warfighter Effectiveness Using High Resolution Simulation, Rand Arroyo Center, Santa Monica CA, USA, 2004.
[19] N. E. Miner, B. P. Van Leeuwen, K. M. Welch et al., “Evaluating communications system performance effects at a system of systems level,” in MILCOM 2012 - 2012 IEEE Military Communications Conference, pp. 1–6, Orlando, FL, USA, October-November 2012.
[20] B. D. Paz and J. A. Baer,“Communication effect server integra-tion with OneSAF for mission level simulaintegra-tion,” in Proceedings of the 2008 Fall Simulation Interoperability Workshop, FIW 2008, pp. 271–276, USA, September 2008.
[21] I. Porche, R. Isaac, and W. Bradley, The Impact of Network Performance on Warfighter Effectiveness, Rand Arroyo Center, Santa Monica CA, USA, 2006.
[22] A. M. Law, Simulation Modeling and Analysis, McGraw-Hill, 4th edition, 2007.
[23] S. H. Choi and T. G. Kim,“Optimal subset selection of stochas-tic model using statisstochas-tical hypothesis test,” IEEE Transactions on Systems, Man, and Cybernetics: Systems, vol. 48, no. 4, pp. 557–564, 2018.
[24] S. H. Choi and T. G. Kim,“Pareto set selection for multiobjec-tive stochastic simulation model,” IEEE Transactions on Sys-tems, Man, and Cybernetics: SysSys-tems, 2018.
[25] B. G. Kang, B. S. Kim, and T. G. Kim, “Abstraction on network model under interoperable simulation environ-ment,” in ECMS 2016 Proceedings edited by Thorsten Claus, Frank Herrmann, Michael Manitz, Oliver Rose, pp. 460–466, Germany, May 2016.
[26] B. G. Kang, K. M. Seo, and T. G. Kim,“Machine learning-based discrete event dynamic surrogate model of commu-nication system for simulating command, control, and
communication system of systems,” Simulation: Transactions of the Society for Modeling and Simulation International, 2018. [27] B. G. Kang, K. M. Seo, and T. G. Kim, “Communication analysis of network-centric warfare via transformation of system of systems model into integrated system model using neural network,” Complexity, vol. 2018, Article ID 6201356, 16 pages, 2018.
[28] J. H. Bigelow and P. K. Davis, Implications for Model Valida-tion of MultiresoluValida-tion, Multiperspective Modeling (mRMPM) and Exploratory Analysis, Rand Corp, Santa Monica CA, USA, 2003.
[29] A. Brooks, S. Bankes, and B. Bennett, Weapon Mix and Explor-atory Analysis a Case Study, Rand Corp, Santa Monica CA, USA, 1997.
[30] Z. Xiao, L. Peng, Y. Chen, H. Liu, J. Wang, and Y. Nie, “The dissolved oxygen prediction method based on neu-ral network,” Complexity, vol. 2017, Article ID 4967870, 6 pages, 2017.
[31] T. Gligorijević, Z. Ševarac, B. Milovanović et al., “Follow-up and risk assessment in patients with myocardial infarction using artificial neural networks,” Complexity, vol. 2017, Article ID 8953083, 8 pages, 2017.
[32] Y. Zhou, L. Zhou, Y. Wang, Z. Yang, and J. Wu,“Application of multiple-population genetic algorithm in optimizing the train-set circulation plan problem,” Complexity, vol. 2017, Article ID 3717654, 14 pages, 2017.
[33] A. Jain and N. S. Chaudhari,“An improved genetic algorithm for developing deterministic OTP key generator,” Complexity, vol. 2017, Article ID 7436709, 17 pages, 2017.
[34] D. S. Alberts, J. J. Garstka, and F. P. Stein,“Network centric warfare: developing and leveraging information superiority,” Assistant Secretary of Defense (C3I/Command Control Research Program), Washington DC, USA, 2000.
[35] M. F. Khan, E. A. Felemban, S. Qaisar, and S. Ali, “Perfor-mance analysis on packet delivery ratio and end-to-end delay of different network topologies in wireless sensor networks (WSNs),” in 2013 IEEE 9th International Conference on Mobile Ad-hoc and Sensor Networks, pp. 324–329, Dalian, China, December 2013.
[36] M. C. Fu,“Feature article: optimization for simulation: theory vs. practice,” Informs Journal on Computing, vol. 14, no. 3, pp. 192–215, 2002.
[37] C. H. Chen and L. H. Lee,“Stochastic simulation optimization: an optimal computing budget allocation,” World Scientific, vol. 1, 2011.
[38] S. Kirkpatrick, C. D. Gelatt, and M. P. Vecchi,“Optimization by simulated annealing,” Science, vol. 220, no. 4598, pp. 671– 680, 1983.
[39] J. H. Holland, Adaptation in Natural and Artificial Systems, The University of Michigan Press, Ann Arbor, MI, USA, 1975. [40] F. Glover,“Tabu search, part I,” ORSA Journal on Computing,
vol. 1, no. 3, pp. 190–206, 1989.
[41] C. H. Chen, J. Lin, E. Yücesan, and S. E. Chick,“Simulation budget allocation for further enhancing the efficiency of ordinal optimization,” Discrete Event Dynamic Systems, vol. 10, no. 3, pp. 251–270, 2000.
[42] S. H. Kim and B. L. Nelson,“On the asymptotic validity of fully sequential selection procedures for steady-state simulation,” Operations Research, vol. 54, no. 3, pp. 475–488, 2006. [43] S. H. Choi and T. G. Kim,“Efficient ranking and selection for
stochastic simulation model based on hypothesis test,” IEEE
Transactions on Systems, Man, and Cybernetics: Systems, vol. 48, no. 9, pp. 1555–1565, 2018.
[44] K. Worden, C. X. Wong, U. Parlitz et al.,“Identification of pre-sliding and sliding friction dynamics: grey box and black-box models,” Mechanical Systems and Signal Processing, vol. 21, no. 1, pp. 514–534, 2007.
[45] P. Amani, M. Kihl, and A. Robertsson, “NARX-based multi-step ahead response time prediction for database servers,” in 2011 11th International Conference on Intelligent Systems Design and Applications, pp. 813–818, Cordoba, Spain, November 2011.
[46] S. Salivahanan, A. Vallavaraj, and C. Gnanapriya, Digital Signal Processing, McGraw-Hill, 2001.
[47] C. M. Seo, B. P. Zeigler, D. H. Kim, and K. Duncan, “Integrat-ing web-based simulation on IT systems withfinite probabilis-tic DEVS,” in Proceedings of the Symposium on Theory of Modeling & Simulation: DEVS Integrative M&S Symposium, TMS 2015, pp. 173–180, San Diego, CA, USA, April 2015. [48] S. Zhang, L. H. Lee, E. P. Chew, J. Xu, and C. H. Chen,“A
simulation budget allocation procedure for enhancing the efficiency of optimal subset selection,” IEEE Transactions on Automatic Control, vol. 61, no. 1, pp. 62–75, 2016.
[49] S. Gao and W. Chen, “Efficient subset selection for the expected opportunity cost,” Automatica, vol. 59, pp. 19– 26, 2015.
[50] S. H. Choi and T. G. Kim,“A heuristic approach for selecting best-subset including ranking within the subset,” IEEE Trans-actions on Systems, Man, and Cybernetics: Systems, 2018. [51] C. H. Chen, D. He, M. Fu, and L. H. Lee,“Efficient simulation
budget allocation for selecting an optimal subset,” Informs Journal on Computing, vol. 20, no. 4, pp. 579–595, 2008. [52] S. Baluja and R. Caruana, “Removing the genetics from the
standard genetic algorithm,” in Machine Learning Proceedings 1995: Proceedings of the Twelfth International Conference on Machine Learning, pp. 38–46, Tahoe City, CA, USA, July 1995. [53] M. Phythian, Understanding the Intelligence Cycle, Routledge,
2013.
[54] J. Marshall, L. M. ER, J. Tapp et al., An Analysis of the Open Architecture Warfare System Domain Model for Surface Time Critical Targets, Naval Postgraduate School, 2007.
[55] A. H. Dekker, C4ISR Architectures, Social Network Analysis and the FINC Methodology: An Experiment in Military Organisational Structure, Defence Science and Technology Organisation, 2002.
[56] I. C. Moon, K. M. Carley, and T. G. Kim, Modeling and Simulating Command and Control: For Organizations Under Extreme Situations, Springer Science & Business Media, 2013. [57] B. P. Zeigler, T. G. Kim, and H. Praehofer, Theory of Modeling and Simulation Integrating Discrete Event and Continuous Complex Dynamic Systems, Academic Press, 2000.
[58] T. G. Kim, C. H. Sung, S.-Y. Hong et al.,“DEVSim++ toolset for defense modeling and simulation and interoperation,” The Journal of Defense Modeling and Simulation: Applications, Methodology, Technology, vol. 8, no. 3, pp. 129–142, 2011. [59] S. Kaur, S. kaur, and C. Sharma, “An overview of mobile
ad hoc network: application, challenges and comparison of routing protocols,” IOSR Journal of Computer Engineering, vol. 11, no. 5, pp. 7–11, 2013.
[60] C. Rajabhushanam and A. Kathirvel, “Survey of wireless MANET application in battlefield operations,” International
Journal of Advanced Computer Science and Applications, vol. 2, no. 1, pp. 50–58, 2011.
[61] T. R. Henderson, M. Lacage, G. F. Riley, C. Dowell, and J. Kopena, “Network simulations with the ns-3 simulator,” in SIGCOMM Demonstration, p. 527, Seattle, WA, USA, August 2008.
[62] J. Pan and R. Jain, A Survey of Network Simulation Tools: Current Status and Future Developments, Washington University, 2008.
[63] M.-W. Yoo, C. Choi, and T. G. Kim,“High-level architecture service management for the interoperation of federations,” Simulation, vol. 91, no. 6, pp. 566–590, 2015.
[64] K. A. DeJong and W. M. Spears, “An analysis of the interacting roles of population size and crossover in genetic algorithms,” in Parallel Problem Solving from Nature. PPSN 1990. Lecture Notes in Computer Science, pp. 38–47, Springer, Berlin, Heidelberg.
Hindawi www.hindawi.com Volume 2018
Mathematics
Journal of Hindawi www.hindawi.com Volume 2018 Mathematical Problems in Engineering Applied Mathematics Hindawi www.hindawi.com Volume 2018Probability and Statistics
Hindawi
www.hindawi.com Volume 2018
Hindawi
www.hindawi.com Volume 2018
Mathematical PhysicsAdvances in
Complex Analysis
Journal ofHindawi www.hindawi.com Volume 2018
Optimization
Journal of Hindawi www.hindawi.com Volume 2018 Hindawi www.hindawi.com Volume 2018 Engineering Mathematics International Journal of Hindawi www.hindawi.com Volume 2018 Operations Research Journal of Hindawi www.hindawi.com Volume 2018Function Spaces
Abstract and Applied AnalysisHindawi www.hindawi.com Volume 2018 International Journal of Mathematics and Mathematical Sciences Hindawi www.hindawi.com Volume 2018
Hindawi Publishing Corporation
http://www.hindawi.com Volume 2013 Hindawi www.hindawi.com
World Journal
Volume 2018 Hindawiwww.hindawi.com Volume 2018Volume 2018
Numerical Analysis
Numerical Analysis
Numerical Analysis
Numerical Analysis
Numerical Analysis
Numerical Analysis
Numerical Analysis
Numerical Analysis
Numerical Analysis
Numerical Analysis
Numerical Analysis
Numerical Analysis
Advances inAdvances in Discrete Dynamics in Nature and SocietyHindawi www.hindawi.com Volume 2018 Hindawi www.hindawi.com Differential Equations International Journal of Volume 2018 Hindawi www.hindawi.com Volume 2018
![Figure 1: SoS-based NCW simulation model with a stochastic property [27].](https://thumb-ap.123doks.com/thumbv2/123dokinfo/5088135.76212/3.899.173.721.119.802/figure-sos-based-ncw-simulation-model-stochastic-property.webp)


![Figure 7: Abstracted network model using the DEVS formalism [26].](https://thumb-ap.123doks.com/thumbv2/123dokinfo/5088135.76212/7.899.193.696.106.547/figure-abstracted-network-model-using-devs-formalism.webp)

![Figure 10 illustrates the scenario of the NCW simulation model that includes complex and hierarchical information exchange among combat entities [55, 56]](https://thumb-ap.123doks.com/thumbv2/123dokinfo/5088135.76212/10.899.145.755.102.457/illustrates-scenario-simulation-includes-hierarchical-information-exchange-entities.webp)