Original Article
Breakfast eating patterns and the metabolic syndrome:
the Korea National Health and Nutrition Examination
Survey (KNHANES) 2007-2009
Ki-Bong Yoo
MPH1,2, Hee-Jae Suh
PhD3, Minjee Lee
MPH1,2, Jae-Hyun Kim
1,2,
Jeoung A Kwon
RN, MPH1,2, Eun-Cheol Park
MD, PhD2,41 Department of Public Health, Graduate School, Yonsei University, Seoul, Korea 2
Institute of Health Services Research, Yonsei University College of Medicine, Seoul, Korea 3
Department of Food Science, Sun Moon University, Chungnam, Korea
4 Department of Preventive Medicine, Yonsei University College of Medicine, Seoul, Korea
Objective: The purpose of this study is to find out the association between eating breakfast, breakfast patterns, and the metabolic syndrome. Methods: We used the fourth Korean National Health and Nutrition Examination Survey from 2007 to 2009. A total of 16,734 subjects were included. Breakfast dietary patterns were extracted by factor analysis. Multiple logistic regression was used to assess the relationship between breakfast consumption, breakfast dietary patterns, and the metabolic syndrome. Results: We found that breakfast consumption itself re-duced the risk of the metabolic syndrome (odds ratio=0.82, 95% confidence interval=0.69-0.98). We identified two breakfast dietary patterns: the traditional Korean pattern and the dairy-cereal pattern. The dairy-cereal pattern was associated with a reduction in the risk of the metabolic syndrome among breakfast consumers. Compared to no breakfast consumption, the strongest traditional Korean pattern and the highest quartiles for the dairy-cereal pattern were associated with a reduced risk of the metabolic syndrome. Conclusions: Breakfast consumption is associated with the metabolic syndrome. Not all breakfast consumption patterns are associated with a reduced risk of having the metabolic syndrome. In particular, eating either a dairy-cereal breakfast or high energy and fi-ber breakfast are associated with a reduced risk of the metabolic syndrome.
Key Words: breakfast, eating patterns, the metabolic syndrome, Korea, dairy-cereal
INTRODUCTION
The metabolic syndrome is the fastest growing disease in the world. Throughout the world, approximately one third have metabolic syndrome.1 According to the United States National Health and Nutritional Examination Survey (NHANES), the prevalence of the metabolic syndrome was approximately 34.2% in 2006.2 In the Korea NHANES (KNHANES) 2007, the prevalence of the metabolic syndrome increased to 31.3% in those aged 20 years and over.3 The metabolic syndrome in Korea saw a dramatic increase in its prevalence from 1998 to 2007.3 Koreans and other East Asians have a higher percentage of body fat than Caucasians at a fixed BMI.4 Therefore, East Asians are at higher risk of hypertension, hyperglycemia, dyslipidemia, and hyperuricemia than non-Hispanic, while Americans and African Americans.5,6 Nevertheless, the increasing rate of the metabolic syndrome in Korea is higher than the US or even other East Asian countries.5 The risk of the metabolic syndrome is associated with impaired blood glucose, elevated blood pressure, dyslipidemia, and abdominal obesity. These etiological factors are complex and poorly understood.7 The mortality burden of the metabolic syndrome has been reported as 9.4% for cardiovascular disease and 42.3% for diabetes.8 Also, the
presence of the metabolic syndrome inflates the economic burden of disease.9,10
A major method for treating the metabolic syndrome based on public health and health promotion activities is to modify one’s lifestyle with dietary intervention.11 For dietary intervention, dietary pattern analysis has emerged. A dietary pattern approach was used to examine the cumulative and possible synergistic effects of foods. Therefore, it might be more predictive of the risk for the metabolic syndrome than an individual food or nutrient12 and may suggest dietary guidelines.13 Many previous studies reported the association between dietary patterns and the metabolic syndrome, obesity and diabetes.12,14-16 In particular, clinical trials reported beneficial effects of a Mediterranean diet pattern on the metabolic syndrome.17
Corresponding Author: Dr Eun-Cheol Park, Department of
Preventive Medicine and Institute of Health Services Research, Yonsei University College of Medicine, 50 Yonsei-ro, Seodae-mun-gu, Seoul 120-752, Korea.
Tel: 82-2-2188-1862; Fax: 82-2-392-8133 Email: [email protected]
Manuscript received 19 March 2013. Initial review completed 10 May 2013. Revision accepted 20 July 2013.
Breakfast is the most important among meals because it is the time when prolonged fasting ceases. Longer fast-ing times are associated with higher ghrelin concentra-tions and lower insulin concentraconcentra-tions, which could in-duce hunger and eating.18,19 In addition, breakfast con-sumption has been shown to be particularly satiating and is associated with less appetite and improved weight con-trol.20,21 So, as compared with skipping breakfast, the consumption of breakfast contributes to the prevention of weight gain and the metabolic syndrome.20,22,23
Most Asian countries including Korea have diverse breakfast eating patterns because they have adopted west-ern style eating pattwest-erns.24-26 However, there are few stud-ies on the association between breakfast eating patterns and the metabolic syndrome in Asian countries. Infor-mation on proper breakfast dietary intervention is insuffi-cient enough to support such a hypothesis. Therefore, this study aimed to investigate the relationship between break-fast patterns and the metabolic syndrome in the Korean population.
MATERIALS AND METHODS Study population
We used the fourth KNHANES from 2007 to 2009, a cross-sectional and nationally representative survey ad-ministered by the Korean Ministry of Health and Welfare. Subjects who answered a 24-hour recall dietary intake questionnaire were included. After excluding those with diabetes because of dietary intervention,27 or those who were on dietary therapy, 16,734 of the original 18,316 possible participants remained for investigation.
The definition of the metabolic syndrome and other var-iables
We defined subjects as fulfilling three or more of the fol-lowing the metabolic syndrome criteria: triglycerides of at least 150 mg/dL or medication use, high-density lipopro-tein cholesterol less than 40 mg/dL in men or less than 50 mg/dL in women or medication use, high blood pressure of at least 130 mmHg systolic or at least 85 mmHg dias-tolic or anti hypertensive medication use, fasting glucose of at least 100 mg/dL or medication use (insulin or oral agents), and a waist circumference of at least 90 cm in men or at least 80 cm in women. These criteria are from the Adult Treatment Panel III of the National Cholesterol Education Program, which are the guidelines for Asian populations developed by the International Diabetes Fed-eration.28
As sociodemographic (age, sex, household income, and education) and health risk behaviors (smoking, drinking, physical activity, and obesity) were shown to affect the risk of the metabolic syndrome in previous studies,14,29 these variables were included as covariates.
Age was classified into groups of under 30, 30-49, 50-64, and over 65 years. Household income was classified into low, medium, and high groups. It was calculated by dividing the household monthly income by the square root of the household size.30,31 The education variable was grouped as elementary graduate, middle school graduate, high school graduate, and college or more. Smoking sta-tus was classified as never smoked, past smoker, or cur-rent smoker. Drinking status was classified as under one
glass of alcohol per month or over one glass of alcohol per month. Subjects were grouped on the basis of physi-cal activity into those who exercised intensively for over 20 minutes for more than 3 days per week and those who did not. Obesity was categorized as underweight (BMI<18.5), normal (18.5≤BMI<25.0), overweight (25.0≤BMI<27.0), and obese (27.0≤BMI).32
Energy intake, carbohydrate, protein, fat, crude fiber, sodium, dietary glycemic index (DGI), and dietary gly-cemic load (DGL) per day were adjusted for as nutrition factors, in not only breakfast but also the remaining time of the day. Dietary glycemic index and dietary glycemic were calculated for each subject using the following for-mulas.33
DGI = ∑(glycemic index of food × carbohydrate content of food / total amount of carbohydrate) DGL = ∑(glycemic index of food × carbohydrate
content of food / 100)
Dietary assessment and pattern analysis
For dietary assessment and pattern analysis we used 24-hour recall food intake information. There was a field that represented meal classification (eg, meal as breakfast, lunch, dinner or snack). We defined food intake at fast as the items which were answered as “Meal as break-fast”. A total of 2,746 food items were categorized into 37 food groups based on previous studies reflecting tradi-tional Korean food.14,28,34,35 Total intake amount, energy intake, carbohydrate, protein, fat, crude fiber, sodium, DGI, and DGL of each food group were collected for each person. Glycemic index and glycemic load data were retrieved from previous research.36
Statistical analysis
Distributions of general characteristics were tested by t-test and chi-square t-test. We used well-known statistical methods to assess dietary patterns and to conduct regres-sion analysis with their summary scores.37,38 Breakfast patterns were identified as a factor score by factor analy-sis (PROC FACTOR) with orthogonal rotation. Factor analysis is used to reduce the number of observed varia-bles to a smaller number of artificial variavaria-bles.39 The analysis generates diet patterns based on correlations be-tween food groups. The factor selection criterion was an eigenvalue >1.0; and we also used the scree test and con-sidered the interpretability of the factors. Scree test is a test for determining the number of factors by checking the slope of the factors’ eigenvalues on a Scree plot.40 Each factor score was divided into quartiles. Analysis of covar-iance (ANCOVA) was used to compare the characteris-tics and nutrition amount among quartiles of dietary pat-tern.
Multiple logistic regression models were used to assess the association between the metabolic syndrome and breakfast consumption and food-factor categorized varia-bles. Age, sex, education, physical activity, smoking sta-tus, drinking stasta-tus, household income, obesity variables, energy intake, carbohydrate, protein, fat, crude fiber, so-dium, DGI, and DGL per day were adjusted in the regres-sion model. The significance level was 0.05. All statisti-cal analyses were conducted with SAS version 9.2 (SAS Institute Inc, Cary, NC, USA).
RESULTS
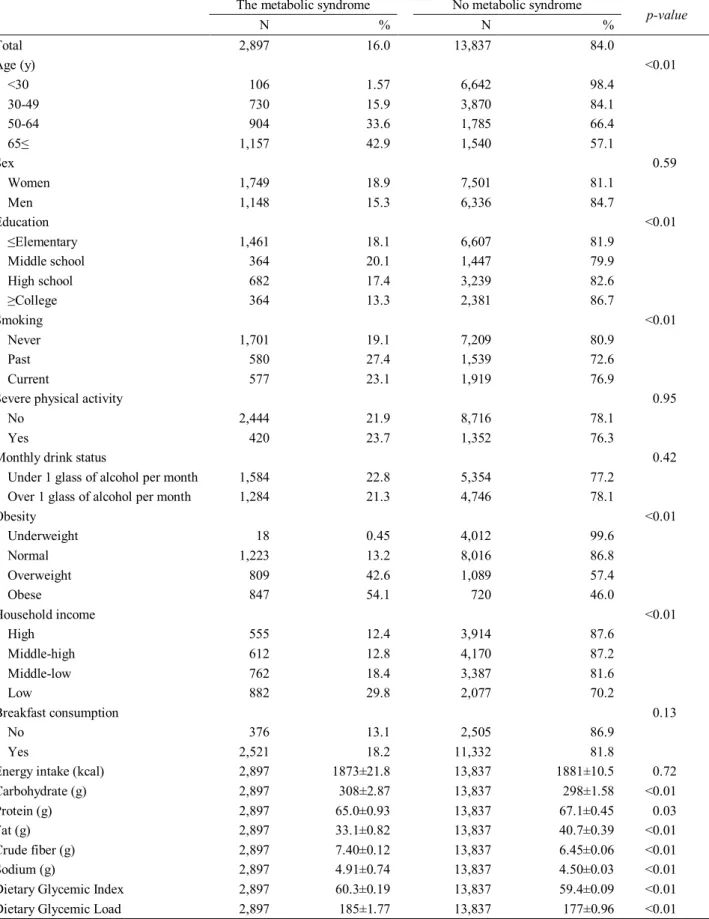
Table 1 shows the general characteristics of the study subjects. People who had the metabolic syndrome were older, past smokers, current smokers, overweight and obese. Those with the metabolic syndrome also usually have lower incomes, and have a higher carbohydrate,
sodium, DGI, and DGL. However, the average fat, pro-tein, energy consumptions of the metabolic syndrome subjects were lower than those without the metabolic syndrome. For breakfast consumption, there was not an association between eating breakfast and having the met-abolic syndrome.
Table 1. General characteristic of study subjects by the metabolic syndrome
The metabolic syndrome No metabolic syndrome
p-value N % N % Total 2,897 16.0 13,837 84.0 Age (y) <0.01 <30 106 1.57 6,642 98.4 30-49 730 15.9 3,870 84.1 50-64 904 33.6 1,785 66.4 65≤ 1,157 42.9 1,540 57.1 Sex 0.59 Women 1,749 18.9 7,501 81.1 Men 1,148 15.3 6,336 84.7 Education <0.01 ≤Elementary 1,461 18.1 6,607 81.9 Middle school 364 20.1 1,447 79.9 High school 682 17.4 3,239 82.6 ≥College 364 13.3 2,381 86.7 Smoking <0.01 Never 1,701 19.1 7,209 80.9 Past 580 27.4 1,539 72.6 Current 577 23.1 1,919 76.9
Severe physical activity 0.95
No 2,444 21.9 8,716 78.1
Yes 420 23.7 1,352 76.3
Monthly drink status 0.42
Under 1 glass of alcohol per month 1,584 22.8 5,354 77.2
Over 1 glass of alcohol per month 1,284 21.3 4,746 78.1
Obesity <0.01 Underweight 18 0.45 4,012 99.6 Normal 1,223 13.2 8,016 86.8 Overweight 809 42.6 1,089 57.4 Obese 847 54.1 720 46.0 Household income <0.01 High 555 12.4 3,914 87.6 Middle-high 612 12.8 4,170 87.2 Middle-low 762 18.4 3,387 81.6 Low 882 29.8 2,077 70.2 Breakfast consumption 0.13 No 376 13.1 2,505 86.9 Yes 2,521 18.2 11,332 81.8
Energy intake (kcal) 2,897 1873±21.8 13,837 1881±10.5 0.72
Carbohydrate (g) 2,897 308±2.87 13,837 298±1.58 <0.01
Protein (g) 2,897 65.0±0.93 13,837 67.1±0.45 0.03
Fat (g) 2,897 33.1±0.82 13,837 40.7±0.39 <0.01
Crude fiber (g) 2,897 7.40±0.12 13,837 6.45±0.06 <0.01
Sodium (g) 2,897 4.91±0.74 13,837 4.50±0.03 <0.01
Dietary Glycemic Index 2,897 60.3±0.19 13,837 59.4±0.09 <0.01
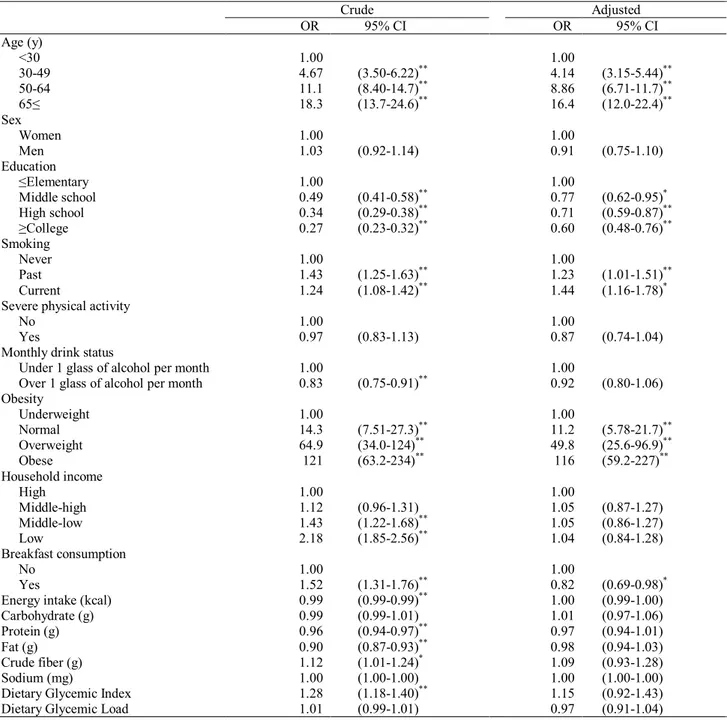
Table 2 shows the multiple logistic regression results with crude and adjusted odds ratios (ORs) and 95% con-fidence intervals (CIs) for the relationship between the metabolic syndrome and breakfast consumption. We found that breakfast consumption increased the odds of having the metabolic syndrome (OR=1.52, 95% CI=1.31-1.76). However, this association became negative associa-tion after adjusting for age and sex (OR=0.80, 95% CI=0.68-0.93). This association also existed in the fully adjusted model (OR=0.82, 95% CI=0.69-0.98).
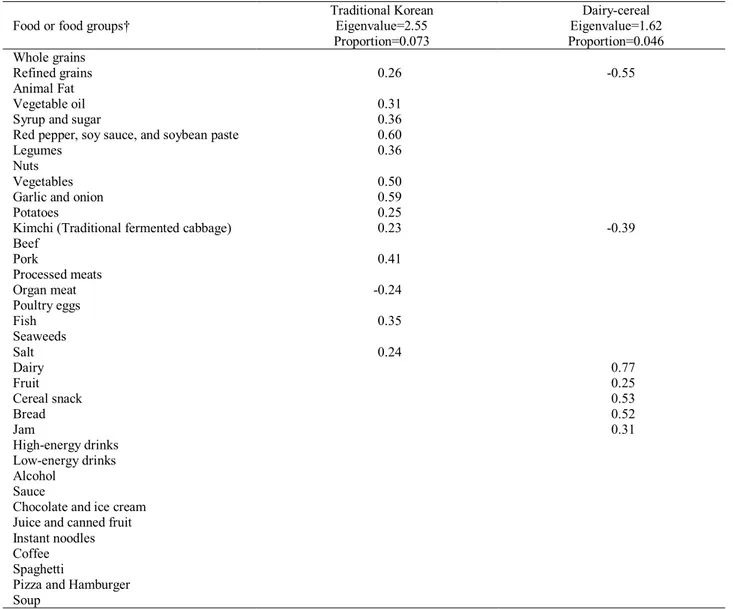
The food group factor loading matrix is shown in Table 3, whereby two patterns were extracted: 1) the dairy-cereal pattern; and 2) the traditional Korean pattern. The dairy-cereal pattern was characterized by a high content of bread, cereal snack, dairy, fruit, and jam and a low content of refined grains and kimchi, which is fermented
cabbage. The traditional Korean diet was characterized by a high content of refined grains, red pepper and soybean paste, legumes, vegetables, garlic and onion, kimchi, pork, potatoes, salt and a low content of seaweeds. The tradi-tional Korean pattern consisted of many food items of complex carbohydrate which are grains, potatoes, leg-umes, and soy bean.
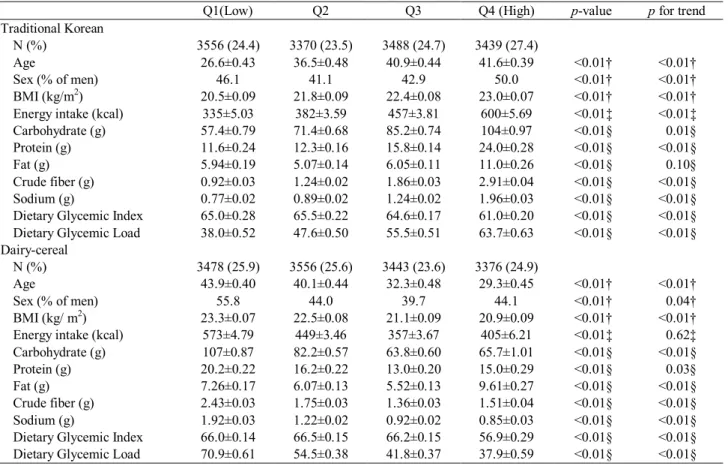
General characteristics and nutrition information are shown in Table 4. People who had a strong traditional Korean breakfast dietary pattern tended to be older, have a higher BMI, and have a diet high in energy, carbohy-drate, protein, fat, fiber, and DGL. The average sodium intake gradually increased in the traditional Korean pat-tern. Otherwise, younger people had a strong dairy-cereal pattern. Several nutritional parameters were decreased in the dairy-cereal pattern, including carbohydrates, sodium, Table 2. Multiple logistic regression with crude and adjusted ORs and 95% CIs for the metabolic syndrome and break-fast consumption. Crude Adjusted OR 95% CI OR 95% CI Age (y) <30 1.00 1.00 30-49 4.67 (3.50-6.22)** 4.14 (3.15-5.44)** 50-64 11.1 (8.40-14.7)** 8.86 (6.71-11.7)** 65≤ 18.3 (13.7-24.6)** 16.4 (12.0-22.4)** Sex Women 1.00 1.00 Men 1.03 (0.92-1.14) 0.91 (0.75-1.10) Education ≤Elementary 1.00 1.00 Middle school 0.49 (0.41-0.58)** 0.77 (0.62-0.95)* High school 0.34 (0.29-0.38)** 0.71 (0.59-0.87)** ≥College 0.27 (0.23-0.32)** 0.60 (0.48-0.76)** Smoking Never 1.00 1.00 Past 1.43 (1.25-1.63)** 1.23 (1.01-1.51)** Current 1.24 (1.08-1.42)** 1.44 (1.16-1.78)*
Severe physical activity
No 1.00 1.00
Yes 0.97 (0.83-1.13) 0.87 (0.74-1.04)
Monthly drink status
Under 1 glass of alcohol per month 1.00 1.00
Over 1 glass of alcohol per month 0.83 (0.75-0.91)** 0.92 (0.80-1.06)
Obesity Underweight 1.00 1.00 Normal 14.3 (7.51-27.3)** 11.2 (5.78-21.7)** Overweight 64.9 (34.0-124)** 49.8 (25.6-96.9)** Obese 121 (63.2-234)** 116 (59.2-227)** Household income High 1.00 1.00 Middle-high 1.12 (0.96-1.31) 1.05 (0.87-1.27) Middle-low 1.43 (1.22-1.68)** 1.05 (0.86-1.27) Low 2.18 (1.85-2.56)** 1.04 (0.84-1.28) Breakfast consumption No 1.00 1.00 Yes 1.52 (1.31-1.76)** 0.82 (0.69-0.98)*
Energy intake (kcal) 0.99 (0.99-0.99)** 1.00 (0.99-1.00)
Carbohydrate (g) 0.99 (0.99-1.01) 1.01 (0.97-1.06)
Protein (g) 0.96 (0.94-0.97)** 0.97 (0.94-1.01)
Fat (g) 0.90 (0.87-0.93)** 0.98 (0.94-1.03)
Crude fiber (g) 1.12 (1.01-1.24)* 1.09 (0.93-1.28)
Sodium (mg) 1.00 (1.00-1.00) 1.00 (1.00-1.00)
Dietary Glycemic Index 1.28 (1.18-1.40)** 1.15 (0.92-1.43)
Dietary Glycemic Load 1.01 (0.99-1.01) 0.97 (0.91-1.04)
DGI, and DGL. The dairy-cereal pattern was healthier than the traditional Korean pattern when considering the average amount of BMI, carbohydrate, sodium, and DGL.
Table 5 shows the associations between two dietary patterns and the risk of the metabolic syndrome in break-fast consumers. For the traditional Korean pattern, only Q2 was significantly associated with a decreased OR of having the metabolic syndrome compared to Q1 (OR= 0.77, 95% CI=0.62-0.96) whereas the association be-tween the dairy-cereal pattern and the reduced risk of the metabolic syndrome was further strengthened (p for trend=0.01). The Q3 (OR=0.79) and Q4 (OR=0.73) of the dairy-cereal pattern were significantly associated with having the metabolic syndrome.
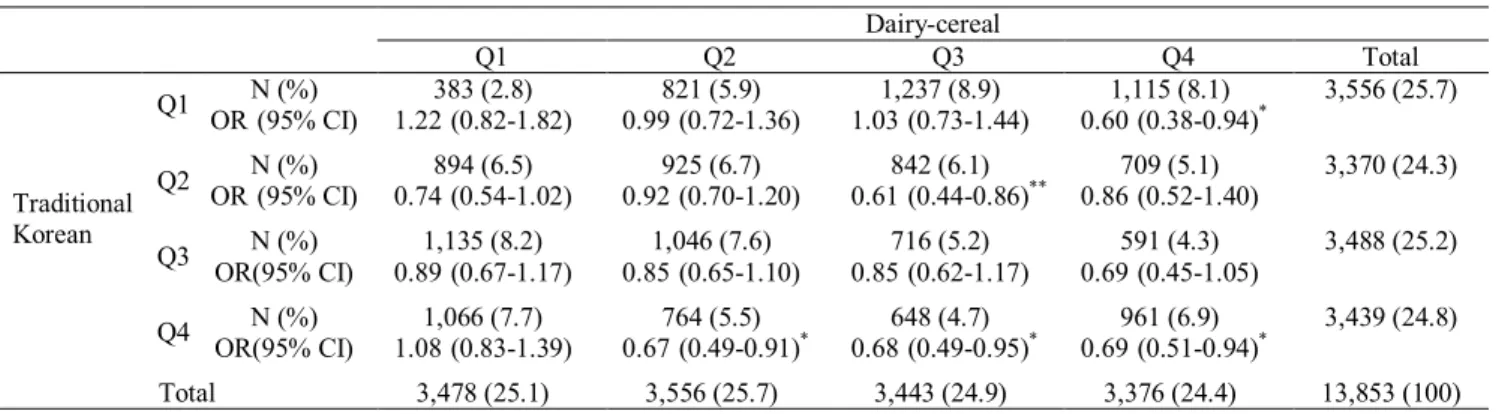
Table 6 shows the number and multiple logistic regres-sion results of the two dietary patterns. All subjects were almost equally distributed. The dairy-cereal pattern Q3-traditional Korean Q1 was the largest cell with 1,237 sub-jects, whereas the dairy-cereal pattern Q1-traditional Ko-rean Q3 cell was the second largest. Multiple logistic re-gression was conducted to compare each dietary pattern with having no breakfast for the risk of the metabolic syndrome. Compared with no-breakfast, the following were associated in order with a reduced risk of the
meta-bolic syndrome: dairy-cereal Q2-traditional Korean Q4 (OR=0.67, 95% CI=0.49-0.91), dairy-cereal Q3-tradition Korean Q2 (OR=0.61, 95% CI=0.44-0.86), dairy-cereal Q3-tradition Korean Q4 (OR=0.68, 95% CI=0.49-0.95), dairy-cereal Q4-traditional Korean Q1 (OR=0.60, 95% CI=0.38-0.94), and dairy-cereal Q4-traditional Korean Q4 (OR=0.69, 95% CI=0.51-0.94). This indicates that a greater score for the dairy-cereal pattern or the traditional Korean pattern was associated with fewer people having the metabolic syndrome.
DISCUSSION
Some studies identified the correlation between eating breakfast and the occurrence of some diseases. Smith et al reported that skipping breakfast over a long period time may be associated with cardio-metabolic health41 and van der Heijden et al showed that breakfast consumption con-tributes to the prevention of weight gain, unlike breakfast omission.22 As a result of this study for the relationship between eating breakfast and the risk of the metabolic syndrome, breakfast consumption reduced the risk of the metabolic syndrome. Studies that reported breakfast con-sumption is associated with the risk factors of the meta-bolic syndrome support this result.20,23,42,43 In order to Table 3. Factor loading matrix of food groups
Food or food groups†
Traditional Korean Eigenvalue=2.55 Proportion=0.073 Dairy-cereal Eigenvalue=1.62 Proportion=0.046 Whole grains Refined grains 0.26 -0.55 Animal Fat Vegetable oil 0.31
Syrup and sugar 0.36
Red pepper, soy sauce, and soybean paste 0.60
Legumes 0.36
Nuts
Vegetables 0.50
Garlic and onion 0.59
Potatoes 0.25
Kimchi (Traditional fermented cabbage) 0.23 -0.39
Beef Pork 0.41 Processed meats Organ meat -0.24 Poultry eggs Fish 0.35 Seaweeds Salt 0.24 Dairy 0.77 Fruit 0.25 Cereal snack 0.53 Bread 0.52 Jam 0.31 High-energy drinks Low-energy drinks Alcohol Sauce
Chocolate and ice cream Juice and canned fruit Instant noodles Coffee Spaghetti
Pizza and Hamburger Soup
clarify the above study results, we had to assess the fact that the reduction of the risk might be directly affected by eating breakfast itself or the kinds of breakfast eaten. We classified the Korean Breakfast as two types, which are almost the same as previous studies; one is dairy-cereal breakfast pattern and the other traditional Korean fast pattern. We analyzed the association between break-fast types and the metabolic syndrome.24,25
Main items containing the dairy-cereal pattern are fruit, dairy, cereal, jam, and bread. In this study, the result showed that dairy-cereal breakfast pattern is associated with metabolic syndrome. Many studies have suggested that cereal, bread, and fruit could cause a reduction in the metabolic syndrome. Cereal is associated with a protec-tive effect against the metabolic syndrome.44 Consuming bread for breakfast is associated with a significantly low-er BMI compared with skipping breakfast or eating meats or eggs.45 Additionally, the combination of bread and dairy consumption is associated with the prevalence of the metabolic syndrome.46 Fruit consumption also has a strong negative association with the risk for the metabolic syndrome.14 A strong dairy-cereal pattern has low sodium, DGI, and DGL, of which the latter has adverse effects on serum lipid levels and glucose metabolism, which in-creases the risk for metabolic abnormalities.47
The major item of traditional Korean dietary pattern is refined grain (such as steamed rice), rich in carbohydrate and high GL. In addition, the pattern itself has higher amount of carbohydrate, sodium, and fiber, compared with the dairy-cereal pattern. It is still disputable, whether
the patterns may trigger reduction of the risk for the met-abolic syndrome. Some studies have reported that break-fast patterns increase risk,14,48 but other studies have shown the opposite results.49,50 In this study, the tradition-al Korean pattern was partly associated with the risk of the metabolic syndrome among breakfast consumers. Therefore, it is hard to recommend the traditional Korean pattern as a healthy breakfast. Nevertheless, the Q4 tradi-tional Korean pattern was associated with a reduced risk Table 4. Characteristics by quartiles for each breakfast dietary pattern
Q1(Low) Q2 Q3 Q4 (High) p-value p for trend
Traditional Korean
N (%) 3556 (24.4) 3370 (23.5) 3488 (24.7) 3439 (27.4)
Age 26.6±0.43 36.5±0.48 40.9±0.44 41.6±0.39 <0.01† <0.01†
Sex (% of men) 46.1 41.1 42.9 50.0 <0.01† <0.01†
BMI (kg/m2) 20.5±0.09 21.8±0.09 22.4±0.08 23.0±0.07 <0.01† <0.01†
Energy intake (kcal) 335±5.03 382±3.59 457±3.81 600±5.69 <0.01‡ <0.01‡
Carbohydrate (g) 57.4±0.79 71.4±0.68 85.2±0.74 104±0.97 <0.01§ 0.01§
Protein (g) 11.6±0.24 12.3±0.16 15.8±0.14 24.0±0.28 <0.01§ <0.01§
Fat (g) 5.94±0.19 5.07±0.14 6.05±0.11 11.0±0.26 <0.01§ 0.10§
Crude fiber (g) 0.92±0.03 1.24±0.02 1.86±0.03 2.91±0.04 <0.01§ <0.01§
Sodium (g) 0.77±0.02 0.89±0.02 1.24±0.02 1.96±0.03 <0.01§ <0.01§
Dietary Glycemic Index 65.0±0.28 65.5±0.22 64.6±0.17 61.0±0.20 <0.01§ <0.01§
Dietary Glycemic Load 38.0±0.52 47.6±0.50 55.5±0.51 63.7±0.63 <0.01§ <0.01§
Dairy-cereal
N (%) 3478 (25.9) 3556 (25.6) 3443 (23.6) 3376 (24.9)
Age 43.9±0.40 40.1±0.44 32.3±0.48 29.3±0.45 <0.01† <0.01†
Sex (% of men) 55.8 44.0 39.7 44.1 <0.01† 0.04†
BMI (kg/ m2) 23.3±0.07 22.5±0.08 21.1±0.09 20.9±0.09 <0.01† <0.01†
Energy intake (kcal) 573±4.79 449±3.46 357±3.67 405±6.21 <0.01‡ 0.62‡
Carbohydrate (g) 107±0.87 82.2±0.57 63.8±0.60 65.7±1.01 <0.01§ <0.01§
Protein (g) 20.2±0.22 16.2±0.22 13.0±0.20 15.0±0.29 <0.01§ 0.03§
Fat (g) 7.26±0.17 6.07±0.13 5.52±0.13 9.61±0.27 <0.01§ <0.01§
Crude fiber (g) 2.43±0.03 1.75±0.03 1.36±0.03 1.51±0.04 <0.01§ <0.01§
Sodium (g) 1.92±0.03 1.22±0.02 0.92±0.02 0.85±0.03 <0.01§ <0.01§
Dietary Glycemic Index 66.0±0.14 66.5±0.15 66.2±0.15 56.9±0.29 <0.01§ <0.01§
Dietary Glycemic Load 70.9±0.61 54.5±0.38 41.8±0.37 37.9±0.59 <0.01§ <0.01§
† Not adjusted
‡ Adjusted for age, sex, and BMI
§ Adjusted for age, sex, BMI, and energy intake
Table 5. The association between the metabolic syn-drome and two breakfast patterns among breakfast consumers † OR 95% CI p for trend Traditional Korean 0.09 Q1(Low) 1.00 Q2 0.77 (0.62-0.96)* Q3 0.84 (0.68-1.04) Q4(High) 0.83 (0.68-1.02) Dairy-cereal 0.01 Q1(Low) 1.00 Q2 0.87 (0.74-1.02) Q3 0.79 (0.65-0.97)* Q4(High) 0.73 (0.58-0.93)**
† Age, sex, education, smoking, physical activity, drink status, obesity, household income, and nutrition (energy intake, protein intake, fat intake, carbohydrate intake, crude fiber intake, sodium intake, DGI, DGL) per day are adjusted.
of the metabolic syndrome compared to no breakfast con-sumption, even though the traditional Korean pattern was associated with a greater BMI and a diet high in energy, carbohydrate, fat, and DGL. The Q4 traditional Korean pattern has the highest level of energy and fiber in the breakfast pattern. This finding can be supported by many previous studies, which recommend high-energy intake at breakfast. Interestingly, obese people consume less ener-gy for breakfast.45 Higher energy intake at breakfast is associated with a lower BMI in adolescents.51 Children with a lower DGI at breakfast consume more energy throughout the remainder of the day than do children with a higher DGI at breakfast.52 In the UK Norfolk cohort study, it was shown that more energy is consumed at breakfast and less energy is consumed later in the day.53 Even though the strongest traditional Korean pattern is unhealthy, it reduced the risk for the metabolic syndrome. W e n e e d f u r t h er s t u d y a b o u t t h e s e f i n d i n g s. Our study has some advantages over other studies. This is the first study to our knowledge, which evaluated the association between breakfast consumption and breakfast pattern with the metabolic syndrome using a representa-tive national data. Furthermore, we considered dietary patterns when assessing the effect of intake of various foods at breakfast with the risk for the metabolic syn-drome. Therefore, this result can be applied to real-life easily. Only Min et al’s study54 was similar to ours as a study on breakfast patterns and the metabolic syndrome. Some breakfast patterns were associated with elevated fasting glucose, elevated blood pressure, or elevated se-rum triglycerides in Min et al’s study; however no pat-terns were directly associated with risk for the metabolic syndrome. The limitations of Min et al’s study were that the number of subjects was small, subjects were recruited within a limited region, and lifestyle information was not collected. Our study extended and clarified the previous study findings. In particular, we identified breakfast pat-terns’ direct associations on the risk of the metabolic syn-drome.
The limitations of this study are as follows. We could not identify the causal effect between the metabolic syn-drome and breakfast patterns because of the limitations of the cross-sectional data. Second, the dietary data
com-prise a single day 24-hour recall, which may or may not represent a subject’s general eating pattern.
In our study, we identified that breakfast consumption is associated with a reduced risk of having the metabolic syndrome. However, not all breakfast consumption pat-terns are associated with the risk for the metabolic syn-drome risk. By factor analysis we identified two different breakfast patterns in Korea. One is the dairy-cereal pat-tern and the other is the traditional Korean patpat-tern. The dairy-cereal pattern was associated with a reduction in the risk of the metabolic syndrome among breakfast consum-ers. Compared with the no-breakfast consumer, only the strong-Q4 traditional Korean pattern and the Q2, Q3 and Q4 dairy-cereal patterns were associated with a reduced risk of the metabolic syndrome. This signifies that eating a strong dairy-cereal pattern or eating higher energy and fiber at breakfast may reduce the risk for the metabolic syndrome. Further studies are needed to determine this association in other Asian countries and to conduct an in-depth analysis of each breakfast pattern, such as the asso-ciation between nutrients consumed at breakfast and the metabolic syndrome, between specific foods at breakfast and the metabolic syndrome, or between nutrients con-sumed at breakfast and that during the remainder of the day. These findings might help refine the development of breakfast guidelines to prevent the metabolic syndrome.
ACKNOWLEDGMENTS
No funding source.
AUTHOR DISCLOSURES
The authors declare that they have no conflicts of interests.
REFERENCES
1. Lugnier C. PDE inhibitors: a new approach to treat metabolic syndrome? Curr Opin Pharmacol. 2011;11:698-706. doi: 10.1016/j.coph.2011.09.012
2. Mozumdar A, Liguori G. Persistent increase of prevalence of metabolic syndrome among U.S. adults: NHANES III to NHANES 1999-2006. Diabetes Care. 2011;34:216-9. doi: 10.2337/dc10-0879
3. Lim S, Shin H, Song JH, Kwak SH, Kang SM, Won Yoon J et al. Increasing prevalence of metabolic syndrome in Korea: the Korean National Health and Nutrition Examination Survey for 1998-2007. Diabetes Care. 2011;34:1323-8. doi: 10.2337/dc10-2109
Table 6. The association between the metabolic syndrome and breakfast patterns compared to no breakfast consumption†
Dairy-cereal Q1 Q2 Q3 Q4 Total Traditional Korean Q1 N (%) ** 383 (2.8)** 821 (5.9)** 1,237 (8.9)** 1,115 (8.1)** 3,556 (25.7) OR*(95% CI)** 1.22*(0.82-1.82)** 0.99*(0.72-1.36)** 1.03*(0.73-1.44)** 0.60*(0.38-0.94)** Q2 N (%) ** 894 (6.5)** 925 (6.7)** 842 (6.1)** 709 (5.1)** 3,370 (24.3) OR*(95% CI)** 0.74*(0.54-1.02)** 0.92*(0.70-1.20)** 0.61*(0.44-0.86)** 0.86*(0.52-1.40)** Q3 N (%) ** 1,135 (8.2)** 1,046 (7.6)** 716 (5.2)** 591 (4.3)** 3,488 (25.2) OR(95% CI)** 0.89*(0.67-1.17)** 0.85*(0.65-1.10)** 0.85*(0.62-1.17)** 0.69*(0.45-1.05)** Q4 N (%) ** 1,066 (7.7)** 764 (5.5)** 648 (4.7)** 961 (6.9)** 3,439 (24.8) OR(95% CI)** 1.08*(0.83-1.39)** 0.67*(0.49-0.91)** 0.68*(0.49-0.95)** 0.69*(0.51-0.94)** Total 3,478 (25.1)** 3,556 (25.7)** 3,443 (24.9)** 3,376 (24.4)** 13,853 (100)
† Age, sex, education, smoking, physical activity, drink status, obesity, household income, and nutrition (energy intake, protein intake, fat intake, carbohydrate intake, crude fiber intake, sodium intake, DGI, DGL) per day are adjusted.
4. Chung S, Song MY, Shin HD, Kim DY, He Q, Heshka S et al. Korean and Caucasian overweight premenopausal women have different relationship of body mass index to percent body fat with age. J Appl Physiol. 2005;99:103-7. doi: 10. 1152/japplphysiol.01153.2004
5. Pan WH, Yeh WT, Weng LC. Epidemiology of metabolic syndrome in Asia. Asia Pac J Clin Nutr. 2008;17(Suppl 1): 37-42.
6. Nestel P, Lyu R, Low LP, Sheu WH, Nitiyanant W, Saito I, Tan CE. Metabolic syndrome: recent prevalence in East and Southeast Asian populations. Asia Pac J Clin Nutr. 2007;16: 362-7.
7. Alberti KG, Eckel RH, Grundy SM, Zimmet PZ, Cleeman JI, Donato KA et al. Harmonizing the metabolic syndrome: a joint interim statement of the International Diabetes Federation Task Force on Epidemiology and Prevention; National Heart, Lung, and Blood Institute; American Heart Association; World Heart Federation; International Atherosclerosis Society; and International Association for the Study of Obesity. Circulation. 2009;120:1640-5. doi: 10. 1161/CIRCULATIONAHA.109.192644
8. Wen CP, Chan HT, Tsai MK, Cheng TY, Chung WS, Chang YC et al. Attributable mortality burden of metabolic syndrome: comparison with its individual components. Eur J Cardiovasc Prev Rehabil. 2011;18:561-73. doi: 10.1177/ 1741826710389422
9. Kim A, Kwak C, Yim ES. Influencing Factors for and Medical Expenditures of Metabolic Syndrome among Public Officials. Korean J Occup Health Nurs. 2012;21:209-20 (In Korean). doi: 10.5807/kjohn.2012.21.3.209
10. Scholze J, Alegria E, Ferri C, Langham S, Stevens W, Jeffries D, Uhl-Hochgraeber K. Epidemiological and economic burden of metabolic syndrome and its consequences in patients with hypertension in Germany, Spain and Italy; a prevalence-based model. BMC Public Health. 2010;10:529. doi: 10.1186/1471-2458-10-529 11. Yamaoka K, Tango T. Effects of lifestyle modification on
metabolic syndrome: a systematic review and meta-analysis. BMC Med. 2012;10:138. doi: 10.1186/1741-7015-10-138 12. Djousse L, Padilla H, Nelson TL, Gaziano JM, Mukamal KJ.
Diet and metabolic syndrome. Endocr Metab Immune Disord Drug Targets. 2010;10:124-37. doi: 10.2174/187153 010791213056
13. Willett WC, McCullough ML. Dietary pattern analysis for the evaluation of dietary guidelines. Asia Pac J Clin Nutr. 2008;17(Suppl 1):75-8.
14. Hong S, Song Y, Lee KH, Lee HS, Lee M, Jee SH, Joung H. A fruit and dairy dietary pattern is associated with a reduced risk of metabolic syndrome. Metabolism. 2012;61:883-90. doi: 10.1016/j.metabol.2011.10.018
15. DiBello JR, McGarvey ST, Kraft P, Goldberg R, Campos H, Quested C, Laumoli TS, Baylin A. Dietary patterns are associated with metabolic syndrome in adult Samoans. J Nutr. 2009;139:1933-43. doi: 10.3945/jn.109.107888 16. Mekary RA, Giovannucci E, Willett WC, van Dam RM, Hu
FB. Eating patterns and type 2 diabetes risk in men: breakfast omission, eating frequency, and snacking. Am J Clin Nutr. 2012;95:1182-9. doi: 10.3945/ajcn.111.028209 17. Kastorini CM, Milionis HJ, Esposito K, Giugliano D,
Goudevenos JA, Panagiotakos DB. The effect of Mediterranean diet on metabolic syndrome and its components: a meta-analysis of 50 studies and 534,906 individuals. J Am Coll Cardiol. 2011;57:1299-313. doi: 10. 1016/j.jacc.2010.09.073
18. Cummings DE, Purnell JQ, Frayo RS, Schmidova K, Wisse BE, Weigle DS. A preprandial rise in plasma ghrelin levels
suggests a role in meal initiation in humans. Diabetes. 2001; 50:1714-9. doi: 10.2337/diabetes.50.8.1714
19. Boyle PJ, Shah SD, Cryer PE. Insulin, glucagon, and catecholamines in prevention of hypoglycemia during fasting. Am J Physiol. 1989;256:E651-61.
20. Astbury NM, Taylor MA, Macdonald IA. Breakfast consumption affects appetite, energy intake, and the metabolic and endocrine responses to foods consumed later in the day in male habitual breakfast eaters. J Nutr. 2011; 141:1381-9. doi: 10.3945/jn.110.128645
21. de Castro JM. The time of day of food intake influences overall intake in humans. J Nutr. 2004;134:104-11.
22. van der Heijden AA, Hu FB, Rimm EB, van Dam RM. A prospective study of breakfast consumption and weight gain among U.S. men. Obesity (Silver Spring). 2007;15:2463-9. doi: 10.1038/oby.2007.292
23. Thompson-McCormick JJ, Thomas JJ, Bainivualiku A, Khan AN, Becker AE. Breakfast skipping as a risk correlate of overweight and obesity in school-going ethnic Fijian adolescent girls. Asia Pac J Clin Nutr. 2010;19:372-82. 24. Cheung BM. The cardiovascular continuum in Asia--a new
paradigm for the metabolic syndrome. J Cardiovasc Pharmacol. 2005;46:125-9. doi: 10.1097/01.fjc.0000171752. 43564.35
25. Kim S, Moon S, Popkin BM. The nutrition transition in South Korea. Am J Clin Nutr. 2000;71:44-53.
26. Pingali P. Westernization of Asian diets and the transformation of food systems: Implications for research and policy. Food Policy. 2007;32:281-98. doi: 10.1016/j. foodpol.2006.08.001
27. Standards of medical care in diabetes--2012. Diabetes Care. 2012;35(Suppl 1):S11-63.
28. Choi KM, Kim SM, Kim YE, Choi DS, Baik SH, Lee J. Prevalence and cardiovascular disease risk of the metabolic syndrome using National Cholesterol Education Program and International Diabetes Federation definitions in the Korean population. Metabolism. 2007;56:552-8. doi: 10. 1016/j.metabol.2006.12.003
29. Park YW, Zhu S, Palaniappan L, Heshka S, Carnethon MR, Heymsfield SB. The metabolic syndrome: prevalence and associated risk factor findings in the US population from the Third National Health and Nutrition Examination Survey, 1988-1994. Arch Intern Med. 2003;163:427-36. doi: 10. 1001/archinte.163.4.427
30. Lee K, Lim HT, Hwang SS, Chae DW, Park SM. Socio-economic disparities in behavioural risk factors for cancer and use of cancer screening services in Korean adults aged 30 years and older: the Third Korean National Health and Nutrition Examination Survey, 2005 (KNHANES III). Public Health. 2010;124:698-704. doi: 10.1016/j.puhe.2010. 07.004
31. Deaton A, Lubotsky D. Mortality, inequality and race in American cities and states. Soc Sci Med. 2003;56:1139-53. doi: 10.1016/S0277-9536(02)00115-6
32. Joslin Diabetes Center. Asian American Diabetes Initiative. Available from: http://aadi.joslin.org/content/bmi-calculator. 33. Finley CE, Barlow CE, Halton TL, Haskell WL. Glycemic
index, glycemic load, and prevalence of the metabolic syndrome in the cooper center longitudinal study. J Am Diet Assoc. 2010;110:1820-9. doi: 10.1016/j.jada.2010.09.016 34. Leung CW, Ding EL, Catalano PJ, Villamor E, Rimm EB,
Willett WC. Dietary intake and dietary quality of low-income adults in the Supplemental Nutrition Assistance Program. Am J Clin Nutr. 2012;96:977-88. doi: 10.3945/ ajcn.112.040014
35. Rimm EB, Giovannucci EL, Stampfer MJ, Colditz GA, Litin LB, Willett WC. Reproducibility and validity of an
expanded self-administered semiquantitative food frequency questionnaire among male health professionals. Am J Epidemiol. 1992;135:1114-26.
36. Song S, Choi H, Lee S, Park J, Kim BR, Paik H, Song Y. Establishing a Table of Glycemic Index Values for Common Korean Foods and an Evaluation of the Dietary Glycemic Index among the Korean Adult Population. Korean J Nutr. 2012;45:80-93 (In Korean). doi: 10.4163/kjn. 2012.45.1.80 37. Hu FB. Dietary pattern analysis: a new direction in
nutritional epidemiology. Curr Opin Lipidol. 2002;13:3-9. doi: 10.1097/00041433-200202000-00002
38. Hu FB, Rimm E, Smith-Warner SA, Feskanich D, Stampfer MJ, Ascherio A, Sampson L, Willett WC. Reproducibility and validity of dietary patterns assessed with a food-frequency questionnaire. Am J Clin Nutr. 1999;69:243-9. 39. Suhr D. SUGI 30 Paper 203:Principal Component Analysis
vs. Exploratory Factor Analysis 2005. Available from: http://www2.sas.com/proceedings/sugi30/203-30.pdf. 40. Kim JO, Mueller CW. Factor analysis: statistical methods
and practical issues. Thousand Oaks ed. CA: Sage Publications, Inc; 1978.
41. Smith KJ, Gall SL, McNaughton SA, Blizzard L, Dwyer T, Venn AJ. Skipping breakfast: longitudinal associations with cardiometabolic risk factors in the Childhood Determinants of Adult Health Study. Am J Clin Nutr. 2010;92:1316-25. doi: 10.3945/ajcn.2010.30101
42. Farshchi HR, Taylor MA, Macdonald IA. Deleterious effects of omitting breakfast on insulin sensitivity and fasting lipid profiles in healthy lean women. Am J Clin Nutr. 2005;81: 388-96.
43. Tin SP, Ho SY, Mak KH, Wan KL, Lam TH. Location of breakfast consumption predicts body mass index change in young Hong Kong children. Int J Obes (Lond). 2012;36: 925-30. doi: 10.1038/ijo.2011.262
44. Hosseinpour-Niazi S, Mirmiran P, Sohrab G, Hosseini-Esfahani F, Azizi F. Inverse association between fruit, legume, and cereal fiber and the risk of metabolic syndrome: Tehran Lipid and Glucose Study. Diabetes Res Clin Pract. 2011;94:276-83. doi: 10.1016/j.diabres.2011.07.020
45. Cho S, Dietrich M, Brown CJ, Clark CA, Block G. The
effect of breakfast type on total daily energy intake and body mass index: results from the Third National Health and Nutrition Examination Survey (NHANES III). J Am Coll Nutr. 2003;22:296-302. doi: 10.1080/07315724.2003.10719 307 46. Mennen LI, Lafay L, Feskens EJM, Novak M, Lépinay P,
Balkau B. Possible protective effect of bread and dairy products on the risk of the metabolic syndrome. Nutrition Research. 2000;20:335-47. doi: 10.1016/S0271-5317(00)00 127-5
47. Schulze MB, Liu S, Rimm EB, Manson JE, Willett WC, Hu FB. Glycemic index, glycemic load, and dietary fiber intake and incidence of type 2 diabetes in younger and middle-aged women. Am J Clin Nutr. 2004;80:348-56.
48. Kim J, Jo I, Joung H. A rice-based traditional dietary pattern is associated with obesity in Korean adults. J Acad Nutr Diet. 2012;112:246-53. doi: 10.1016/j.jada.2011.10.005
49. Song Y, Joung H. A traditional Korean dietary pattern and metabolic syndrome abnormalities. Nutr Metab Cardiovasc Dis. 2012;22:456-62. doi: 10.1016/j.numecd.2010.09.002 50. Joung H, Hong S, Song Y, Ahn BC, Park MJ. Dietary
patterns and metabolic syndrome risk factors among adolescents. Korean J Pediatr. 2012;55:128-35. doi: 10.33 45/kjp.2012.55.4.128
51. Summerbell CD, Moody RC, Shanks J, Stock MJ, Geissler C. Relationship between feeding pattern and body mass index in 220 free-living people in four age groups. Eur J Clin Nutr. 1996;50:513-9.
52. Buyken AE, Trauner K, Gunther AL, Kroke A, Remer T. Breakfast glycemic index affects subsequent daily energy intake in free-living healthy children. Am J Clin Nutr. 2007; 86:980-7.
53. Purslow LR, Sandhu MS, Forouhi N, Young EH, Luben RN, Welch AA, Khaw KT, Bingham SA, Wareham NJ. Energy intake at breakfast and weight change: prospective study of 6,764 middle-aged men and women. Am J Epidemiol. 2008; 167:188-92. doi: 10.1093/aje/kwm309
54. Min C, Noh H, Kang YS, Sim HJ, Baik HW, Song WO, Yoon J, Park YH, Joung H. Breakfast patterns are associated with metabolic syndrome in Korean adults. Nutr Res Pract. 2012;6:61-7. doi: 10.4162/nrp.2012.6.1.61
Original Article
Breakfast eating patterns and the metabolic syndrome:
the Korea National Health and Nutrition Examination
Survey (KNHANES) 2007-2009
Ki-Bong Yoo
MPH1,2, Hee-Jae Suh
PhD3, Minjee Lee
MPH1,2, Jae-Hyun Kim
1,2,
Jeoung A Kwon
RN,MPH1,2, Eun-Cheol Park
MD, PhD2,41
Department of Public Health, Graduate School, Yonsei University, Seoul, Korea 2
Institute of Health Services Research, Yonsei University College of Medicine, Seoul, Korea 3 Department of Food Science, Sun Moon University, Chungnam, Korea
4
Department of Preventive Medicine, Yonsei University College of Medicine, Seoul, Korea