INTRODUCTION
Meat is a source of protein, vitamins, minerals, and essential fatty acids, but it also contains saturated fatty acids, cholesterol, and iron as well as additives or unintended by-products during preparation [1,2]. Total meat (hereinafter meat) can be divided into red meat (including beef, veal, and pork), processed meat (including cured and smoked meats; ham, bacon, sausage, hamburgers), and white meat (including chicken) [2]; their cardiometabolic health effect is still debatable. Most studies suggested that the consumption of red meat or processed meat should be related to an increased risk of cardiovascular diseases [3-6], type 2 diabetes [7,8], and metabolic syndrome [9,10]. However, a recent systematic review and meta-analysis including 17 prospective cohorts and 3 case-control studies showed that only processed meat, not red meat, was associated with higher risk of coronary heart disease or diabetes [11]. Since diet is a modifiable lifestyle factor,
research concern as well as public interest for its effect on subclinical diseases has continued to grow.
Carotid intima-media thickness (IMT), a non-invasive marker of early arterial wall alteration, is one of the methods to evaluate subclinical atherosclerosis and to predict cardiovascular disease risks [12-14]. Several studies investigated the relation between certain food(s) or nutrient(s) and carotid IMT [15-22], but to date, an association between meat consumption and subclinical atherosclerosis has not been well-established. We therefore examined the consumption of meat and red meat in relation to carotid IMT in Korean men and women.
MATERIALS AND METHODS
I. Subjects
This study is a part of a community-based prospective
Association Between Meat Consumption and Carotid
Intima-Media Thickness in Korean Adults With
Metabolic Syndrome
Sun Min Oh, Hyeon Chang Kim, Song Vogue Ahn, Hye Jin Chi, Il Suh Department of Preventive Medicine, Yonsei University College of Medicine
Objectives: The effect of meat consumption on cardiometabolic risk has been continuously studied, but their associations are not conclusive. The aim of this study is to examine the association between the consumption of meat or red meat and carotid intima-media thickness (IMT) in healthy Korean adults.
Methods: This study evaluated 2374 community-dwelling adults (933 men and 1441 women) who were free of cardiovas-cular disease or cancer, living in a rural area in Korea. Total meat and red meat intakes were assessed with a validated 103 item-food frequency questionnaire. Carotid IMT was evaluated ultrasonographically, IMTmax was defined as the highest value among IMT of bilateral common carotid arteries.
Results: After adjustment for potential confounding factors, the mean IMTmax tended to increase in higher meat consumption groups in both men and women with metabolic syndrome (p for trend= 0.027 and 0.049, respectively), but not in participants without metabolic syndrome. Frequent meat consumption (≥5 servings/week) was significantly associated with higher IMTmax in men with metabolic syndrome (by 0.08 mm, p=0.015). Whereas, the association was not significant in women (by 0.05 mm, p=0.115). Similar but attenuated findings were shown with red meat intake. Conclusions: Our findings suggest that a higher meat consumption may be associated with a higher carotid IMT in Korean adults with metabolic syndrome. The frequent meat consumption (≥5 servings/week), compared with the others, was associated with a higher carotid IMTmax only in men with metabolic syndrome. Further research is required to explore optimal meat consumption in people with specific medical conditions.
Key words: Meat, Metabolic syndrome, Atherosclerosis, Carotid arteries, Korea
cohort in Kangwha Island, South Korea. A total of 2971 residents aged 40-70 years were enrolled during 2006-2008. Among them, 597 subjects were excluded in the present study due to the following reasons: absence of carotid IMT measurement (315 subjects), implausible dietary consumption such as <500 or >3500 kcal/day in women and < 800 or > 4000 kcal/day in men (54 subjects) [23] or energy intake from fat < 3% (18 subjects), history of cardiovascular diseases such as myocardiac infarction, angina, stroke, and congestive heart failure (144 subjects) or cancers (55 subjects), lack of fasting blood sample (7 subjects), a missing waist circumference (1 subject), and systolic blood pressure (SBP) < 60 mmHg or diastolic blood pressure (DBP) <40 mmHg (3 subjects). Finally, 2374 subjects (933 men and 1441 women) were eligible for this study. All participants provided written informed consents and this study was approved by an Institutional Review Board.
II. Questionnaires
Trained interviewers obtained the information including medical and family history, health behavior, and diet with a standardized questionnaire. In case of self-administered questionnaires, interviewers checked and confirmed missing or irrelevant item(s), if any. Diet was assessed by over a 1-year period with a 103-item semi-quantitative food-frequency questionnaire (FFQ) developed for Korean adults [24]. The frequency of servings was classified into nine categories: never or seldom, once a month, 2-3 times / month, 1-2 times / week, 3-4 times / week, 5-6 times / week, once a day, twice a day, or 3 or more times/day.
III. Definition of Metabolic Syndrome
The metabolic syndrome, according to the guidelines from the National Cholesterol Education Program Adult Treatment Panel III adjusted for Asians, was defined as the presence of three or more of the following five criteria: waist circumference >90 cm in men and >80 cm in women; triglycerides ≥150 mg/dL or on drug treatment for elevated triglycerides; high-density lipoprotein (HDL)-cholesterol < 40 mg/dL in men and < 50 mg/dL in women or on drug treatment for reduced HDL-cholesterol; SBP ≥130 mmHg or DBP ≥85 mmHg or on hypertensive drug treatment in a patient with a history of hypertension; fasting glucose ≥100 mg/dl or on drug treatment for elevated glucose [25]. Anthropometric measurement was performed according to the predefined protocol. Waist circumference was
measured in a horizontal plane, midway between the inferior margin of the ribs and the superior border of the iliac crest using a tape measure (SECA-200, SECA, Hamburg, Germany). Resting blood pressure was measured twice with at least 5 minute intervals by an automatic sphygmomanometer (Dinamap 1846 SX/P; GE Healthcare, Waukesha, Wisconsin, USA). If the difference between the first and second measurements was more than 10 mmHg, a repeated measurement was done. The average of the last two measurements was used for analyses. Blood samples were collected from the antecubital vein after at least an 8-hour fast. Enzymatic methods were applied to measure fasting plasma glucose, triglycerides, total cholesterol, and HDL-cholesterol (ADVIA 1650, Siemens Healthcare Diagnostics Inc., Deerfield, Illinois, USA).
IV. Measurement of Carotid Intima-media
Thickness
Both right and left common carotid arteries were evaluated with high-resolution B-mode ultrasonography (SSAD-3500SV, Aloka, Tokyo, Japan) using a 7.5 MHz linear array transducer. During the evaluation, subjects were lying in the supine position and with their head turned 45°contralateral to the side of scanning. Frozen photocopies of the end-diastolic phase were taken when the inner echoes of both near and far walls were clearly visible. Carotid IMT was measured the perpendicular distance between the leading edge of the first and second echogenic lines at the far wall of the both common carotid arteries [26] using a relevant software (IntimaScope; MediaCross, Tokyo, Japan). As an outcome variable, IMTmax was defined as the highest value among IMT of the right and left common carotid arteries.
V. Statistical Analyses
In the present study, the meat consumption was considered as the frequency of meat consumption. Previous studies showed that most of the variance in food intake was explained by the frequency of use, and portion sizes were positively correlated with the frequency of use [23]. Biochemical, lifestyle, and dietary factors were shown according to the categorized frequency of meat consumption; < 1.0, 1.0-2.9, 3.0-4.9, and ≥5.0 servings/week. Differences in variables across the categorized groups were accessed with a trend test for continuous variables or chi-square test for categorical
variables. For all analyses, subjects were stratified into men and women because meat consumption was significantly higher in men compared with that in women. Further, previous research suggested that meat consumption was possibly associated with metabolic syndrome [9,10], we therefore stratified participants according to the presence of metabolic syndrome. The series of analysis of covariance (ANCOVA) were performed to calculate adjusted means and 95% confidence intervals of IMTmax across the categories of meat and red meat consumption and their linear trends. To investigate difference of the adjusted mean IMTmax in each meat consumption group, Tukey’s method for multiple comparisons was hired. To control potential confounders, we first adjusted for age and total energy intake. We then additionally adjusted for waist circumference, SBP, DBP, fasting plasma glucose (log transformed), triglycerides (log transformed), HDL-cholesterol, current drinking, current smoking (only for men), and menopause (only for women) in
multivariate-adjusted model. Intakes of fruits and green leafy vegetables (servings/week) were further adjusted due to their possible protective effect for subclinical atherosclerosis or cardiovascular disease [20,21]. To evaluate the risk of carotid atherosclerosis, multiple logistic regression analyses were performed. IMTmax, a dependent variable, was dichotomized using the top quartile as the cut-off point. Multiple confounders adjusted for the ANCOVA models were also applied for logistic regression models. A p value less than 5% was considered significant. All of the statistical analyses were performed with the SAS version 9.1.3 (SAS Institute, Cary, NC, USA).
RESULTS
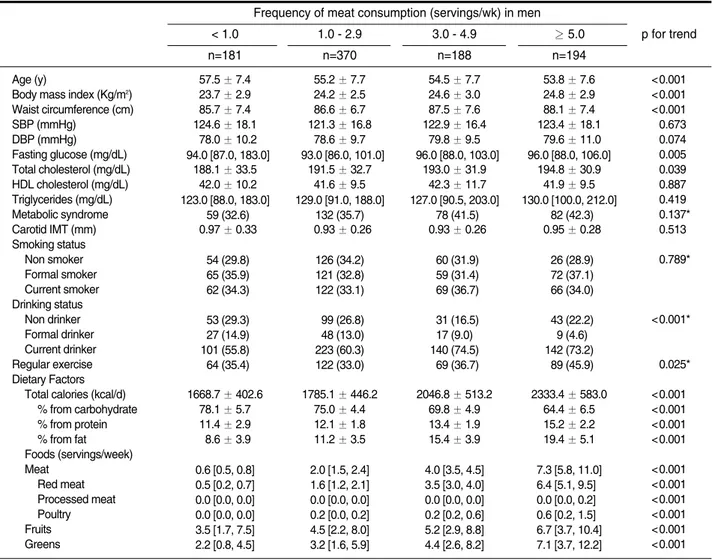
The characteristics of the study participants are summarized in Table 1 according to the frequency of meat consumption. Among the 933 men and 1441
Table 1. Characteristics of 933 men and 1441 women according to frequency of meat consumption
Frequency of meat consumption (servings/wk) in men < 1.0 n=181 1.0 - 2.9 n=370 3.0 - 4.9 n=188 ≥ 5.0 n=194 p for trend Age (y)
Body mass index (Kg/m2) Waist circumference (cm) SBP (mmHg) DBP (mmHg) Fasting glucose (mg/dL) Total cholesterol (mg/dL) HDL cholesterol (mg/dL) Triglycerides (mg/dL) Metabolic syndrome Carotid IMT (mm) Smoking status Non smoker Formal smoker Current smoker Drinking status Non drinker Formal drinker Current drinker Regular exercise Dietary Factors
Total calories (kcal/d) % from carbohydrate % from protein % from fat Foods (servings/week) Meat Red meat Processed meat Poultry Fruits Greens 0057.5 ± 7.400 0023.7 ± 2.900 0085.7 ± 7.400 0124.6 ± 18.10 0078.0 ± 10.20 094.0 [87.0, 183.0] 0188.1 ± 33.50 0042.0 ± 10.20 123.0 [88.0, 183.0] 059 (32.6) 000.97 ± 0.330 054 (29.8) 065 (35.9) 062 (34.3) 053 (29.3) 027 (14.9) 101 (55.8) 064 (35.4) 1668.7 ± 402.6 0078.1 ± 5.700 0011.4 ± 2.900 0008.6 ± 3.900 0.6 [0.5, 0.8] 0.5 [0.2, 0.7] 0.0 [0.0, 0.0] 0.0 [0.0, 0.0] 3.5 [1.7, 7.5] 2.2 [0.8, 4.5] 0055.2 ± 7.700 0024.2 ± 2.500 0086.6 ± 6.700 0121.3 ± 16.80 0078.6 ± 9.700 093.0 [86.0, 101.0] 0191.5 ± 32.70 0041.6 ± 9.500 129.0 [91.0, 188.0] 132 (35.7) 000.93 ± 0.260 126 (34.2) 121 (32.8) 122 (33.1) 099 (26.8) 048 (13.0) 223 (60.3) 122 (33.0) 1785.1 ± 446.2 0075.0 ± 4.400 0012.1 ± 1.800 0011.2 ± 3.500 2.0 [1.5, 2.4] 1.6 [1.2, 2.1] 0.0 [0.0, 0.0] 0.2 [0.0, 0.2] 4.5 [2.2, 8.0] 3.2 [1.6, 5.9] 0054.5 ± 7.700 0024.6 ± 3.000 0087.5 ± 7.600 0122.9 ± 16.40 0079.8 ± 9.500 096.0 [88.0, 103.0] 0193.0 ± 31.90 0042.3 ± 11.70 127.0 [90.5, 203.0] 078 (41.5) 000.93 ± 0.260 060 (31.9) 059 (31.4) 069 (36.7) 031 (16.5) 017 (9.0)0 140 (74.5) 069 (36.7) 2046.8 ± 513.2 0069.8 ± 4.900 0013.4 ± 1.900 0015.4 ± 3.900 4.0 [3.5, 4.5] 3.5 [3.0, 4.0] 0.0 [0.0, 0.0] 0.2 [0.2, 0.6] 5.2 [2.9, 8.8] 4.4 [2.6, 8.2] 0053.8 ± 7.600 0024.8 ± 2.900 0088.1 ± 7.400 0123.4 ± 18.10 0079.6 ± 11.00 096.0 [88.0, 106.0]0 0194.8 ± 30.90 0041.9 ± 9.500 130.0 [100.0, 212.0] 082 (42.3) 000.95 ± 0.280 026 (28.9) 072 (37.1) 066 (34.0) 043 (22.2) 009 (4.6)0 142 (73.2) 089 (45.9) 2333.4 ± 583.0 0064.4 ± 6.500 0015.2 ± 2.200 0019.4 ± 5.100 7.3 [5.8, 11.0] 6.4 [5.1, 9.5]0 0.0 [0.0, 0.2]0 0.6 [0.2, 1.5]0 6.7 [3.7, 10.4] 7.1 [3.7, 12.2] <0.001 <0.001 <0.001 <0.673 <0.074 <0.005 <0.039 <0.887 <0.419 <0.137* <0.513 <0.789* <0.001* <0.025* <0.001 <0.001 <0.001 <0.001 <0.001 <0.001 <0.001 <0.001 <0.001 <0.001
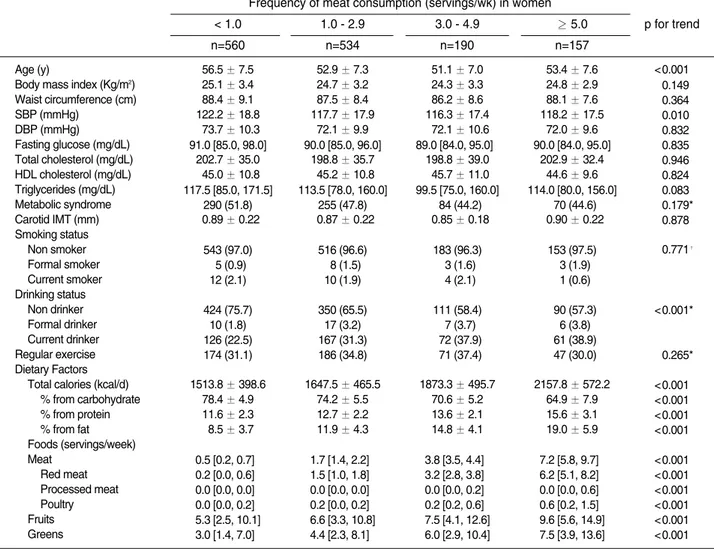
women, a higher consumption of meat was significantly related to younger age, a higher proportion of current drinker, a higher intake of total calories, calories from protein and fat, and intakes of fruits and green leafy vegetables. Men who consumed more meat tended to have a higher body mass index, waist circumference, fasting plasma glucose, and total cholesterol, and they also tended to do exercise regularly. In contrast, women with a high consumption of meat tended to have a lower SBP.
In this study population, the median consumption of meat was significantly different between participants with and without metabolic syndrome, but the absolute difference was small; the median meat consumption (servings/week) was 2.3 in men without metabolic syndrome, 2.6 in men with metabolic syndrome, 1.5 in women without metabolic syndrome, and 1.3 in women with metabolic syndrome. To explore a relation between
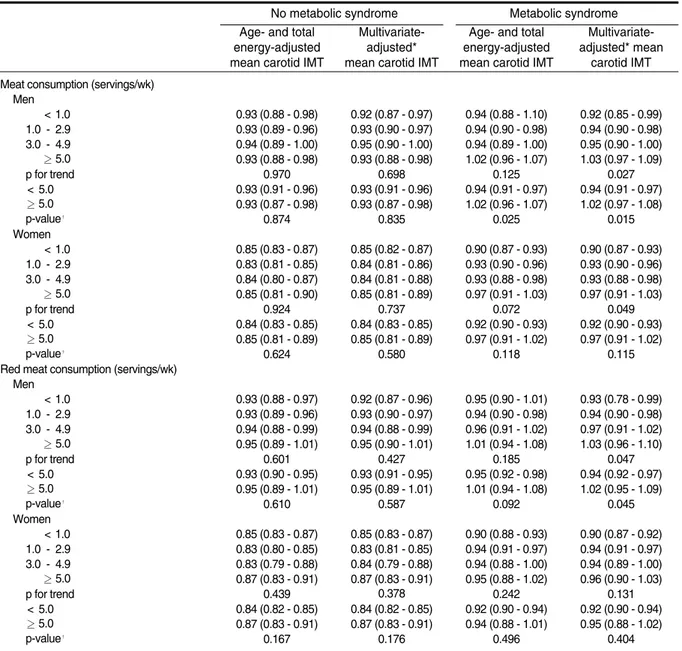
meat consumption and carotid atherosclerosis, a series of ANCOVA were performed separately in men and women with or without metabolic syndrome (Table 2). Among men and women with metabolic syndrome, after adjusted for age and total energy intake, the mean IMTmax in group with higher meat consumption tended to increase, but their trends were not statistically significant (p=0.125 in men and p=0.072 in women). In multivariate-adjusted models, the mean IMTmax tended to increase in higher meat consumption groups in both men and women (p for trend= 0.027 in men and 0.049 in women). However, the adjusted mean IMTmax in each group was not significantly different in both men and women. When the frequency of meat consumption was dichotomized (≥ 5 versus < 5 servings/week), in men with metabolic syndrome, the adjusted mean IMTmax in the frequent meat consumption group (≥ 5 servings/ week) was significantly higher than those in the others
Table 1. Continued
Frequency of meat consumption (servings/wk) in women < 1.0 n=560 1.0 - 2.9 n=534 3.0 - 4.9 n=190 ≥ 5.0 n=157 p for trend Age (y)
Body mass index (Kg/m2) Waist circumference (cm) SBP (mmHg) DBP (mmHg) Fasting glucose (mg/dL) Total cholesterol (mg/dL) HDL cholesterol (mg/dL) Triglycerides (mg/dL) Metabolic syndrome Carotid IMT (mm) Smoking status Non smoker Formal smoker Current smoker Drinking status Non drinker Formal drinker Current drinker Regular exercise Dietary Factors
Total calories (kcal/d) % from carbohydrate % from protein % from fat Foods (servings/week) Meat Red meat Processed meat Poultry Fruits Greens 0056.5 ± 7.500 0025.1 ± 3.400 0088.4 ± 9.100 0122.2 ± 18.80 0073.7 ± 10.30 091.0 [85.0, 98.0]0 0202.7 ± 35.00 0045.0 ± 10.80 117.5 [85.0, 171.5] 290 (51.8) 000.89 ± 0.220 543 (97.0) 005 (0.9)0 012 (2.1)0 424 (75.7) 010 (1.8)0 126 (22.5) 174 (31.1) 1513.8 ± 398.6 0078.4 ± 4.900 0011.6 ± 2.300 0008.5 ± 3.700 0.5 [0.2, 0.7]0 0.2 [0.0, 0.6]0 0.0 [0.0, 0.0]0 0.0 [0.0, 0.2]0 5.3 [2.5, 10.1] 3.0 [1.4, 7.0]0 0052.9 ± 7.300 0024.7 ± 3.200 0087.5 ± 8.400 0117.7 ± 17.90 0072.1 ± 9.900 090.0 [85.0, 96.0]0 0198.8 ± 35.70 0045.2 ± 10.80 113.5 [78.0, 160.0] 255 (47.8) 000.87 ± 0.220 516 (96.6) 008 (1.5)0 010 (1.9)0 350 (65.5) 017 (3.2)0 167 (31.3) 186 (34.8) 1647.5 ± 465.5 0074.2 ± 5.500 0012.7 ± 2.200 0011.9 ± 4.300 1.7 [1.4, 2.2]0 1.5 [1.0, 1.8]0 0.0 [0.0, 0.0]0 0.2 [0.0, 0.2]0 6.6 [3.3, 10.8] 4.4 [2.3, 8.1]0 0051.1 ± 7.000 0024.3 ± 3.300 0086.2 ± 8.600 0116.3 ± 17.40 0072.1 ± 10.60 89.0 [84.0, 95.0]0 0198.8 ± 39.00 0045.7 ± 11.00 99.5 [75.0, 160.0] 084 (44.2) 000.85 ± 0.180 183 (96.3) 003 (1.6)0 004 (2.1)0 111 (58.4) 007 (3.7)0 072 (37.9) 071 (37.4) 1873.3 ± 495.7 0070.6 ± 5.200 0013.6 ± 2.100 0014.8 ± 4.100 3.8 [3.5, 4.4]0 3.2 [2.8, 3.8]0 0.0 [0.0, 0.2]0 0.2 [0.2, 0.6]0 7.5 [4.1, 12.6] 6.0 [2.9, 10.4] 0053.4 ± 7.600 0024.8 ± 2.900 0088.1 ± 7.600 0118.2 ± 17.50 0072.0 ± 9.600 090.0 [84.0, 95.0]0 0202.9 ± 32.40 0044.6 ± 9.600 114.0 [80.0, 156.0] 070 (44.6) 000.90 ± 0.220 153 (97.5) 003 (1.9)0 001 (0.6)0 090 (57.3) 006 (3.8)0 061 (38.9) 047 (30.0) 2157.8 ± 572.2 0064.9 ± 7.900 0015.6 ± 3.100 0019.0 ± 5.900 7.2 [5.8, 9.7]0 6.2 [5.1, 8.2]0 0.0 [0.0, 0.6]0 0.6 [0.2, 1.5]0 9.6 [5.6, 14.9] 7.5 [3.9, 13.6] <0.001 <0.149 <0.364 <0.010 <0.832 <0.835 <0.946 <0.824 <0.083 <0.179* <0.878 <0.771† <0.001* <0.265* <0.001 <0.001 <0.001 <0.001 <0.001 <0.001 <0.001 <0.001 <0.001 <0.001 IMT: intima-media thickness, SBP: systolic blood pressure, DBP: diastolic blood pressure, HDL: high density lipoprotein.
Data are expressed as the mean ± standard deviation, median [inter-quartile range], or number (%). * Chi-square test, †Fisher’s exact test.
(< 5 servings / week); p = 0.025 in age- and total energy-adjusted model, 0.015 in multivariate-energy-adjusted model. However, in women with metabolic syndrome, the adjusted mean IMTmax in the frequent meat consumption group was not significantly different, compared with that in the others (p = 0.118 in age- and total energy-adjusted model, p = 0.115 in multivariate-adjusted model). Among participants without metabolic syndrome, no significant relation between meat consumption and IMTmax was observed in either men
or women. In men, interaction between frequent meat consumption (≥5 servings/week) and metabolic syndrome on IMTmax was significant in both models; p =0.047 in age- and total energy-adjusted model, p=0.030 for multivariate-adjusted model. In women, however, the corresponding interaction was not significant in either model; p=0.492 in age- and total energy-adjusted model, p=0.525 for multivariate-adjusted model (these data are not shown in table).
Similar but attenuated findings were shown with red
Table 2. Association between meat and red meat consumption and carotid intima-media thickness in 933 men
and 1441 women according to the presence of metabolic syndrome
No metabolic syndrome Metabolic syndrome
Age- and total energy-adjusted mean carotid IMT
Multivariate-adjusted* mean carotid IMT
Age- and total energy-adjusted mean carotid IMT
Multivariate-adjusted* mean
carotid IMT Meat consumption (servings/wk)
Men < 1.0 1.0 - 2.9 3.0 - 4.9 ≥ 5.0 p for trend < 5.0 ≥ 5.0 p-value† Women < 1.0 1.0 - 2.9 3.0 - 4.9 ≥ 5.0 p for trend < 5.0 ≥ 5.0 p-value†
Red meat consumption (servings/wk) Men < 1.0 1.0 - 2.9 3.0 - 4.9 ≥ 5.0 p for trend < 5.0 ≥ 5.0 p-value† Women < 1.0 1.0 - 2.9 3.0 - 4.9 ≥ 5.0 p for trend < 5.0 ≥ 5.0 p-value† 0.93 (0.88 - 0.98) 0.93 (0.89 - 0.96) 0.94 (0.89 - 1.00) 0.93 (0.88 - 0.98) 0.970 0.93 (0.91 - 0.96) 0.93 (0.87 - 0.98) 0.874 0.85 (0.83 - 0.87) 0.83 (0.81 - 0.85) 0.84 (0.80 - 0.87) 0.85 (0.81 - 0.90) 0.924 0.84 (0.83 - 0.85) 0.85 (0.81 - 0.89) 0.624 0.93 (0.88 - 0.97) 0.93 (0.89 - 0.96) 0.94 (0.88 - 0.99) 0.95 (0.89 - 1.01) 0.601 0.93 (0.90 - 0.95) 0.95 (0.89 - 1.01) 0.610 0.85 (0.83 - 0.87) 0.83 (0.80 - 0.85) 0.83 (0.79 - 0.88) 0.87 (0.83 - 0.91) 0.439 0.84 (0.82 - 0.85) 0.87 (0.83 - 0.91) 0.167 0.92 (0.87 - 0.97) 0.93 (0.90 - 0.97) 0.95 (0.90 - 1.00) 0.93 (0.88 - 0.98) 0.698 0.93 (0.91 - 0.96) 0.93 (0.87 - 0.98) 0.835 0.85 (0.82 - 0.87) 0.84 (0.81 - 0.86) 0.84 (0.81 - 0.88) 0.85 (0.81 - 0.89) 0.737 0.84 (0.83 - 0.85) 0.85 (0.81 - 0.89) 0.580 0.92 (0.87 - 0.96) 0.93 (0.90 - 0.97) 0.94 (0.88 - 0.99) 0.95 (0.90 - 1.01) 0.427 0.93 (0.91 - 0.95) 0.95 (0.89 - 1.01) 0.587 0.85 (0.83 - 0.87) 0.83 (0.81 - 0.85) 0.84 (0.79 - 0.88) 0.87 (0.83 - 0.91) 0.378 0.84 (0.82 - 0.85) 0.87 (0.83 - 0.91) 0.176 0.94 (0.88 - 1.10) 0.94 (0.90 - 0.98) 0.94 (0.89 - 1.00) 1.02 (0.96 - 1.07) 0.125 0.94 (0.91 - 0.97) 1.02 (0.96 - 1.07) 0.025 0.90 (0.87 - 0.93) 0.93 (0.90 - 0.96) 0.93 (0.88 - 0.98) 0.97 (0.91 - 1.03) 0.072 0.92 (0.90 - 0.93) 0.97 (0.91 - 1.02) 0.118 0.95 (0.90 - 1.01) 0.94 (0.90 - 0.98) 0.96 (0.91 - 1.02) 1.01 (0.94 - 1.08) 0.185 0.95 (0.92 - 0.98) 1.01 (0.94 - 1.08) 0.092 0.90 (0.88 - 0.93) 0.94 (0.91 - 0.97) 0.94 (0.88 - 1.00) 0.95 (0.88 - 1.02) 0.242 0.92 (0.90 - 0.94) 0.94 (0.88 - 1.01) 0.496 0.92 (0.85 - 0.99) 0.94 (0.90 - 0.98) 0.95 (0.90 - 1.00) 1.03 (0.97 - 1.09) 0.027 0.94 (0.91 - 0.97) 1.02 (0.97 - 1.08) 0.015 0.90 (0.87 - 0.93) 0.93 (0.90 - 0.96) 0.93 (0.88 - 0.98) 0.97 (0.91 - 1.03) 0.049 0.92 (0.90 - 0.93) 0.97 (0.91 - 1.02) 0.115 0.93 (0.78 - 0.99) 0.94 (0.90 - 0.98) 0.97 (0.91 - 1.02) 1.03 (0.96 - 1.10) 0.047 0.94 (0.92 - 0.97) 1.02 (0.95 - 1.09) 0.045 0.90 (0.87 - 0.92) 0.94 (0.91 - 0.97) 0.94 (0.89 - 1.00) 0.96 (0.90 - 1.03) 0.131 0.92 (0.90 - 0.94) 0.95 (0.88 - 1.02) 0.404 Data are expressed as the adjusted mean (95% confidence interval), IMT: intima-media thickness.
* Multivariate-adjusted: adjusted for age, total energy intake, waist circumference, systolic blood pressure, diastolic blood pressure, triglycerides (log transformed), high density lipoprotein cholesterol, fasting plasma glucose (log transformed), regular exercise, current drinker, current smoker (men), and menopause (women).
†p value: a statistical significance in difference of the adjusted mean carotid IMT between groups with meat or red consumption ≥5 servings/week compared with <5 servings/week.
meat consumption; the positive association between red meat consumption and the adjusted IMTmax was statistically significant in men with metabolic syndrome in multivariate-adjusted model (p for trend = 0.047), but not in age- and total energy-adjusted model (p for trend=0.185). In women, there was no significant association between red meat consumption and adjusted IMTmax. In men with metabolic syndrome, the adjusted mean IMTmax in the frequent meat consumption group (≥ 5 servings/week) was higher than that in the others, only in multivariate-adjusted model (p = 0.045). In men without metabolic syndrome and women, such finding was not shown.
To evaluate the risk of carotid atherosclerosis, the top
quartile of IMTmax in men (≥1.02 mm) and women (≥ 0.95 mm) were used as cut-off values for dichotomous outcome variables in logistic regression models (Table 3). In men with or without metabolic syndrome and women with metabolic syndrome, the trends of the risk of carotid atherosclerosis according to meat consumption were not significant in both age- and total energy-adjusted and multivariate-adjusted models. Meanwhile, in women without metabolic syndrome, significantly positive trends of the risk of carotid atherosclerosis according to meat consumption were shown in both models. However their risk of carotid atherosclerosis for the frequent meat consumption (≥ 5 servings/week) compared with the others (< 5 servings/
Table 3. Association between meat and red meat consumption and the risk of carotid atherosclerosis* in 933 men
and 1441 women according to the presence of metabolic syndrome
No metabolic syndrome Metabolic syndrome
Age- and total energy-adjusted
odds ratio
Multivariate-adjusted† odds ratio
Age- and total energy-adjusted
odds ratio
Multivariate-adjusted† odds ratio Meat consumption (servings/wk)
Men < 1.0 1.0 - 2.9 3.0 - 4.9 ≥ 5.0 p for trend < 5.0 ≥ 5.0 Women < 1.0 1.0 - 2.9 3.0 - 4.9 ≥ 5.0 p for trend < 5.0 ≥ 5.0
Red meat consumption (servings/wk) Men < 1.0 1.0 - 2.9 3.0 - 4.9 ≥ 5.0 p for trend < 5.0 ≥ 5.0 Women < 1.0 1.0 - 2.9 3.0 - 4.9 ≥ 5.0 p for trend < 5.0 ≥ 5.0 1.000 1.12 (0.66 - 1.91) 1.52 (0.79 - 2.92) 0.96 (0.47 - 1.95) 0.366 1.000 0.79 (0.44 - 1.40) 1.000 0.59 (0.37 - 0.95) 0.61 (0.31 - 1.21) 1.03 (0.55 - 1.94) 0.011 1.000 1.39 (0.77 - 2.49) 1.000 1.03 (0.62 - 1.69) 1.17 (0.61 - 2.22) 0.94 (0.45 - 1.93) 0.728 1.000 1.39 (0.77 - 2.49) 1.000 0.57 (0.36 - 0.92) 0.53 (0.23 - 1.19) 1.29 (0.68 - 2.45) 0.002 1.000 1.75 (0.96 - 3.20) 1.000 1.23 (0.71 - 2.15) 1.69 (0.86 - 3.32) 1.06 (0.51 - 2.21) 0.233 1.000 0.80 (0.45 - 1.44) 1.000 0.62 (0.39 - 1.01) 0.66 (0.33 - 1.32) 1.11 (0.58 - 2.14) 0.021 1.000 1.46 (0.80 - 2.66) 1.000 1.11 (0.66 - 1.86) 1.21 (0.62 - 2.37) 1.04 (0.50 - 2.18) 0.606 1.000 1.46 (0.80 - 2.66) 1.000 0.62 (0.38 - 1.00) 0.58 (0.25 - 1.32) 1.40 (0.72 - 2.71) 0.008 1.000 1.82 (0.98 - 3.39) 1.000 1.25 (0.60 - 2.61) 1.22 (0.54 - 2.79) 1.82 (0.77 - 4.34) 0.827 1.000 1.52 (0.82 - 2.82) 1.000 1.15 (0.79 - 1.67) 1.34 (1.76 - 2.35) 1.59 (0.86 - 2.96) 0.717 1.000 1.40 (0.79 - 2.49) 1.000 1.24 (0.64 - 2.44) 1.03 (0.47 - 2.28) 1.54 (0.63 - 3.76) 0.815 1.000 1.40 (0.79 - 2.49) 1.000 1.23 (0.85 - 1.79) 1.23 (0.69 - 2.20) 1.78 (0.88 - 3.61) 0.711 1.000 1.55 (0.80 - 3.03) 1.000 1.39 (0.64 - 3.04) 1.34 (0.55 - 3.25) 2.32 (0.90 - 5.96) 0.722 1.000 1.76 (0.90 - 3.45) 1.000 1.15 (0.78 - 1.68) 1.37 (0.77 - 2.43) 1.67 (0.88 - 3.17) 0.759 1.000 1.47 (0.82 - 2.64) 1.000 1.37 (0.67 - 2.80) 1.04 (0.44 - 2.43) 2.07 (0.78 - 5.45) 0.825 1.000 1.47 (0.82 - 2.64) 1.000 1.25 (0.86 - 0.83) 1.28 (0.71 - 2.32) 1.91 (0.93 - 3.95) 0.697 1.000 1.64 (0.83 - 3.23) Data are expressed as the adjusted odds ratio (95% confidence interval).
* The risk of carotid atherosclerosis was defined as the sex-specific top quartile of carotid intima-media thickness values.
†Multivariate-adjusted: adjusted for age, total energy intake, waist circumference, systolic blood pressure, diastolic blood pressure, triglycerides (log transformed), high density lipoprotein cholesterol, fasting plasma glucose (log transformed), regular exercise, current drinker, current smoker (men), and menopause (women).
week) did not significantly increase. There was no significant interaction between the frequent meat consumption and metabolic syndrome on the risk of carotid atherosclerosis either in men or in women.
In addition to the multivariate-adjusted models, we further controlled for intakes of fruits and greens. In this model, compared to results from the multivariate-adjusted models, the association between meat consumption and adjusted mean IMTmax was similar in men (p for trend = 0.024), but slightly attenuated in women (p for trend = 0.074) (data are available in Appendix). We performed similar analyses for soyfoods, fish, fruits, and greens to explore their relation to carotid IMT in this population, but we did not observe any significant association.
DISCUSSION
In the present study, among Korean men and women with metabolic syndrome, participants who consumed more meat or red meat tended to have a higher carotid IMT. However, the risk of carotid atherosclerosis, defined as the sex-specific top quartile of IMTmax, was not significantly increased in higher meat consumption groups regardless of metabolic syndrome. Processed meat and poultry consumption associated with carotid IMT could not be properly analyzed because consumption of those meats was too low in this study population; the median consumption of processed meat and poultry were 0.0 and 0.2 servings/week, respectively.
Although previous studies have investigated a health effect of meat or red meat consumption in relation to cardiovascular disease, type 2 diabetes, or metabolic syndrome, its health effects are still inconclusive [1,3-11]. Little evidence is available regarding the relation between meat consumption and subclinical atheros-clerosis. Only a few studies explored the association between dietary patterns or saturated fat and carotid IMT. A French cohort study with 1026 middle-aged participants suggested that a nutritionally poor dietary pattern with a high meat and alcohol and low micronutrient intake was related to increased arterial stiffness but not carotid IMT [27]. In a multi-center observational study in the US with 802 adults reported that a pro-inflammatory and pro-thrombotic dietary pattern characterized by higher intakes of low-fiber bread and cereal, red and processed meat, cottage cheese, tomato foods, regular soft drinks, and sweetened beverages and lower intakes of wine, rice and pasta,
meal replacements, and poultry increased the rate of coronary artery atherosclerosis progression [28]. As a result of a cross-sectional study with 620 multiethnic population in Canada, saturated fat and trans fat were associated with an increased IMT [16]. However, analyses of dietary pattern or nutrients could not provide evidence of independent effects of meat or other subtypes of meat consumption on carotid atheros-clerosis.
The reasons are unknown as to why meat consumption may be differently related to a higher carotid IMT according to the presence of metabolic syndrome. Negative health effects related to meat or red meat are possibly derived by animal protein, saturated fat, heme iron, or inflammatory mediators. In the past, studies to explore harmful effects of meat intake have focused on animal protein or saturated fat [29,30]. However, recent evidence does not support their significant cardiometabolic risk [1,31,32]. Meanwhile, heme iron from meat intake is regarded as a strong pro-oxidant [33]. High levels of circulating ferritin, a marker of body iron stores, are suggested to be a possible predictor of carotid atherosclerosis progression [34], cardiovascular disease [35], as well as metabolic syndrome [36]. In addition, many studies supported that systematic inflammatory mediators such as plasma C-reactive protein, plasminogen activator inhibitor-1, and homocysteine might play an important role in developing metabolic syndrome and atherosclerosis [5,37-39]. Considering that oxidative stress or systematic inflammation from meat intake is commonly related to metabolic syndrome and atherosclerosis, carotid atherosclerosis might more prominently progress due to meat consumption in a high risk group such as people with metabolic syndrome. Further research is required to explore a causal relationship between meat consumption and carotid atherosclerosis, especially in population with special medical conditions such as metabolic syndrome.
This study has several limitations to be discussed. First, due to the cross-sectional study design, a causality of the study result could not be established. Second, the participants of this study were a relatively healthy population who were free of cardiovascular disease or cancer. Thus, a variance of carotid IMT might not be large enough to disregard measurement error. We employed both IMTmax (the highest value among IMT from bilateral common carotid arteries) and IMTmean (the mean of the averaged IMT of right and left common carotid arteries). However, IMTmean was not significantly associated with meat consumption (data were not shown). Third, Kangwha Island is
character-ized as a small town with rural villages, so the diet in this area may not represent that in other areas in Korea. Forth, meat or red meat consumption was estimated by a validated FFQ, but measurement error especially from random within-person variation was possibly present [23]. Also, quantitative meat intake could not be additionally analyzed because of limited data availability. Last, although we used statistical methods to eliminate confounding factors of meat consumption in relation to carotid atherosclerosis, residual confounding beyond the considered confounders may alter the association.
In conclusion, we observed that a higher meat consumption was associated with a higher carotid IMT in Korean men and women with metabolic syndrome. The frequent meat consumption (≥5 servings / week), compared with the others, was associated with a higher carotid IMTmax only in men with metabolic syndrome. However, the frequent meat consumption was not significantly related to the increased risk of carotid atherosclerosis regardless of metabolic syndrome. Similar but attenuated findings were shown with red meat consumption. A causal relationship between meat consumption and cardiometabolic diseases including carotid atherosclerosis remains still unclear. Since diet is an important modifiable lifestyle risk factor of atherosclerotic cardiovascular disease, optimal meat consumption in people with specific medical conditions should be further investigated.
ACKNOWLEDGEMENTS
This study was supported by grants from the Korea Centers for Disease Control and Prevention (2006-E71011-00, 2008-E71004-00) and the Korean Health 21 R&D Project run by the Ministry of Health and Welfare of the Republic of Korea (A040152).
CONFLICT OF INTEREST
The authors have no conflicts of interest to declare on this study.
REFERENCES
1. McAfee AJ, McSorley EM, Cuskelly GJ, Moss BW, Wallace JM, Bonham MP, et al. Red meat consumption: an overview of the risks and benefits. Meat Sci 2010; 84(1):
1-13.
2. Linseisen J, Kesse E, Slimani N, Bueno-De-Mesquita HB, Ocké MC, Skeie G, et al. Meat consumption in the European Prospective Investigation into Cancer and Nutrition (EPIC) cohorts: results from 24-hour dietary recalls. Public Health Nutr 2002; 5(6B): 1243-1258. 3. Sinha R, Cross AJ, Graubard BI, Leitzmann MF, Schatzkin
A. Meat intake and mortality: a prospective study of over half a million people. Arch Intern Med 2009; 169(6): 562-571.
4. Kontogianni MD, Panagiotakos DB, Pitsavos C, Chrysohoou C, Stefanadis C. Relationship between meat intake and the development of acute coronary syndromes: the CARDIO2000 case-control study. Eur J Clin Nutr 2008; 62(2): 171-177.
5. Azadbakht L, Esmaillzadeh A. Red meat intake is associated with metabolic syndrome and the plasma C-reactive protein concentration in women. J Nutr 2009; 139(2): 335-339.
6. Steffen LM, Kroenke CH, Yu X, Pereira MA, Slattery ML, Van Horn L, et al. Associations of plant food, dairy product, and meat intakes with 15-y incidence of elevated blood pressure in young black and white adults: the Coronary Artery Risk Development in Young Adults (CARDIA) Study. Am J Clin Nutr 2005; 82(6): 1169-1177.
7. Aune D, Ursin G, Veierød MB. Meat consumption and the risk of type 2 diabetes: a systematic review and meta-analysis of cohort studies. Diabetologia 2009; 52(11): 2277-2287.
8. Fung TT, Schulze M, Manson JE, Willett WC, Hu FB. Dietary patterns, meat intake, and the risk of type 2 diabetes in women. Arch Intern Med 2004; 164(20): 2235-2240. 9. Baxter AJ, Coyne T, McClintock C. Dietary patterns and
metabolic syndrome--a review of epidemiologic evidence.
Asia Pac J Clin Nutr 2006; 15(2): 134-142.
10. Lutsey PL, Steffen LM, Stevens J. Dietary intake and the development of the metabolic syndrome: the Atherosclerosis Risk in Communities study. Circulation 2008; 117(6): 754-761.
11. Micha R, Wallace SK, Mozaffarian D. Red and processed meat consumption and risk of incident coronary heart disease, stroke, and diabetes mellitus: a systematic review and meta-analysis. Circulation 2010; 121(21): 2271-2283. 12. Lorenz MW, Markus HS, Bots ML, Rosvall M, Sitzer M.
Prediction of clinical cardiovascular events with carotid intima-media thickness: a systematic review and meta-analysis. Circulation 2007; 115(4): 459-467.
13. Simon A, Gariepy J, Chironi G, Megnien JL, Levenson J. Intima-media thickness: a new tool for diagnosis and treatment of cardiovascular risk. J Hypertens 2002; 20(2): 159-169.
14. Poredos P. Intima-media thickness: indicator of cardiovascular risk and measure of the extent of atherosclerosis. Vasc Med 2004; 9(1): 46-54.
S. Consumption of fruit and berries is inversely associated with carotid atherosclerosis in elderly men. Br J Nutr 2008; 99(3): 674-681.
16. Merchant AT, Kelemen LE, de Koning L, Lonn E, Vuksan V, Jacobs R, et al. Interrelation of saturated fat, trans fat, alcohol intake, and subclinical atherosclerosis. Am J Clin
Nutr 2008; 87(1): 168-174.
17. Zhang B, Chen YM, Huang LL, Zhou XX, Chen CG, Ye YB, et al. Greater habitual soyfood consumption is associated with decreased carotid intima-media thickness and better plasma lipids in Chinese middle-aged adults.
Atherosclerosis 2008; 198(2): 403-411.
18. Buil-Cosiales P, Irimia P, Ros E, Riverol M, Gilabert R, Martinez-Vila E, et al. Dietary fibre intake is inversely associated with carotid intima-media thickness: a cross-sectional assessment in the PREDIMED study. Eur J Clin
Nutr 2009; 63(10): 1213-1219.
19. Mellen PB, Liese AD, Tooze JA, Vitolins MZ, Wagenknecht LE, Herrington DM. Whole-grain intake and carotid artery atherosclerosis in a multiethnic cohort: the Insulin Resistance Atherosclerosis Study. Am J Clin Nutr 2007; 85(6): 1495-1502.
20. Hu FB. Diet and lifestyle influences on risk of coronary heart disease. Curr Atheroscler Rep 2009; 11(4): 257-263. 21. Dauchet LP, Amouyel P, Dallongeville J; Medscape.
Fruits, vegetables and coronary heart disease. Nat Rev
Cardiol 2009; 6(9): 599-608.
22. Buil-Cosiales P, Irimia P, Berrade N, Garcia-Arellano A, Riverol M, Murie-Fernández M, et al. Carotid intima-media thickness is inversely associated with olive oil consumption. Atherosclerosis 2008; 196(2): 742-748. 23. Willett WC. Nutritional Epidemiology, 2nd ed. New York:
Oxford University Press; 1998. p. 322
24. Ahn Y, Kwon E, Shim JE, Park MK, Joo Y, Kimm K, et al. Validation and reproducibility of food frequency questionnaire for Korean genome epidemiologic study.
Eur J Clin Nutr 2007; 61(12): 1435-1441.
25. Grundy SM, Cleeman JI, Daniels SR, Donato KA, Eckel RH, Franklin BA, et al. American Heart Association; National Heart, Lung, and Blood Institute. Diagnosis and management of the metabolic syndrome: an American Heart Association/National Heart, Lung, and Blood Institute Scientific Statement. Circulation 2005; 112(17): 2735-2752.
26. Pignoli P, Tremoli E, Poli A, Oreste P, Paoletti R. Intimal plus medial thickness of the arterial wall: a direct measurement with ultrasound imaging. Circulation 1986; 74(6): 1399-1406.
27. Kesse-Guyot E, Vergnaud AC, Fezeu L, Zureik M, Blacher J, Péneau S, Hercberg S, et al. Associations
between dietary patterns and arterial stiffness, carotid artery intima-media thickness and atherosclerosis. Eur J
Cardiovasc Prev Rehabil 2010: in press.
28. Liese AD, Nichols M, Hodo D, Mellen PB, Schulz M, Goff DC, et al. Food intake patterns associated with carotid artery atherosclerosis in the Insulin Resistance Atherosclerosis Study. Br J Nutr 2010; 103(10): 1471-1479.
29. Hu FB, Stampfer MJ, Manson JE, Ascherio A, Colditz GA, Speizer FE, et al. Dietary saturated fats and their food sources in relation to the risk of coronary heart disease in women. Am J Clin Nutr 1999; 70(6): 1001-1008.
30. McGee DL, Reed DM, Yano K, Kagan A, Tilotson J. Ten-year incidence of coronary heart disease in the Honolulu Heart Program. Relationship to nutrient intake. Am J
Epidemiol 1984; 119(5): 667-676.
31. Hu FB, Stampfer MJ, Manson JE, Rimm E, Colditz GA, Speizer FE, et al. Dietary protein and risk of ischemic heart disease in women. Am J Clin Nutr 1999; 70(2): 221-227. 32. Preis SR, Stampfer MJ, Spiegelman D, Willett WC, Rimm
EB. Lack of association between dietary protein intake and risk of stroke among middle-aged men. Am J Clin Nutr 2010; 91(1): 39-45.
33. Rajpathak SN, Crandall JP, Wylie-Rosett J, Kabat GC, Rohan TE, Hu FB. The role of iron in type 2 diabetes in humans. Biochim Biophys Acta 2009; 1790(7): 671-681. 34. Kiechl S, Willeit J, Egger G, Poewe W, Oberhollenzer F.
Body iron stores and the risk of carotid atherosclerosis: prospective results from the Bruneck study. Circulation 1997; 96(10): 3300-3307.
35. Sullivan JL. Iron in arterial plaque: modifiable risk factor for atherosclerosis. Biochim Biophys Acta 2009; 1790(7): 718-723.
36. Vari IS, Balkau B, Kettaneh A, André P, Tichet J, Fumeron F, et al. Ferritin and transferrin are associated with metabolic syndrome abnormalities and their change over time in a general population: Data from an Epidemiological Study on the Insulin Resistance Syndrome (DESIR). Diabetes Care 2007; 30(7): 1795-1801.
37. Theuma P, Fonseca VA. Inflammation and emerging risk factors in diabetes mellitus and atherosclerosis. Curr Diab
Rep 2003; 3(3): 248-254.
38. Haffner SM. The metabolic syndrome: inflammation, diabetes mellitus, and cardiovascular disease. Am J cardiol 2006; 97(2A): 3A-11A.
39. Esmaillzadeh A, Kimiagar M, Mehrabi Y, Azadbakht L, Hu FB, Willett WC. Dietary patterns and markers of systemic inflammation among Iranian women. J Nutr 2007; 137(4): 992-998.
Appendix. Association between meat and red meat consumption and carotid intima-media thickness and the risk
of carotid atherosclerosis* in 933 men and 1441 women according to the presence of metabolic syndrome in further adjusted models†
No metabolic syndrome Metabolic syndrome
Further-adjusted mean carotid IMT
Further-adjusted odds ratio
Further-adjusted mean carotid IMT
Further-adjusted odds ratio Meat consumption (servings/week)
Men < 1.0 1.0 - 2.9 3.0 - 4.9 ≥ 5.0 p for trend < 5.0 ≥ 5.0 p value‡ Women < 1.0 1.0 - 2.9 3.0 - 4.9 ≥ 5.0 p for trend < 5.0 ≥ 5.0 p value‡
Red meat consumption (servings/week) Men < 1.0 1.0 - 2.9 3.0 - 4.9 ≥ 5.0 p for trend < 5.0 ≥ 5.0 p value‡ Women < 1.0 1.0 - 2.9 3.0 - 4.9 ≥ 5.0 p for trend < 5.0 ≥ 5.0 p value‡ 0.93 (0.87 - 0.98) 0.93 (0.90 - 0.97) 0.95 (0.90 - 1.00) 0.93 (0.87 - 0.98) 0.869 0.94 (0.91 - 0.96) 0.92 (0.87 - 0.98) 0.714 0.85 (0.82 - 0.88) 0.83 (0.81 - 0.86) 0.84 (0.81 - 0.88) 0.83 (0.79 - 0.87) 0.732 0.84 (0.83 - 0.85) 0.83 (0.79 - 0.87) 0.810 0.92 (0.87 - 0.97) 0.93 (0.90 - 1.00) 0.94 (0.88 - 0.99) 0.95 (0.89 - 1.01) 0.521 0.93 (0.91 - 0.96) 0.95 (0.88 - 1.01) 0.659 0.85 (0.83 - 0.87) 0.83 (0.81 - 0.85) 0.84 (0.80 - 0.88) 0.85 (0.80 - 0.90) 0.962 0.84 (0.83 - 0.85) 0.85 (0.80 - 0.89) 0.739 1.00 1.20 (0.69 - 2.12) 1.71 (0.85 - 3.44) 1.00 (0.47 - 2.14) 0.239 1.00 0.75 (0.41 - 1.38) 1.00 0.66 (0.41 - 1.07) 0.69 (0.34 - 1.40) 1.05 (0.52 - 2.10) 0.052 1.00 1.34 (0.71 - 2.55) 1.00 1.09 (0.64 - 1.86) 1.24 (0.62 - 2.46) 0.94 (0.43 - 2.02) 0.542 1.00 1.34 (0.71 - 2.55) 1.00 0.65 (0.40 - 1.07) 0.62 (0.27 - 1.43) 1.28 (0.63 - 2.58) 0.025 1.00 1.63 (0.84 - 3.15) 0.92 (0.85 - 1.00) 0.93 (0.90 - 0.98) 0.95 (0.89 - 1.00) 1.03 (0.97 - 1.09) 0.024 0.94 (0.91 - 0.97) 1.03 (0.97 - 1.09) 0.011 0.90 (0.87 - 0.93) 0.93 (0.90 - 0.96) 0.93 (0.88 - 0.98) 0.97 (0.90 - 1.03) 0.074 0.92 (0.90 - 0.94) 0.96 (0.90 - 1.02) 0.172 0.93 (0.87 - 0.99) 0.93 (0.89 - 0.97) 0.97 (0.91 - 1.02) 1.03 (0.96 - 1.11) 0.038 0.94 (0.91 - 0.97) 1.03 (0.96 - 1.10) 0.037 0.90 (0.87 - 0.92) 0.94 (0.91 - 0.97) 0.94 (0.89 - 1.00) 0.95 (0.88 - 1.02) 0.196 0.92 (0.90 - 0.94) 0.94 (0.87 - 1.02) 0.522 1.00 1.33 (0.61 - 2.92) 1.19 (0.48 - 2.91) 2.24 (0.86 - 5.82) 0.858 1.00 1.82 (0.91 - 3.66) 1.00 1.15 (0.78 - 1.70) 1.38 (0.77 - 2.48) 1.60 (0.83 - 3.06) 0.690 1.00 1.39 (0.76 - 2.54) 1.00 1.30 (0.63 - 2.67) 0.98 (0.42 - 2.31) 2.01 (0.74 - 5.42) 0.953 1.00 1.39 (0.76 - 2.54) 1.00 1.31 (0.89 - 1.93) 1.38 (0.75 - 2.52) 1.90 (0.90 - 3.99) 0.490 1.00 1.57 (0.78 - 3.15) Data are expressed as the adjusted mean (95% confidence interval) or as the adjusted odds ratio (95% confidence interval).
* The risk of carotid atherosclerosis was defined as the sex-specific top quartile of carotid intima-media thickness values.
†Further-adjusted: adjusted for age, total energy intake, waist circumference, systolic blood pressure, diastolic blood pressure, triglycerides (log transformed), high density lipoprotein cholesterol, fasting plasma glucose (log transformed), regular exercise, current drinker, current smoker (men), menopause (women), and frequency of fruits and green leafy vegetables consumption.
‡p value: a statistical significance in difference of the adjusted mean carotid IMT between groups with meat or red meat consumption ≥5 servings/week compared with < 5 servings/week.