Research Article
Identification of the Anisotropic Elastic Parameters of NiCrAlY
Coating by Combining Nanoindentation and Finite
Element Method
Jingyu Zhai ,
1,2Yugang Chen ,
3Xinyuan Song,
1Hongchun Wu ,
4and Qingkai Han
11School of Mechanical Engineering, Dalian University of Technology, Dalian 116024, China
2Collaborative Innovation Center of Major Machine Manufacturing in Liaoning, Dalian 116024, China
3Department of Mechanical Engineering, Korea Advanced Institute of Science and Technology, Daejeon 34141, Republic of Korea 4School of Mechanical Engineering and Automation, Northeastern University, Shenyang 110819, China
Correspondence should be addressed to Jingyu Zhai; [email protected]
Received 17 December 2018; Revised 25 April 2019; Accepted 9 May 2019; Published 2 June 2019 Academic Editor: Davood Younesian
Copyright © 2019 Jingyu Zhai et al. This is an open access article distributed under the Creative Commons Attribution License, which permits unrestricted use, distribution, and reproduction in any medium, provided the original work is properly cited. For vibration damping, coatings are prepared on surface of the structures (substrates), which constitute the coating-substrate composite structures. Elastic parameters of the coating are indispensable for the vibration and damping analysis of the composite structure. Due to the small scale of coating thickness and elastic difference compared with the substrate, the identification results are inevitably influenced by the existence of substrate. Moreover, resulting from the preparation process, elastic properties of hard coating often exhibit anisotropic properties. All the above factors bring about the difficulties of accurate identification. In this study, a method for identifying anisotropic elastic parameters of hard coatings considering substrate effect is proposed, by combining nanoindentation and finite element analysis. Based on the identification results, finite element models are established to analyze the vibration characteristics of the coating-substrate composite structure, which verify the rationality of the anisotropic elastic parameters for vibration analysis. The studies in this paper are significant to more accurately identify the mechanical parameters for establishing the dynamic model. Moreover, they lay the foundation for further optimization design of hard coating damping.
1. Introduction
In recent years, hard coatings applied as functional coatings on thin plate have shown significant damping effects [1, 2] and are being widely studied as a new type of passive damping method. In the hard coating damping system, the elastic modulus of the hard coating directly affects the stiffness and the damping effect of the coating structure. Therefore, it is significant to accurately measure the elastic modulus of the hard coating for the modeling and vibration absorption designing of the coating-substrate composite structures [3, 4]. The testing methods for mechanical properties of ma-terials mainly include the stretching method [5], ultrasonic method [6], indentation method [7], vibration method [8], and special equipment such as thermomechanical dynamics analyzer measurement [9]. Hard coatings are brittle and
generally coated on a substrate, which renders it difficult to be made into a single piece for testing. Therefore, when testing the mechanical properties of hard coatings, it is usually performed on composite structures composed of coatings and substrates [10]. For the small size and elastic difference of the hard coating compared with the substrate, the identification results are inevitably influenced by the existence of the substrate, which is called the substrate effect. The existence of the substrate effect makes these traditional measuring methods unable to accurately reflect the me-chanical parameters of the coating.
In addition, due to the test methods and sample size limits, hard coatings are often reduced to isotropic linear materials when testing their mechanical properties. For example, the American Society for Testing and Materials (ASTM) gave a standard test method [11] for the mechanical properties of
Volume 2019, Article ID 9034750, 13 pages https://doi.org/10.1155/2019/9034750
coating materials, and the premise of the test is to assume that the properties of the coating are isotropic and linear. Several recent studies [12–15] on the mechanical properties of hard coatings have also equated coatings with isotropic materials. However, the microstructure feature of the hard coating resulting from the special preparation process (such as the layered structure prepared by air plasma spraying [16] and the columnar structure prepared by physical vapor deposition [17]) makes the elastic modulus of the hard coating show a significant difference in horizontal and vertical directions in the coating surface [16–22]. Because the vibration response of the coating-substrate composite structure contains complex modes such as bending and torsion, the anisotropy of the elastic modulus will affect the vibration characteristics [23]; the isotropic elastic modulus is difficult to accurately predict the mechanical behavior of the coating-substrate composite structure in vibration and the damping effect. In order to accurately predict the vibration characteristics of the coating-substrate composite structures and to evaluate the damping effect, it is necessary to develop a method being capable of accurately identifying the anisotropic elastic modulus of the coating under consideration of the substrate effect.
The nanoindentation is a technique for evaluating the mechanical properties of materials by loading the indenter on the surface of the materials, in which the indentation depth and loading force can be controlled and be recorded simultaneously [24]. Compared with the traditional in-dentation method, the depth of the nanoinin-dentation is small enough to nanoscale, and the displacement resolution achieves 1 nm, which is suitable for testing mechanical properties of coating materials [25]. In the nanoindentation system, the degree of elastic deformation and plastic de-formation of the material is expressed in the load-displacement curve. The elastic deformation can measure the stiffness and elastic modulus of the material, and the plastic deformation can measure the hardness of the ma-terial. For the isotropic bulk materials, Oliver and Pharr [26] proposed a method based on the maximum loading force and the slope of the unloading curve to identify the elastic modulus and hardness of the material, which laid the foundation for the nanoindentation test. However, the data obtained from nanoindentation experiments cannot directly reflect the anisotropic mechanical parameters of the sample piece. Even though some recent studies have proposed methods to extract anisotropic mechanical parameters by nanoindentation [27] or other equipment [6], there are still limitations in use and inevitable effects of substrate.
In this study, the anisotropic mechanical parameters of NiCrAlY hard coating that considered substrate effect was studied. Based on the nanoindentation test, finite element method (FEM), and analytical method, an identification method for anisotropic elastic properties of the hard coating considering the substrate effect was established. Finally, the identified parameters are imputed to the finite element model to analyze the vibration characteristics of the hard coating-substrate composite structure. The finite element results were compared with the test results to prove the reasonability of the method proposed in this paper.
2. Description of Anisotropic Material Model
and Coating Indentation
2.1. Anisotropic Material Model of Hard Coating. For the
general anisotropic elastic body, in the case of small deformation, the expression of the elastic coefficient matrix is c � c11 c12 c13 c14 c15 c16 c21 c22 c23 c24 c25 c26 c31 c32 c33 c34 c35 c36 c41 c42 c43 c44 c45 c46 c51 c52 c53 c54 c55 c56 c61 c62 c63 c64 c65 c66 ⎡ ⎢ ⎢ ⎢ ⎢ ⎢ ⎢ ⎢ ⎢ ⎢ ⎢ ⎢ ⎢ ⎢ ⎢ ⎢ ⎢ ⎢ ⎢ ⎢ ⎢ ⎢ ⎢ ⎢ ⎢ ⎢ ⎢ ⎢ ⎢ ⎢ ⎢ ⎢ ⎢ ⎢ ⎢ ⎢ ⎢ ⎢ ⎢ ⎢ ⎢ ⎢ ⎢ ⎢ ⎢ ⎢ ⎢ ⎢ ⎢ ⎢ ⎢ ⎢ ⎢ ⎢ ⎢ ⎢ ⎢ ⎢ ⎢ ⎢ ⎢ ⎣ ⎤⎥⎥⎥⎥⎥⎥⎥⎥⎥ ⎥⎥⎥⎥⎥⎥⎥⎥ ⎥⎥⎥⎥⎥⎥⎥⎥ ⎥⎥⎥⎥⎥⎥⎥⎥ ⎥⎥⎥⎥⎥⎥⎥⎥ ⎥⎥⎥⎥⎥⎥⎥⎥ ⎥⎥⎥⎥⎥⎥⎥⎥ ⎥⎥⎥⎦ , (1)
where cmnare called elastic constants and are a total of 36.
For extremely anisotropic materials, it proves that cmn�cnm;
thus, there are only 21 independent elastic constants. If the elastic body has three elastic planes of symmetry, it is called an orthotropic elastic body where the elastic co-efficient matrix can be reduced to
c � c11 c12 c13 0 0 0 c22 c23 0 0 0 c33 0 0 0 c44 0 0 symm c55 0 c66 ⎡ ⎢ ⎢ ⎢ ⎢ ⎢ ⎢ ⎢ ⎢ ⎢ ⎢ ⎢ ⎢ ⎢ ⎢ ⎢ ⎢ ⎢ ⎢ ⎢ ⎢ ⎢ ⎢ ⎢ ⎢ ⎢ ⎢ ⎢ ⎢ ⎢ ⎢ ⎢ ⎢ ⎢ ⎢ ⎢ ⎢ ⎢ ⎢ ⎢ ⎢ ⎢ ⎢ ⎢ ⎢ ⎢ ⎢ ⎢ ⎢ ⎢ ⎢ ⎢ ⎢ ⎢ ⎢ ⎢ ⎣ ⎤⎥⎥⎥⎥⎥⎥⎥⎥⎥ ⎥⎥⎥⎥⎥⎥⎥⎥ ⎥⎥⎥⎥⎥⎥⎥⎥ ⎥⎥⎥⎥⎥⎥⎥⎥ ⎥⎥⎥⎥⎥⎥⎥⎥ ⎥⎥⎥⎥⎥⎥⎥⎥ ⎥⎥⎥⎥⎥⎥⎦ . (2)
There are only 9 independent elastic constants of the orthotropic elastic body. When the coordinate axis di-rections are consistent with the main didi-rections of elas-ticity, the normal stress is only related to the normal strain and the shear stress is only related to the shear strain. Therefore, there is no coupling between the tension and shear, nor the shear stress and shear strain in different planes.
Based on the orthotropy, if the elasticity is symmetric about an axis that is normal to a plane of isotropy and within this plane, the elasticity is the same in all directions; this material is known as a transversely isotropic material.
The x1-x2plane is taken as the isotropic plane. When
in-volving the x1 or x2 directions, the subscript of elastic
coefficients can be indiscriminate, that is, c11�c22, c13�c23,
c44�c55, and c66� (1/2)c11− c12. In this way, there are only
five independent elastic constants, and the elasticity matrix is c � c11 c12 c13 0 0 0 c11 c13 0 0 0 c33 0 0 0 c44 0 0 symm c44 0 1 2 c11− c12 ⎡ ⎢ ⎢ ⎢ ⎢ ⎢ ⎢ ⎢ ⎢ ⎢ ⎢ ⎢ ⎢ ⎢ ⎢ ⎢ ⎢ ⎢ ⎢ ⎢ ⎢ ⎢ ⎢ ⎢ ⎢ ⎢ ⎢ ⎢ ⎢ ⎢ ⎢ ⎢ ⎢ ⎢ ⎢ ⎢ ⎢ ⎢ ⎢ ⎢ ⎢ ⎢ ⎢ ⎢ ⎢ ⎢ ⎢ ⎢ ⎢ ⎢ ⎢ ⎢ ⎢ ⎢ ⎢ ⎢ ⎢ ⎢ ⎢ ⎢ ⎢ ⎢ ⎢ ⎢ ⎢ ⎢ ⎢ ⎢ ⎢ ⎢ ⎣ ⎤⎥⎥⎥⎥⎥⎥⎥⎥ ⎥⎥⎥⎥⎥⎥⎥⎥ ⎥⎥⎥⎥⎥⎥⎥⎥ ⎥⎥⎥⎥⎥⎥⎥⎥ ⎥⎥⎥⎥⎥⎥⎥⎥ ⎥⎥⎥⎥⎥⎥⎥⎥ ⎥⎥⎥⎥⎥⎥⎥⎥ ⎥⎥⎥⎥⎥⎥⎥⎥ ⎥⎥⎥⎥⎥⎦ . (3)
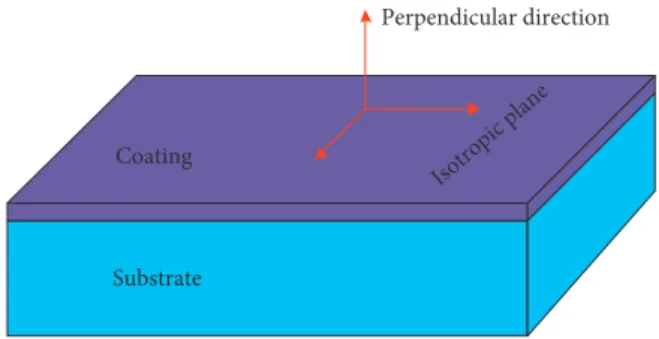
Due to the microstructure depending on the prepa-ration technology, the anisotropy of the hard coating is often expressed as transversely isotropic, and the me-chanical properties are the same in the plane parallel to the substrate (as shown in Figure 1); the mechanical properties in the direction vertical to the surface of the substrate are quite different from those in the isotropic plane [19–22].
In engineering, the elasticity matrix is often expressed as S � 1 ET −vT ET −vLT EL 0 0 0 −vT ET 1 ET −vLT EL 0 0 0 −vTL ET −vTL ET 1 EL 0 0 0 0 0 0 1 GT 0 0 0 0 0 0 1 GL 0 0 0 0 0 0 1 GL ⎡ ⎢ ⎢ ⎢ ⎢ ⎢ ⎢ ⎢ ⎢ ⎢ ⎢ ⎢ ⎢ ⎢ ⎢ ⎢ ⎢ ⎢ ⎢ ⎢ ⎢ ⎢ ⎢ ⎢ ⎢ ⎢ ⎢ ⎢ ⎢ ⎢ ⎢ ⎢ ⎢ ⎢ ⎢ ⎢ ⎢ ⎢ ⎢ ⎢ ⎢ ⎢ ⎢ ⎢ ⎢ ⎢ ⎢ ⎢ ⎢ ⎢ ⎢ ⎢ ⎢ ⎢ ⎢ ⎢ ⎢ ⎢ ⎢ ⎢ ⎢ ⎢ ⎢ ⎢ ⎢ ⎢ ⎢ ⎢ ⎢ ⎢ ⎢ ⎢ ⎢ ⎢ ⎢ ⎢ ⎢ ⎢ ⎢ ⎢ ⎢ ⎢ ⎢ ⎢ ⎢ ⎢ ⎢ ⎢ ⎢ ⎢ ⎢ ⎢ ⎢ ⎢ ⎢ ⎢ ⎢ ⎢ ⎢ ⎢ ⎢ ⎢ ⎢ ⎢ ⎢ ⎢ ⎢ ⎢ ⎢ ⎢ ⎢ ⎢ ⎢ ⎢ ⎢ ⎢ ⎢ ⎢ ⎢ ⎢ ⎢ ⎢ ⎢ ⎢ ⎢ ⎢ ⎢ ⎢ ⎢ ⎢ ⎢ ⎢ ⎢ ⎣ ⎤⎥⎥⎥⎥⎥⎥⎥⎥⎥ ⎥⎥⎥⎥⎥⎥⎥⎥ ⎥⎥⎥⎥⎥⎥⎥⎥ ⎥⎥⎥⎥⎥⎥⎥⎥ ⎥⎥⎥⎥⎥⎥⎥⎥ ⎥⎥⎥⎥⎥⎥⎥⎥ ⎥⎥⎥⎥⎥⎥⎥⎥ ⎥⎥⎥⎥⎥⎥⎥⎥ ⎥⎥⎥⎥⎥⎥⎥⎥ ⎥⎥⎥⎥⎥⎥⎥⎥ ⎥⎥⎥⎥⎥⎥⎥⎥ ⎥⎥⎥⎥⎥⎥⎥⎥ ⎥⎥⎥⎥⎥⎥⎥⎥ ⎥⎥⎥⎥⎥⎥⎥⎥ ⎥⎥⎥⎥⎥⎥⎥⎥ ⎥⎥⎥⎥⎥⎥⎥⎥ ⎥⎥⎥⎦ , (4)
where the subscript “L” indicates longitudinal and the subscript “T” indicates transverse, as shown in Figure 2.
Poisson’s ratios vLT and vTLshow the following relation:
vTL ET �
vLT
EL. (5)
The shear modulus in the transverse plane can be expressed as
GT � ET
2 1 + vT
. (6)
Since Poisson’s ratio has less influence on the calculation
results, we suppose vT�0.3 which is Poisson’s ratio in the
transverse plane, and the other two Poisson’s ratios have the following constraints [28]:
vTL+ vLT�2vT. (7)
According to [29], the longitudinal shear modulus can be approximated to
GL� ET+ EL/2
2 1 + v TL+ vLT/2
. (8)
Only ETand EL are needed to solve. According to the
study of Vlassak et al. [30, 31], the indentation modulus of anisotropic materials is a weighted average of the modulus of elasticity in each direction. The indentation modulus can be expressed as
Em�αET+βEL, (9)
where α and β are weight coefficients and α + β � 1. In previous study, it was generally considered that α � β � 1/2 [29].
2.2. Substrate Effect in Indentation of Thin Coating and Di-mensionless Analysis. During the indentation process of the
bulk material, when the rigid conical indenter is pressed into the bulk material, the relationship between the loading force and the indentation depth can be expressed as [32]
F � Cth2, (10)
where F is the loading force, h is the indentation depth, and
Ct is the scaling factor, which is related to the elastic
me-chanical parameters of the base material.
The coating-substrate composite structure is composed of two materials with different mechanical properties. When the indenter is pressed into the composite structure, the state of stress and strain in the coating near the indenter will be affected by the substrate. Figure 2 shows the stress distri-bution near the indenter and interface at different in-dentation depths through the finite element simulation. When the indentation depth exceeds a certain range, the strain produced by the indentation has extended to the substrate. As the depth of indentation increases, the curve gained by the indentation test actually contains the prop-erties of both the coating and the substrate, which is called the substrate effect.
Due to the substrate effect, during the loading process of the indentation for the coating-substrate composite struc-ture, the relationship between the loading force and the depth of indentation is different from the quadratic re-lationship for the bulk material. The exponential function can be used to amend the formula [32]
F � Fmax h hm
x
, (11)
where the index of the load curve x quantitatively reflects the effect of the substrate on the stress state of the coating during the indentation loading, that is, the extent of the substrate effect.
The two important parameters from the indentation curve, the maximum loading force and the index of the load curve, are related to the elastic mechanical parameters and the geometrical parameters of the coating-substrate com-posite structure. The maximum loading force can be expressed by the functional relation of the elastic mechanical parameters with the geometric parameters of the composite structure, which is
Coating
Substrate
Isotropic plane
Perpendicular direction
Fmax�ϕ ET, EL, ES, hc, hm, (12)
where ETand ELare the transverse and longitudinal elastic
modulus of the coating, respectively, and ES is the elastic
modulus of the substrate. hcand hmare the coating thickness
and the maximum depth of the indentation.
Consistent with the maximum loading force, the index of the load curve x can also be expressed as the following functional relation:
x �φ ET, EL, ES, hc, hm. (13)
The elastic modulus and maximum depth of the in-dentation of the base material are selected as the funda-mental quantity. Π theorem is applied to nondimensionalize equations (12) and (13), and the following equations can be obtained: Fmax ESh2m�ϕ ET ES, EL ES, hc hm , x �φ ET ES, EL ES, hc hm . (14)
In the numerical simulation of this study, fixed maxi-mum depth of the indentation (equal to that in the in-dentation test) is taken, and equations (12) and (13) can be expressed as Fmax ESh2m�ϕ ET ES, EL ES , (15) x �φ ET ES, EL ES . (16)
From the above equations, as long as the maximum
loading force Fmaxand the index of the loading curve x at a
fixed indentation depth are obtained and then combined
with numerical analysis for back analysis, ETand ELof the
anisotropic coating can be obtained by solving the equations.
3. Simulation of the Nanoindentation by FEM
The finite element model of the indenter and coating-substrate composite structure was established by ABA-QUS to simulate the nanoindentation process, which was used to obtain the expression of the dimensionless equation. The indenter used in the nanoindentation test was a Berkovich indenter, which could be replaced by a conical
indenter with a half-cone angle of 70.3°in the finite element
model [33]. The material of Berkovich indenter is diamond with a modulus of elasticity of 1140 GPa, which is of a very high magnitude to the pressed test piece. So, the Berkovich indenter can be equivalent to a rigid body and set to An-alytical Rigid in ABAQUS. The process of which the conical indenter presses into the test piece has typical axisymmetric
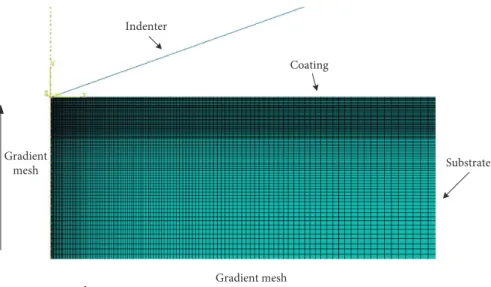
feature, so an axisymmetric two-dimensional model can be used to simulate the loading process of nanoindentation. In order to ensure the sufficient computational accuracy and save the computational time, a gradient mesh is used to divide the body according to Saint-Venant’s principle. For the coating, a dense mesh is used near the indenter, and a sparse mesh is used in the area far from the indenter; for the substrate, the dense mesh is used near the vertical region of the indenter and near the interface, and others use the sparse mesh (as shown in Figure 3). A downward displacement load is applied to the reference point on the indenter to simulate the process of pressing the indenter into the coating-substrate composite structure. The load-displacement curve of the finite element simulation can be drawn by extracting the displacement of the indenter and the reaction force acting on the indenter for each load step.
According to the adaptability requirements of the in-verse analysis, when fitting a dimensionless equation, choosing a suitable material parameter range can improve the accuracy of the fitting result. The coating studied in this paper is metal-based composite coatings, and the substrate is metal. Since the elastic modulus of them is generally in a
range of tens to hundreds GPa, we set ET/ESand EL/ESfrom
0.3 to 1.5 which basically covers the range of modulus of the
metal-based composite coating. First, we fixed ET/ESas 0.3
and selected EL/ESas 0.3, 0.5, 0.7, 1, 1.2 and 1.5, respectively
and calculated the loading curve of the indentation for each
ET/ES. Then, we changed the ET/ESto 0.5, 0.7, 1, 1.2, and 1.5
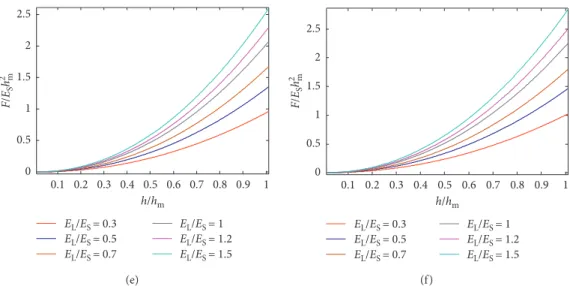
and repeated the above process. Figure 4 shows the di-mensionless load-displacement curves obtained from the
simulations of different ET/ESand EL/ES. The dimensionless
maximum loading force Fmax/Esh2m and index of loading
curve x under different situations were extracted from Figure 4 for the further analysis, which are represented in Sections 3.1 and 3.2, respectively.
3.1. Maximum Loading Force. A three-dimensional diagram
of the relationship between Fmax/ESh2m, EL/ES, and ET/ESis
shown in Figure 5. When ET/ESis fixed, Fmax/ESh2mand EL/
ESshow a nonlinear relationship. The dimensionless
max-imum loading force Fmax/ESh2mis increased with the increase
of EL/ES. It can be seen that the dimensionless maximum
loading force Fmax/ESh
2
mis more sensitive to EL/ES.
According to the curves in Figure 5, the relationship
between Fmax/ESh2mand EL/ES can be fitted to a quadratic
curve. Figure 6 shows the quadratic fit curve for ET/ES�1.5.
As can be seen from the figure, the quadratic fit curve
de-scribes the relationship between Fmax/ESh
2
m and EL/ES
ac-curately. Thus, equation (15) can be expressed as
Fmax ESh2m� A EL ES 2 + B EL ES + C. (17)
Obviously, A, B, and C are related to ET/ES.
Corresponding to different values of ET/ES, 6 groups of
A, B, and C are calculated, which are shown as the data
points in Figure 7.
According to the relationship between A, B, and C, the
parameters A, B, and C against ET/EScan be fitted as
A � a1 ET ES 2 + a2 ET ES + a3, B � a4 ET ES 2 + a5 ET ES + a6, C � a7 ET ES 3 + a8 ET ES 2 + a9 ET ES + a10. (18)
Let ET/ES�u and EL/ES� v. The dimensionless
maxi-mum loading force can be expressed as
Fmax ESh2m�� a1u 2+ a 2u + a3 v2+ a 4u2+ a5u + a6v + a7u3+ a8u2+ a9u + a10, (19)
where the coefficients are shown in Table 1.
3.2. Index of Loading Curve. The indexes of each loading
curve in Figure 4 are fitted, and a three-dimensional diagram
of the relationship between x, EL/ES, and ET/ESis shown in
Figure 8.
Figure 8 shows that the index x is increased as EL/ES
increases and is decreased as ET/ESincreases. Similar to the
fitting procedure of Fmax/ESh2m�φ(u, v), the fitting
ex-pression of B is
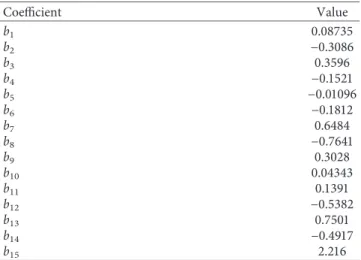
x � b 1u4+ b2u3+ b3u2+ b4u + b5v2
+ b 6u4+ b7u3+ b8u2+ b9u + b10v + b11u4+ b12u3
+ b13u2+ b14u + b15,
(20)
where the coefficients are shown in Table 2.
4. Nanoindentation Testing and Elastic
Parameters Determination
4.1. Nanoindentation Testing. The matrix adopts 304
stainless-steel beam, and its material parameters are density
8 × 10³kg/m3, elastic modulus E � 193 GPa, and Poisson’s
ratio v � 0.3. The surface of steel beam is polished to ensure a good surface quality and conductivity. The geometrical size of the stainless-steel beam is 60 × 10 × 1.8 mm. The coating target is Ni75Cr19Al4Y powder. Using the FMA 90/80 magnetic-filtered cathodic arc ion coating machine in Northeastern University, the as-prepared coating thickness is 20 μm by using the electron beam physical vapor de-position (EB-PVD) technique. Figure 9 shows the stainless-steel beam before and after applying NiCrAlY.
The surface state of the coating, especially the surface roughness of the coating, has a noticeable effect on the accuracy of nanoindentation measurement. According to the requirement of nanoindentation test, the surface roughness of the coating surface should meet the conditions
of Ra≤ h/20 (h is indentation depth) to ensure that the
0.1 0.2 0.3 0.4 0.5 0.6 0.7 0.8 0.9 1 0 0.2 0.4 0.6 0.8 1 1.2 1.4 F/ ES h 2 m h/hm EL/ES = 0.3 EL/ES = 0.5 EL/ES = 0.7 EL/ES = 1 EL/ES = 1.2 EL/ES = 1.5 (a) F/ ES h 2 m h/hm EL/ES = 0.3 EL/ES = 0.5 EL/ES = 0.7 EL/ES = 1 EL/ES = 1.2 EL/ES = 1.5 0.1 0.2 0.3 0.4 0.5 0.6 0.7 0.8 0.9 1 0 0.2 0.4 0.6 0.8 1 1.2 1.4 1.6 (b) 0.1 0.2 0.3 0.4 0.5 0.6 0.7 0.8 0.9 1 0 0.2 0.4 0.6 0.8 1 1.2 1.4 1.6 1.8 2 F/ ES h 2 m h/hm EL/ES = 0.3 EL/ES = 0.5 EL/ES = 0.7 EL/ES = 1 EL/ES = 1.2 EL/ES = 1.5 (c) 0.1 0.2 0.3 0.4 0.5 0.6 0.7 0.8 0.9 1 0 0.5 1 1.5 2 F/ ES h 2 m h/hm EL/ES = 0.3 EL/ES = 0.5 EL/ES = 0.7 EL/ES = 1 EL/ES = 1.2 EL/ES = 1.5 (d) Figure 4: Continued. Gradient mesh Gradient mesh Indenter Coating Substrate
Nanoindentation experiments were performed by the Swiss CSM Nanoscratch Tester. Its main technical param-eters are as follows: load range 0–500 mn, load resolution
40 nN, maximum pressure depth 200 μm, and displacement resolution 0.004 nm. The testing process consists of three phases: loading phase, load-holding phase (eliminating the effect of creep in unloading process), and unloading phase. The maximum loading force of indenter is 20 mN, the loading and unloading speeds are 10 mN/min, and the pause time is 10 s.
The nanoindentation method is very sensitive to the microstructure of the coating material, and the measured results can only reflect the local mechanical properties of the coating. Randomly select 5 points on the specimen for testing and continuously record the change of loading force and indenter displacement. According to the continuous displacement and load recorded during the indentation experiment, the load-displacement curves of 5 measuring points are plotted as shown in Figure 10.
From the load-displacement curve, under the same maximum loading force, the maximum depth of indentation is relatively discrete, and the indentation modulus is quite different. The reason is that the nanoindentation test is a method which depends on the local phase of the coating. Even for the same material coating, due to the subtle dif-ferences of the process of spraying, it is difficult to have a similar surface roughness, so the indentation test results have a strong discreteness. Three close results are chosen as
valid values for averaging, and the average Fmax�20.2 mN
and average hm�256.3 nm. The loading phase of the
aver-aged load-displacement curve is fitted to get that x � 2.076. According to Oliver and Pharr’s research [26], the elastic modulus of the pressed test piece can be solved by the following equation: 1 Em� 1 − v2 E + 1 − v2i Ei , (21)
where Emis the indentation modulus (also called simplified
Young’s modulus); E and v are Young’s modulus and
Poisson’s ratio of the test piece, respectively; and Eiand viare
0.2 0.4 0.6 0.8 1 1.2 1.4 0 0.5 1 1.5 0.5 1 1.5 2 2.5 3 0.6 0.8 1 1.2 1.4 1.6 1.8 2 2.2 2.4 2.6 Fmax /ES h 2 m ET/ES E L/ES
Figure 5: The three-dimensional diagram of the relationship be-tween Fmax/ESh2m, EL/ES, and ET/ES.
0 0.2 0.4 0.6 0.8 1 1.2 1.4 1.6 1.8 0 0.5 1 1.5 2 2.5 3 Original data Quadratic fit curve
EL/ES
Fmax
/ES
h
2 m
Figure 6: Quadratic curve fitting of Fmax/ESh2mand EL/ES.
0.1 0.2 0.3 0.4 0.5 0.6 0.7 0.8 0.9 1 0 0.5 1 1.5 2 2.5 F/ ES h 2 m h/hm EL/ES = 0.3 EL/ES = 0.5 EL/ES = 0.7 EL/ES = 1 EL/ES = 1.2 EL/ES = 1.5 (e) 0.1 0.2 0.3 0.4 0.5 0.6 0.7 0.8 0.9 1 0 0.5 1 1.5 2 2.5 F/ ES h 2 m h/hm EL/ES = 0.3 EL/ES = 0.5 EL/ES = 0.7 EL/ES = 1 EL/ES = 1.2 EL/ES = 1.5 (f )
Figure 4: Loading versus depth curves of different ET/ES and EL/ES. (a) EL/ES�0.3. (b) EL/ES�0.5. (c) EL/ES�0.7. (d) EL/ES�1.
Young’s modulus and Poisson’s ratio of the indenter,
re-spectively. For adamantine indenter, Ei�1141 GPa and
vi�0.07.
The indentation modulus Emin equation (21) is
calcu-lated by the following equation for load-displacement curve [34]: S �dP dh� 2 �� π √ Em√��A, (22)
where S � dP/dh is the slope of the upper part of the ex-perimental unloading curve of nanoindentation, that is, the
stiffness value measured; Emis the indentation modulus; and
A is the area of the elastic contact between the indenter and
the test piece.
When the geometrical shape of the indenter is known, the contact area is a function of the indentation contact depth. For an ideal Berkovich indenter, the contact area A can be given by the following equation:
A �24.56h2co, (23) 0.2 0.4 0.6 0.8 1 1.2 1.4 1.6 –0.5 –0.45 –0.4 –0.35 –0.3 –0.25 –0.2 –0.15
Quadratic fit curve The value of A
ET/ES
(a)
Quadratic fit curve The value of B 0.2 0.4 0.6 0.8 1 1.2 1.4 1.6 1 1.5 2 2.5 ET/ES (b)
Quadratic fit curve The value of C 0.2 0.4 0.6 0.8 1 1.2 1.4 1.6 0.3 0.32 0.34 0.36 0.38 0.28 ET/ES (c)
Figure 7: Data fitting of A, B, and C. (a) The coefficient A. (b) The coefficient B. (c) The coefficient C.
Table 1: The coefficients in equation (19).
Coefficient Value a1 0.1665 a2 −0.5912 a3 −0.0826 a4 −0.5017 a5 1.947 a6 0.5461 a7 0.1183 a8 −0.3821 a9 0.4326 a10 0.1969
where hcois the contact indentation depth, and the value can be obtained by using the following equation:
hco� hm− εFm
S , (24)
where ε is a parameter related to the shape of the indenter; for Berkovich indenter in this experiment, ε � 0.76. After
calculating, the indentation modulus Em� (S/2)
����
π/A
√ � 157.19 GPa.
4.2. Elastic Parameters Determination. The maximum
loading force Fmax, load curve index x, and indentation
modulus Em extracted from the curve of indentation
ob-tained from the nanoindentation experiment are solved by substituting into the dimensionless equations (23) and (24). The identification of coating material parameters be-longs to the inverse analysis; the inverse analysis usually has the feature of nonlinearity, heavy calculation burden, and ill-posed problem, and the solution of coating material pa-rameters is particularly strong in dependence on input data. In order to ensure the suitability of the obtained material
parameter results, Em�(ET+ EL)/2 will be used as the
constraint equation while calculating.
Because of the inconvenience of solving dimensionless equation directly, we defined an objective function to find the optimal solution. Define the objective function as
e � 1 − ϕ(u, v) Fmax/ESh2m + 1 − φ(u, v) x . (25)
Looking for u, v which makes the value of the objective function e the smallest can obtain the desired solution.
Substituting (u + v)/2 � Em/ES into equation (25) to reduce
the equation to single variable u, we can get the objective function e vs u curve, as shown in Figure 11. The curve shows that when u � 0.69, the objective function e has a minimum value. Therefore, the identification results of NiCrAlY
transverse isotropic mechanical parameters are
ET�133.17 GPa and EL�181.21 GPa, and then according to
the equations (5)–(8), GT�51.22 GPa, GL�60.45 GPa,
vTL�0.254, and vLT�0.346 are obtained.
Table 2: The coefficients in equation (20).
Coefficient Value b1 0.08735 b2 −0.3086 b3 0.3596 b4 −0.1521 b5 −0.01096 b6 −0.1812 b7 0.6484 b8 −0.7641 b9 0.3028 b10 0.04343 b11 0.1391 b12 −0.5382 b13 0.7501 b14 −0.4917 b15 2.216
Figure 9: The bare and coated stainless-steel beam.
0 150 300 450 600 0 5 10 15 20 25 Loading force (Nm) Depth of indentation (nm) Valid values
Figure 10: The experimental load versus depth curves of coated beam. ET/ES EL/ES 0 0.5 1 1.5 0.2 0.4 0.6 0.8 1 1.2 1.4 1.6 2.05 2.1 2.15 2.2 2.08 2.09 2.1 2.11 2.12 2.13 2.14 2.15 2.16 2.17 2.18 x
Figure 8: The three-dimensional diagram of the relationship be-tween x, EL/ES, and ET/ES.
5. Vibration Experiment for Validation of the
Anisotropic Elastic Parameters
5.1. Parameters of Composite Structure. Taking the titanium
alloy cantilever plate as substrate (Figure 12(a)), the EB-PVD method is used to apply NiCrAlY coating on one side of its surface (Figure 12(b)). Vibration characteristics of titanium alloy cantilever plate with NiCrAlY coating were studied. The material of the plate is Ti-6Al-4V, and the elastic modulus is 113.8 GPa, Poisson’s ratio is 0.3, and the density
is 4200 kg m−3[35]. The length, width, and thickness of the
plate are 122 mm, 110 mm, and 1.5 mm, separately. The thickness of the coating is 15 μm. From the mass change of the titanium alloy plate before and after the coating weighted by using the pallet balance and the volume of the coating which is the product of thickness, length, and width of the coating, the density of the NiCrAlY coating can be obtained
as 2840.7 kg·m−3. Natural frequencies of the coating-plate
composite structure are measured by sweeping frequency on the vibrating table [36].
5.2. Modeling of the Plate with Coating. The titanium Alloy
plate adopts Solid-95 unit which is suitable for block structure, and the hard coating adopts shell-181 unit which is suitable for thin shell structure, as shown in Fig-ure 13. The input parameters of NiCrAlY coating material in
ANSYS are EX�EY�133.17 GPa, EZ�181.21 GPa, GXZ�
GYZ� 51.22 GPa, GXY�60.45 GPa, vXY�0.346, and vXZ�
vYZ�0.254.
The coating prepared by EB-PVD is tightly bonded to the substrate. The bond is in good condition with no obvious interfacial layer, and there is an interfused phenomenon between the coating and the substrate interface. Therefore, this study does not take the interface between the coating and the substrate into consideration, that is, assuming that the displacement and stress between the coating and the substrate interface are continuous. The coating is bonded to the substrate by merging mesh nodes on relevant surfaces in ANSYS.
The degree of freedom in all directions of the bottom plate is restrained to simulate the cantilever condition. The finite element model eventually established of the
coating-plate composite structure is shown in Figure 13. According to the finite element model, the block Lanczos method is used in ANSYS to analyze the first 10 natural frequencies and modal modes of the coating-plate composite structure. For comparison, the equivalent model of isotropic materials with E � 165.76 GPa measured by the nanoindentation ex-periment is calculated.
5.3. Comparison of the Natural Frequencies. In order to
compare the results of the dynamic test with calculated results of coating-plate composite structure to verify the correctness of the material parameters, we should first confirm that the calculated and tested results of the titanium alloy plate are correct. Table 3 shows the first 8-order natural frequencies obtained from the finite element and test of titanium alloy plate without coatings. From Table 3, except the 7th order, the difference between the finite element and experimental test results is less than 2%, indicating that both the experimental test and the finite element calculation results are correct and credible.
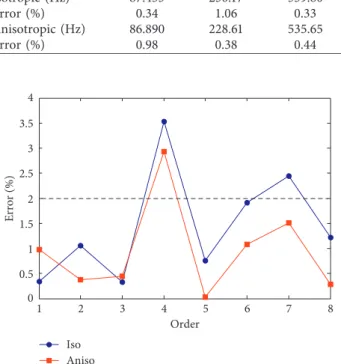
Table 4 shows the first 8 natural frequencies of the coated plate and the errors/difference ratios between the experi-mental test results and finite element results calculated by
0 0.5 1 1.5 0.2 0.4 0.6 0.8 1 u e 0.69
Figure 11: Search for the optimal solution.
(a) (b)
Figure 12: Titanium alloy thin plate and coated plate. (a) Titanium alloy thin plate. (b) Coated plate with NiCrAlY.
Titanium alloy plate Coating Boundary
conditions of cantilever
Figure 13: Finite element model of cantilever coating-plate composite structure.
both isotropic parameters and anisotropic parameters. For a better comparison, the differences are plotted in Figure 14. Figure 14 shows that both the errors of the results calculated by isotropic and anisotropic parameters are below 2%. Moreover, the natural frequency results calculated by using anisotropic material parameters are close to the results obtained by the experimental test in higher-order parts (4∼8 orders).
6. Conclusion
In this paper, we proposed a method to identify the an-isotropic elastic parameters of NiCrAlY coating. Based on the anisotropic elastic constitutive relation, the constitutive model of NiCrAlY coating was simplified to be described by
two independent mechanical constants ETand EL. The
ex-pression of the dimensionless equation of indentation pa-rameters and elastic properties of the coating was obtained by finite element simulations. According to the results obtained from the nanoindentation test, the process of solving the elastic parameters of the coating was transformed into the form of finding the optimal solution of the objective
function. Then, mechanical properties ET and EL of the
coating were obtained.
According to the elastic parameters, the finite element model of the coating-substrate composite structure was established by ANSYS and natural characteristics of the cantilever titanium plate coated with NiCrAlY coating were analyzed. The comparative result shows that the results calculated by anisotropic elastic parameters are more close to the experimental results, especially in higher modes. The method proposed in this paper can also be used for other coating materials. It has important research significance for vibration reduction analysis and active design of hard coating.
Data Availability
The test data used to support the findings of this study are available from the corresponding author upon request.
Conflicts of Interest
The authors declare that they have no conflicts of interest.
Acknowledgments
This work was supported by the National Natural Science Foundation of China (grant nos. 51505060 and 11472068) and the Aeronautical Science Foundation of China (20152163007).
References
[1] C. Blackwell, A. Palazotto, T. J. George, and C. J. Cross, “The evaluation of the damping characteristics of a hard coating on titanium,” Shock and Vibration, vol. 14, article 260183, no. 1, 51 pages, 2007.
[2] H. Li, W. Sun, M. Zhu, and P. Xue, “Experimental study on the influence on vibration characteristics of thin cylindrical shell with hard coating under cantilever boundary condition,”
Shock and Vibration, vol. 2017, Article ID 1751870, 23 pages,
2017.
[3] Y. Chen, J. Zhai, and Q. Han, “Vibration and damping analysis of the bladed disk with damping hard coating on blades,” Aerospace Science and Technology, vol. 58, pp. 248– 257, 2016.
Table 3: Natural frequencies of the bare plate.
Mode order 1 2 3 4 5 6 7 8
Experiment (Hz) 85.75 227.88 538.25 776 811.63 1443.75 1494.25 1765.25
FEM (Hz) 85.708 225.48 528.36 789.13 802.74 1459 1528.2 1753.2
Error (%) 0.049 1.053 1.837 1.692 1.095 1.056 2.272 0.683
Table 4: Natural frequencies of the coated plate using isotropic and anisotropic parameters.
Mode order 1 2 3 4 5 6 7 8 Experiment (Hz) 87.75 227.75 538 777.25 814 1463.25 1526 1772.25 Isotropic (Hz) 87.453 230.17 539.80 804.69 820.16 1491.2 1563.4 1793.9 Error (%) 0.34 1.06 0.33 3.53 0.76 1.91 2.45 1.22 Anisotropic (Hz) 86.890 228.61 535.65 800.02 813.80 1479.0 1549.1 1777.2 Error (%) 0.98 0.38 0.44 2.93 0.025 1.08 1.51 0.28 1 2 3 4 5 6 7 8 0 0.5 1 1.5 2 2.5 3 3.5 4 Error (%) Order Iso Aniso
Figure 14: The errors of the natural frequencies calculated by isotropic and anisotropic parameters.
[4] W. Sun, Z. Wang, M. Zhu, and G. Du, “Identifying the mechanical parameters of hard coating with strain dependent characteristic by an inverse method,” Shock and Vibration, vol. 2015, Article ID 487457, 15 pages, 2015.
[5] K. Topolski, T. Brynk, and H. Garbacz, “Elastic modulus of nanocrystalline titanium evaluated by cyclic tensile method,”
Archives of Civil and Mechanical Engineering, vol. 16, no. 4,
pp. 927–934, 2016.
[6] Q. Wei, J. Zhu, and W. Chen, “Anisotropic mechanical properties of plasma-sprayed thermal barrier coatings at high temperature determined by ultrasonic method,” Journal of
Thermal Spray Technology, vol. 25, no. 3, pp. 605–612, 2016.
[7] S. Rezaei, M. Arghavani, S. Wulfinghoff et al., “A novel ap-proach for the prediction of deformation and fracture in hard coatings: comparison of numerical modeling and nano-indentation tests,” Mechanics of Materials, vol. 117, pp. 192– 201, 2018.
[8] N. Li, M. Ben Tahar, Z. Aboura, and K. Khellil, “A dynamic analysis approach for identifying the elastic properties of unstitched and stitched composite plates,” Composite
Struc-tures, vol. 152, pp. 959–968, 2016.
[9] A. Ershad-Langroudi, H. Abdollahi, and A. Rahimi, “Me-chanical properties of sol–gel prepared nanocomposite coatings in the presence of titania and alumina-derived nanoparticles,” Plastics, Rubber and Composites, vol. 46, no. 1, pp. 25–34, 2016.
[10] Y. Zhang, W. Sun, J. Yang, and Q. Han, “Analytical analysis of forced vibration of the hard-coating cylindrical shell with material nonlinearity and elastic constraint,” Composite
Structures, vol. 187, pp. 281–293, 2018.
[11] U. States, Standard Test Method for Determination of
Refer-ence Temperature, To, for Ferritic Steels in the Transition Range1, ASTM International, West Conshohocken, PA, USA, 2011.
[12] F. L. Shang, X. Zhang, X. C. Guo, P. F. Zhao, and Y. Chang, “Determination of high temperature mechanical properties of thermal barrier coatings by nanoindentation,” Surface
Engi-neering, vol. 30, no. 4, pp. 283–289, 2014.
[13] H. Do, V.-T. Dai, J. S. Tian, T.-C. Yen, and L. Chang, “Structural and nanoindentation studies of epitaxial titanium oxynitride (001) films grown on MgO(001) substrate,” Surface
and Coatings Technology, vol. 251, pp. 1–6, 2014.
[14] Z. T. Wu, Z. B. Qi, D. F. Zhang, and Z. C. Wang, “Nano-indentation induced plastic deformation in nanocrystalline ZrN coating,” Materials Letters, vol. 164, pp. 120–123, 2016. [15] W. Tillmann, B. Klusemann, J. Nebel, and B. Svendsen, “Analysis of the mechanical properties of an arc-sprayed WC-FeCSiMn coating: nanoindentation and simulation,” Journal
of Thermal Spray Technology, vol. 20, no. 1-2, pp. 328–335,
2011.
[16] Y. Tan, A. Shyam, W. B. Choi, E. Lara-Curzio, and S. Sampath, “Anisotropic elastic properties of thermal spray coatings determined via resonant ultrasound spectroscopy,” Acta
Materialia, vol. 58, no. 16, pp. 5305–5315, 2010.
[17] D. Zhou, O. Guillon, and R. Vaßen, “Development of YSZ thermal barrier coatings using axial suspension plasma spraying,” Coatings, vol. 7, no. 8, p. 120, 2017.
[18] F. Azarmi, T. Coyle, and J. Mostaghimi, “Young’s modulus measurement and study of the relationship between me-chanical properties and microstructure of air plasma sprayed alloy 625,” Surface and Coatings Technology, vol. 203, no. 8, pp. 1045–1054, 2009.
[19] T. Nakamura, G. Qian, and C. C. Berndt, “Effects of pores on mechanical properties of plasma-sprayed ceramic coatings,”
Journal of the American Ceramic Society, vol. 83, no. 3,
pp. 578–584, 2004.
[20] C. Li, A. Ohmori, and R. Mcpherson, “The relationship be-tween microstructure and Young’s modulus of thermally sprayed ceramic coatings,” Journal of Materials Science, vol. 32, no. 4, pp. 997–1004, 1997.
[21] C. C. Berndt, “Thermal spray: international advances in coatings technology,” in Proceedings of the 13th International
Thermal Spray Conference, Orlando, FL, USA, May 1992.
[22] R. S. Lima, S. E. Kruger, and B. R. Marple, “Towards engi-neering isotropic behaviour of mechanical properties in thermally sprayed ceramic coatings,” Surface and Coatings
Technology, vol. 202, no. 15, pp. 3643–3652, 2008.
[23] T. Lauwagie, K. Lambrinou, S. Patsias, W. Heylen, and J. Vleugels, “Resonant-based identification of the elastic properties of layered materials: application to air-plasma sprayed thermal barrier coatings,” NDT & E International, vol. 41, no. 2, pp. 88–97, 2008.
[24] R. Navamathavan, K.-K. Kim, D.-K. Hwang et al., “A nanoindentation study of the mechanical properties of ZnO thin films on (0 0 0 1) sapphire,” Applied Surface Science, vol. 253, no. 2, pp. 464–467, 2006.
[25] G. Alcal´a, P. Skeldon, G. E. Thompson, A. B. Mann, H. Habazaki, and K. Shimizu, “Mechanical properties of amorphous anodic alumina and tantala films using nano-indentation,” Nanotechnology, vol. 13, no. 4, pp. 451–455, 2002. [26] W. C. Oliver and G. M. Pharr, “An improved technique for determining hardness and elastic modulus using load and displacement sensing indentation experiments,” Journal of
Materials Research, vol. 7, no. 6, pp. 1564–1583, 1992.
[27] G. Cheng, X. Sun, Y. Wang, S. L. Tay, and W. Gao, “Nanoindentation study of electrodeposited Ag thin coating: an inverse calculation of anisotropic elastic-plastic proper-ties,” Surface and Coatings Technology, vol. 310, pp. 43–50, 2017.
[28] J. H. Zhang and Z. Wei, “Global bifurcation and chaotic dynamics for a non-autonomous buckled thin plate,” Journal
of Dalian University of Technology, vol. 46, pp. 1–6, 2006.
[29] T. Nakamura and Y. Gu, “Identification of elastic-plastic anisotropic parameters using instrumented indentation and inverse analysis,” Mechanics of Materials, vol. 39, no. 4, pp. 340–356, 2007.
[30] J. J. Vlassak, M. Ciavarella, J. R. Barber, and X. Wang, “The indentation modulus of elastically anisotropic materials for indenters of arbitrary shape,” Journal of the Mechanics and
Physics of Solids, vol. 51, no. 9, pp. 1701–1721, 2003.
[31] J. J. Vlassak and W. D. Nix, “Measuring the elastic properties of anisotropic materials by means of indentation experi-ments,” Journal of the Mechanics and Physics of Solids, vol. 42, no. 8, pp. 1223–1245, 1994.
[32] M. Zhao, X. Chen, Y. Xiang et al., “Measuring elastoplastic properties of thin films on an elastic substrate using sharp indentation,” Acta Materialia, vol. 55, no. 18, pp. 6260–6274, 2007.
[33] A. Bolshakov and G. M. Pharr, “Influences of pileup on the measurement of mechanical properties by load and depth sensing indentation techniques,” Journal of Materials
Re-search, vol. 13, no. 4, pp. 1049–1058, 1998.
[34] I. N. Sneddon, “The relation between load and penetration in the axisymmetric boussinesq problem for a punch of arbitrary profile,” International Journal of Engineering Science, vol. 3, no. 1, pp. 47–57, 1965.
[35] V. R. Jablokov, N. G. D. Murray, H. J. Rack, and H. L. Freese, “Influence of oxygen content on the mechanical properties of
titanium-35niobium-7zirconium-5tantalum beta titanium alloy,” Journal of ASTM International, vol. 2, no. 8, article 12776, 2005.
[36] P. J. Torvik, “On estimating system damping from frequency response bandwidths,” Journal of Sound and Vibration, vol. 330, no. 25, pp. 6088–6097, 2011.
International Journal of
Aerospace
Engineering
Hindawi www.hindawi.com Volume 2018Robotics
Journal of Hindawi www.hindawi.com Volume 2018 Hindawi www.hindawi.com Volume 2018Active and Passive Electronic Components VLSI Design Hindawi www.hindawi.com Volume 2018 Hindawi www.hindawi.com Volume 2018
Shock and Vibration
Hindawi
www.hindawi.com Volume 2018
Civil Engineering
Advances inAcoustics and VibrationAdvances in
Hindawi
www.hindawi.com Volume 2018
Hindawi
www.hindawi.com Volume 2018
Electrical and Computer Engineering Journal of Advances in OptoElectronics Hindawi www.hindawi.com Volume 2018
Hindawi Publishing Corporation
http://www.hindawi.com Volume 2013 Hindawi www.hindawi.com
The Scientific
World Journal
Volume 2018 Control Science and Engineering Journal of Hindawi www.hindawi.com Volume 2018 Hindawi www.hindawi.com Journal ofEngineering
Volume 2018Sensors
Journal of Hindawi www.hindawi.com Volume 2018 Machinery Hindawi www.hindawi.com Volume 2018 Modelling & Simulation in Engineering Hindawi www.hindawi.com Volume 2018 Hindawi www.hindawi.com Volume 2018 Chemical EngineeringInternational Journal of Antennas and
Propagation International Journal of Hindawi www.hindawi.com Volume 2018 Hindawi www.hindawi.com Volume 2018 Navigation and Observation International Journal of Hindawi www.hindawi.com Volume 2018