저작자표시-비영리-변경금지 2.0 대한민국 이용자는 아래의 조건을 따르는 경우에 한하여 자유롭게 l 이 저작물을 복제, 배포, 전송, 전시, 공연 및 방송할 수 있습니다. 다음과 같은 조건을 따라야 합니다: l 귀하는, 이 저작물의 재이용이나 배포의 경우, 이 저작물에 적용된 이용허락조건 을 명확하게 나타내어야 합니다. l 저작권자로부터 별도의 허가를 받으면 이러한 조건들은 적용되지 않습니다. 저작권법에 따른 이용자의 권리는 위의 내용에 의하여 영향을 받지 않습니다. 이것은 이용허락규약(Legal Code)을 이해하기 쉽게 요약한 것입니다. Disclaimer 저작자표시. 귀하는 원저작자를 표시하여야 합니다. 비영리. 귀하는 이 저작물을 영리 목적으로 이용할 수 없습니다. 변경금지. 귀하는 이 저작물을 개작, 변형 또는 가공할 수 없습니다.
A Doctoral Dissertation
Effects of Oxidative Stress Induced by
Silver Nanoparticles on Cell Death
Mei-Jing Piao
Department of Medicine
Graduate School
Jeju National University
은나노입자에 의한 산화적 스트레스가
세포사멸에 미치는 영향
지도교수 현 진 원
박 미 경
이 논문을 의학 박사학위 논문으로 제출함
2012년 2월
박미경의 의학 박사학위 논문을 인준함
심사위원장 ○
印위 원 ○
印위
원 ○
印위
원 ○
印위
원 ○
印제주대학교 대학원
2012년 2월
Effects of Oxidative Stress Induced by Silver
Nanoparticles on Cell Death
Mei-Jing Piao
(Supervised by Professor Jin-Won Hyun)
A thesis submitted in partial fulfillment of the requirement for the
degree of Doctor of Philosophy in Medicine
2012. 02
This thesis has been examined and approved.
……….
……….
……….
……….
……….
………..
Department of Medicine
GRADUATE SCHOOL
JEJU NATIONAL UNIVERSITY
BACKGROUNDS
Silver nanoparticles (AgNPs) products, which have well-known antimicrobial properties, are extensively used as various medical and general products. Despite the widespread use of AgNPs products, relatively few studies have been undertaken to determine the cytotoxic effects of AgNPs exposure. This study investigates possible molecular mechanisms underlying the cytotoxic effects of AgNPs.
Initially, we show that AgNPs-induced cytotoxicity was higher compared to AgNO3, as a
silver ion source. AgNPs induced reactive oxygen species (ROS) generation via suppression of reduced glutathione (GSH) in human Chang liver cells. ROS generated by AgNPs resulted in damaged cellular components; DNA breaks, lipid membrane peroxidation, and protein carbonylation. Cell viability after AgNPs exposure was decreased via apoptosis, as shown by formation of apoptotic bodies, sub-G1 hypodiploid cells, and DNA fragmentation. AgNPs
induced a mitochondria-dependent apoptotic pathway via the modulation of Bax and Bcl-2 expressions, resulting in the disruption of mitochondrial membrane potential (Δψm). Loss of
the Δψm was followed by cytochrome c release from the mitochondria, resulting in the
activation of caspase 9 and 3. The apoptotic effect of AgNPs was exerted via the activation of c-Jun NH2-terminal kinase (JNK) and was abrogated by the JNK specific inhibitor, SP600125, and small interfering RNA (siRNA) targeting JNK.
Oxoguanine (oxoG) is a sensitive marker of ROS-induced DNA damage. 8-Oxoguanine DNA glycosylase 1 (OGG1) is an important DNA repair enzyme that recognizes and excises 8-oxoG. The further study was to examine the effect of AgNPs-induced oxidative stress on OGG1 and to elucidate mechanisms underlying AgNPs-AgNPs-induced toxicity. AgNPs decreased OGG1 mRNA and protein expression, resulted in the attenuation of OGG1 activity, further led to increased 8-oxoG levels. The transcription factor
NF-E2-related factor 2 (Nrf2) is an important factor in the inducible regulation of OGG1. AgNPs treatment decreased nuclear Nrf2 expression, translocation into nucleus, and transcriptional activity. Extracellular regulated kinase (ERK) and protein kinase B (PKB, AKT), which are upstreams of Nrf2, contribute to OGG1 expression. AgNPs attenuated both active forms of ERK and AKT protein expression, resulting in suppression of Nrf2 and decrease of OGG1 expression.
Antioxidant enzymes such as catalase (CAT) and glutathione peroxidase (GPx) have been reported to directly protect the cells from oxidative stress. The final part of the study is to investigate the roles of antioxidants in the high intracellular levels of ROS induced by AgNPs in human Chang liver cells and the molecular mechanisms involved. AgNPs increased ROS levels, coincided with the decreased expressions and activities of CAT and GPx, and cell survival, but the addition of N-acetylcysteine (NAC), a potent antioxidant, significantly reduced the ROS levels, restored the activities of CAT and GPx, and finally abated cell deaths. AgNPs decreased an AMP-activated protein kinase (AMPK)-forkhead transcription factor 3 (FOXO3) pathway, which is a signal pathway for the induction of antioxidant enzymes. The AMPK activator (AICAR) significantly restored the expressions of CAT and GPx with the reduction of ROS levels and cytotoxicity, whereas the opposite changes were observed with an AMPK inhibitor (Compound C). In addition, knockdown of AMPK by its specific siRNA markedly enhanced ROS generation and cytotoxicity.
In conclusion, this study shows that AgNPs causes cytotoxicity by oxidative stress-induced apoptosis and damage of cellular components. Studies also demonstrate that down-regulation of Nrf2-mediated OGG1 in exposure to AgNPs occurs through ERK and AKT inactivation. AgNPs-induced oxidative cytotoxicity also might be at least partially attributed to the diminished antioxidant enzyme activities via the inhibition of the AMPK-FOXO3 pathway.
Keywords: Silver nanoparticles; oxidative stress; glutathione; apoptosis; 8-Oxoguanine DNA glycosylase 1; 8-Oxoguanine; NF-E2-related factor 2; Reactive oxygen species; Antioxidant enzyme; AMP-activated protein kinase; Forkhead transcription factor 3.
Abbreviations used: AgNPs, silver nanoparticles; ROS, reactive oxygen species; GSH, glutathione; Δψm, mitochondrial membrane potential; JNK, c-Jun NH2-terminal kinase;
HR-MAS NMR, high-resolution magic angle spinning nuclear magnetic resonance; TEM, transmission electron microscopy; DLS, dynamic light scattering; THF, tetrahydrofuran; MTT, [3-(4,5-dimethylthiazol-2-yl)-2,5-diphenyltetrazolium] bromide; DCF-DA, 2′,7′-dichlorodihydrofluorescein diacetate; PI, propidium iodide; GCLC, catalytically active subunit of glutamate-cysteine ligase; GSS, glutathione synthetase; JC-1, 5,5',6,6'-Tetrachloro-1,1',3,3'-tetraethylbenzimidazolylcarbocyanine iodide; CMAC, tert-butoxycarbonyl-Leu-Met-7-amino-4-chloromethylcoumarine; DPPP, diphenyl-1-pyrenylphosphine; SP600125, anthrax [1,9-cd] pyrazol-6(2H)-one; PBS, phosphate buffered saline; TSP, 3-(trimethylsilyl) propionic-2, 2, 3, 3-d4 acid; LMA, low melting agarose;
siRNA, small interfering RNA; NAC, N-acetyl cysteine; γ-GCL, γ-glutamate cystein ligase; 8-oxoG, 8-Oxoguanine; OGG1, 8-Oxoguanine DNA glycosylase 1; Nrf2, NF-E2-related factor 2; ERK, Extracellular regulated kinase; PKB or AKT, protein kinase B; CAT, catalase; GPx, glutathione peroxidase; AMPK, AMP-activated protein kinase; FOXO3, forkhead transcription factor 3; SOD, superoxide dismutase; AICAR, 5-aminoimidazole-4-carboxamide-1-β-D-ribofuranosyl 5′-monophosphate; ChIP, chromatin immunoprecipitation; RT-PCR, reverse transcription-polymerase chain reaction; BER, base excision repair; MAPK, mitogen activated protein kinase; TRITC, tetramethylrhodamine isothiocyanate.
CONTENTS
BACKGROUND...Ⅰ CONTENTS...Ⅳ PART ONE...Ⅴ PART TWO...Ⅶ PART THREE...Ⅷ LIST OF FIGURES...Ⅹ REFERENCES...72 ABSTRACT IN KOREAN ...92 감사의 글 ... ...94PART ONE
ABSTRACT... 2
1. INTRODUCTION... 3
2. MATERIALS AND METHODS…... 5
2.1. Reagents 2.2. Cell culture 2.3. Cell viability
2.4. Observation by phase contrast inverted microscopy 2.5. Intracellular ROS measurement
2.6. Detection of reduced GSH level by using high-resolution magic angle spinning nuclear magnetic resonance (HR-MAS NMR) spectroscopy
2.7. Intracellular GSH measurement 2.8. Western blot analysis
2.9. Single cell gel electrophoresis (Comet assay) 2.10. Lipid peroxidation assay
2.11. Protein carbonyl formation
2.12. Nuclear staining with Hoechst 33342
2.13. Detection of apoptotic sub-G1 hypodiploid cells
2.14. DNA fragmentation 2.15. Δψm analysis
2.16. Transient transfection of siRNA 2.17. Statistical analysis
3. RESULTS... 13
3.1. AgNPs induce cytotoxicity
3.2. AgNPs induce reactive oxygen species 3.3. The effect of AgNPs on reduced glutathione
3.4. Oxidative stress induced by AgNPs damages cellular components
3.5. AgNPs induce apoptosis via a mitochondria- and caspase-dependent pathway 3.6. AgNPs-induced apoptosis requires JNK activation
PART TWO
ABSTRACT... 31
1. INTRODUCTION... 32
2. MATERIALS AND METHODS... 33
2.1. Reagents 2.2. Cell culture
2.3. Transient transfection and OGG1 promoter luciferase assay 2.4. Reverse transcription-polymerase chain reaction (RT-PCR) 2.5. Western blot analysis
2.6. Transfection of cells with 8-oxoG-containing molecular beacon 2.7. Detection of 8-oxoG
2.8. Immunocytochemistry
2.9. Chromatin immunoprecipitation (ChIP) assay 2.10. Statistical analysis
3. RESULTS…... 38
3.1. Effect of AgNPs on the transcriptional activity of the OGG1 promoter and on OGG1 mRNA and protein expression
3.2. Effect of AgNPs on OGG1 activity 3.3. Effect of AgNPs on the levels of 8-oxoG
3.4. Effect of AgNPs on the Nrf2 transcription factor
PART THREE
ABSTRACT... 49
1. INTRODUCTION... 50
2. MATERIALS AND METHODS... 53
2.1. Reagents 2.2. Cell culture
2.3. Western blot analysis 2.4. CAT activity
2.5. GPx activity
2.6. Intracellular ROS measurement 2.7. Cell viability
2.8. Immunoprecipitation and Western blot analysis for the detection of phosphorylated FOXO3
2.9. Transient transfection of siRNA 2.10. Statistical analysis
3. RESULTS... 57
3.1. AgNPs induced ROS generation, decreased intracellular antioxidant enzymes, and cell viability
3.2. AgNPs decreased AMPK signaling pathway
3.3. AMPK activator modulates AgNPs-induced ROS generation, cytotoxicity, and antioxidant enzyme expression
3.4. Suppression of AMPK regulates AgNPs-induced ROS generation, cytotoxicity, and antioxidant enzyme expression
LIST OF FIGURES
Fig. 1. Cytotoxicity induced by AgNPs in human Chang liver cells... 13
Fig. 2. Generation of intracellular ROS in response to AgNPs... 15
Fig. 3. Effects of AgNPs on cellular glutathione systems.………... 17
Fig. 4. Oxidative stress-induced damage to cellular components by AgNPs... 19
Fig. 5. Apoptosis induced by AgNPs... 22
Fig. 6. Activation of JNK by AgNPs... 24
Fig. 7. A proposed pathway for AgNPs-induced ROS generation and intracellular GSH depletion, damage to cellular components, and apoptosis... 29
Fig. 8. Effect of AgNPs on transcriptional activity of OGG1 promoter, OGG1 mRNA expression and protein expression... 38
Fig. 9. Effect of AgNPs on OGG1 activity. The 8-oxoG-containing beacon was trans-fected into cells... 40
Fig. 10. Effect of AgNPs on 8-oxoG levels. ... 42
Fig. 11. Effects of AgNPs on Nrf2 expression, translocalization into the nucleus, and binding to OGG1 promoter... 43
Fig. 13. Time course of AgNPs on intracellular ROS, protein expressions and activities of CAT and GPx, and cytotoxicity in Chang liver cells ... 58
Fig. 14. Effects of AgNPs on AMPK signaling pathway ... 62
Fig. 15. Effects of AMPK activator on ROS generation, cytotoxicity, CAT and GPx
expression in AgNPs-treated cells ... 63
Fig. 16. Effects of AMPK inhibitor on ROS generation, cytotoxicity, CAT and GPx
expressions in AgNPs-treated cells... 66
Fig. 17. Knockdown of AMPK on ROS generation and cytotoxicity in AgNPs-treated cells ... 69
PART I
Silver nanoparticles induce oxidative cell damage in human liver
cells through inhibition of reduced glutathione and induction of
mitochondria-involved apoptosis
ABSTRACT
AgNPs products, which have well-known antimicrobial properties, are extensively used as various medical and general products.
Despite the widespread use of AgNPs products, relatively few studies have been undertaken to determine the cytotoxic effects of AgNPs exposure. This study investigates possible molecular mechanisms underlying the cytotoxic effects of AgNPs. Here, we show that AgNPs-induced cytotoxicity was higher compared to AgNO3, as a silver ion source. AgNPs induced
ROS generation via suppression of reduced GSH in human Chang liver cells. ROS generated by AgNPs resulted in damaged cellular components; DNA breaks, lipid membrane peroxidation, and protein carbonylation. Cell viability after AgNPs exposure decreased via apoptosis, as shown by formation of apoptotic bodies, sub-G1 hypodiploid cells, and DNA
fragmentation. AgNPs induced a mitochondria-dependent apoptotic pathway via the modulation of Bax and Bcl-2 expressions, resulting in the disruption of Δψm. Loss of the Δψm
was followed by cytochrome c release from the mitochondria, resulting in the activation of caspase 9 and 3. The apoptotic effect of AgNPs was exerted via the activation of JNK and was abrogated by the JNK specific inhibitor, SP600125, and siRNA targeting JNK. In summary, the results suggest that AgNPs causes cytotoxicity by oxidative stress-induced apoptosis and damage of cellular components.
1. INTRODUCTION
Nanoparticles range in length from 1 to 100 nm in two or three dimensions (Lewinski et al., 2008). Nanoparticles are used in bioapplications as therapeutics, transfection vectors, and fluorescent labels (Kreuter and Gelperina, 2008; Su et al., 2008; Tan et al., 2007; Yoon et al., 2007). AgNPs are one of the most commonly used nanomaterials. For example, AgNPs are used in coating or embedding for medical purposes (Cohen et al., 2007; Fu et al., 2006; Xu et al., 2008). In addition to their medical uses, AgNPs are also used in clothing, the food industry, paints, electronics and other fields (Cheng et al., 2004; Cohen et al., 2007; Lee et al., 2007; Vigneshwaran et al., 2007). Despite their widespread use, there is a serious lack of information concerning the toxicity of AgNPs to humans and their underlying cellular actions. Recent studies have shown that AgNPs accumulation in the liver could induce cytotoxicity via oxidative cell damage (Hussain et al., 2005; Hsin et al., 2008; Kim et al., 2009).
ROS are continually generated and eliminated in biological systems. They play important roles in a variety of normal biochemical functions, and abnormality in their functions results in pathological processes. Excessive production of ROS in the cell is known to induce apoptosis (Martindale and Holbrook, 2002; Sastre et al., 2000). ROS generation has been shown to play an important role in apoptosis induced by treatment with AgNPs (Carlson et al., 2008; AshaRani et al., 2009; Foldbjerg et al., 2009). The JNK is a member of the mitogen-activated protein (MAP) kinase family and plays a proapoptotic function in response to various cellular stresses (Shen and Liu, 2006). JNK is strongly activated by ROS or by amild oxidative shift of the intracellular thiol/disulfide redox state, leading to apoptosis (Hsin et al., 2008; Mao et al., 2008). Although a few research groups have investigated the toxicity of AgNPs in terms of cell death via ROS generation, little is known about the mechanisms of AgNPs-mediated toxicity (Arora et al., 2008; Hussain et al., 2005). Our results suggest that AgNPs increase the
2. MATERIALS AND METHODS
2.1. Reagents
Characterization of AgNPs was conducted as described previously (Eom and Choi, 2010). Energy filtering transmission electron microscopy (TEM) was used to examine the shape and size of the AgNPs. Twenty microliter of particle suspension was dried onto a 400 mesh carbon-coated copper grid and imaged using a LIBRA 120 TEM (Carl Zeiss, Oberkochen, Baden-Wurttemberg, Germany) at 80-120 kV. The size distribution of the AgNPs was evaluated using a photal dynamic light scattering (DLS) spectrometer (DLS-7000, Otsuka Electronics Co., Inc., Osaka, Japan). The particle size provided by the manufacturer was below 100nm (Sigma-Aldrich Chemical Company, St. Louis, MO, USA), however, the TEM images indicated that AgNPs prepared via the tetrahydrofuran (THF) method had an even distribution, with individual particle sizes ranging from 5 to 10 nm. AgNPs tend to agglomerate when exposed to cells; the results obtained by DLS indicated that the most of the NPs in the medium were of about 28-35nm in size. Ag ions were estimated using a multitype inductively coupled plasma emission spectrometer (ICPE-9000, Shimadzu, Tokyo, Japan). The concentrations of AgNPs and Ag ions had equivalent Ag masses and measured prior to exposure of the compounds to cell culture media. [3-(4,5-dimethylthiazol-2-yl)-2,5-diphenyltetrazolium] bromide (MTT), 2',7'-dichlorodihydrofluorescein diacetate (DCF-DA), propidium iodide (PI), and Hoechst 33342 were purchased from the Sigma-Aldrich Chemical Company. A catalytically active subunit of glutamate-cysteine ligase (GCLC) was purchased from Thermo Scientific (Fremont, CA, USA). Reduced glutathione synthetase (GSS) and siRNA against JNK were purchased from Santa Cruz Biotechnology (Santa Cruz, CA, USA). The primary antiBcl2, Bax, -cytochrome c, -caspase 9, -caspase 3, -phospho JNK, and -JNK antibodies were purchased from Cell Signaling Technology (Beverly, MA, USA).
5,5',6,6'-Tetrachloro-1,1',3,3'-tetraethylbenzimidazolylcarbocyanine iodide (JC-1) was purchased from Invitrogen (Carlsbad, CA, USA). Tert-butoxycarbonyl-Leu-Met-7-amino-4-chloromethylcoumarine (CMAC) and diphenyl-1-pyrenylphosphine (DPPP) were purchased from Molecular Probe (Eugene, OR, USA). Anthrax [1,9-cd] pyrazol-6(2H)-one (SP600125) was purchased from Calbiochem (San Diego, CA, USA). All other chemicals and reagents were of analytical grade.
2.2. Cell culture
Human Chang liver cells were obtained from the American Type Culture Collection (Rockville, MD, USA) and maintained at 37 ℃ in an incubator with a humidified atmosphere of 5% CO2 and cultured in RPMI-1640 medium containing 10% heat-inactivated fetal calf
serum, streptomycin (100 mg/ml) and penicillin (100 U/ml).
2.3. Cell viability
Cells were treated with AgNPs and AgNO3 at various concentrations. Twenty four hours
later, 50 ml of the MTT stock solution (2 mg/ml) was added to each well for a total reaction volume of 200 ml. After incubating for 4 h, the plate was centrifuged at 800×g for 5 min followed by aspiration of the supernatants. The formazan crystals in each well were dissolved in 150 ml of dimethylsulfoxide and the A540 was read in a scanning multi-well
spectrophotometer (Carmichael et al., 1987). To determine the effect of the JNK pathway on cell viability, cells were pre-treated with SP600125 (an inhibitor of JNK) for 1 h at a final concentration of 10 mM, followed by 4 mg/ml of AgNPs for 24 h. Cell viability was measured using the MTT assay.
2.4. Observation by phase contrast inverted microscopy
observed by phase contrast inverted microscopy at 100× magnification.
2.5. Intracellular ROS measurement
Cells were treated with AgNPs and incubated for various times at 37 ℃. After addition of 25 mM of DCF-DA, the fluorescence of 2',7'-dichlorofluorescein was detected using a Perkin Elmer LS-5B spectrofluorometer and a flow cytometer (Becton Dickinson, Mountain View, CA, USA) (Rosenkranz et al., 1992). The image analysis for the generation of intracellular ROS was achieved by seeding the cells on a cover-slip-loaded six well plate at 2×10⁵ cells/well.
Sixteen hours after plating, the cells were treated with AgNPs. Thirty minutes later, 100 mM of DCF-DA was added to each well and was incubated for an additional 30 min at 37 ℃. After washing with PBS, the stained cells were mounted onto a microscope slide in mounting medium (DAKO, Carpinteria, CA, USA). The microscopic images were collected using the Laser Scanning Microscope 5 PASCAL program (Carl Zeiss, Jena, Germany) on a confocal microscope.
2.6. Detection of reduced GSH level by using high-resolution magic angle spinning nuclear magnetic resonance (HR-MAS NMR) spectroscopy
Twenty mg of cell pellet was loaded into a nano zirconium rotor. Deuterium oxide and TSP-d4 were used as the field-lock frequency and chemical shift reference, respectively. The total
volume was adjusted to 45 ml with deuterium oxide in 20 ml of deuterium oxide mixed with 5 ml of 20 mM 3-(trimethylsilyl) propionic-2, 2, 3, 3-d4 acid (TSP) and was transferred into a 4
mm zirconium rotor (Chan et al., 2009). The rotor lid was closed and marked to monitor the spinning speed. Measurement of 1H NMR spectra was carried out on a 400 MHz Varian Unity-Inova (Varian Inc., Palo Alto, CA, USA) operating at a proton frequency of 400.266 MHz. All instruments were equipped with HX nanoprobes with a spin rate of 2000 Hz and were
regulated at 147 ℃. The water signal was suppressed by a pre-saturation pulse sequence. Each
1H NMR spectrum was recorded over 512 scans requiring about a 40 min total acquisition time.
The acquisition time and relaxation delay time were 2 s and 1 s, respectively. All data were referenced to TSP-d4 at δ 0.00 ppm and were apodized with an exponential function using a
line broadening of 0.2 Hz. All NMR spectra were Fourier transformed, phased, and baseline corrected using MestreNova Suite 5.3.1. A spectral assignment was performed by ChenomX NMR Suite 6.01 software (ChenomX Inc., Canada). Spectra were normalized to the TSP concentration, superimposed, and stacked to compare GSH concentration.
2.7. Intracellular GSH measurement
Intracellular GSH content was measured using a commercial colorimetric assay kit, GSH-400 from OXIS International (Portland, OR, USA). Cells were harvested and were homogenized in ametaphosphoric working solution. After centrifugation, 50 ml of R1 solution (a solution of a chromogenic reagent in HCl) was added to 900 ml of supernatant, followed by gentle vortex mixing. Following the addition of 50 ml of R2 solution (30% NaOH), the mixtures were incubated at 25±3℃ for 10 min. After centrifugation, the absorbance of the clear supernatant was measured at 400 nm. In addition, image analysis of the intracellular GSH level was also assessed. After cells were incubated with 5 mM CMAC, a GSH sensitive fluorescence dye, for 30 min in the dark, cells were treated with AgNPs. The CMAC fluorescence images were analyzed by a Zeiss Axiovert 200 inverted microscope at an excitation wavelength of 351 nm and an emission wavelength of 380 nm (Tauskela et al., 2000).
2.8. Western blot analysis
8.0, 0.1% NP 40) and centrifuged at 13,000×g for 15 min. The supernatants were collected from the lysates and the protein concentrations were determined. Aliquots of the lysates (40 μg of protein) were boiled for 5 min and electrophoresed in 10% SDS-polyacrylamide gel. The proteins in the gels were transferred onto nitrocellulose membranes (Bio-Rad, Hercules, CA, USA) and subsequently incubated with primary antibodies. The membranes were further incubated with secondary anti-immunoglobulin-G-horseradish peroxidase conjugates (Pierce, Rockford, IL, USA), followed by exposure to X-ray film. The protein bands were detected using an enhanced chemiluminescence western blotting detection kit (Amersham, Little Chalfont, Buckinghamshire, UK).
2.9. Single cell gel electrophoresis (Comet assay)
A comet assay was performed to determine the degree of oxidative DNA damage (Singh, 2000). Cells were exposed to AgNPs for 3 h, washed with PBS. The cell suspension was mixed with 75 ml of 0.5% low melting agarose (LMA) at 39 ℃, and spread on a fully frosted microscopic slide pre-coated with 200 ml of 1% normal melting agarose (NMA). After the solidification of the agarose, the slide was covered with another 75 ml of 0.5% LMA and then immersed in a lysis solution (2.5 M NaCl, 100 mM Na-EDTA, 10 mM Tris, 1% Trion X-100, and 10% DMSO, pH 10) for 1 h at 4 ℃. The slides were then placed in a gel-electrophoresis apparatus containing 300 mM NaOH and 10 mM Na-EDTA (pH 13) for 40 min to allow for DNA unwinding and the alkali labile damage. Next, an electrical field (300 mA, 25 V) was applied for 20 min at 4 ℃ to draw the negatively charged DNA toward an anode. After the electrophoresis, the slides were washed three times for 5 min at 4 ℃ in a neutralizing buffer (0.4 M Tris, pH 7.5), followed by staining with 75 ml of PI (20 mg/ml). The slides were observed using a fluorescence microscope and image analyzer (Kinetic Imaging, Komet 5.5, UK). The percentage of the total fluorescence in the tail and the length of the tail were
recorded in 50 cells per slide.
2.10. Lipid peroxidation assay
Lipid peroxidation was assayed by determination of 8-isoprostane levels (Manzer et al., 2006; Beauchamp et al., 2002). The levels of 8-isoprostane in the culture medium were determined using of a commercial enzyme immunoassay (Cayman Chemical, Ann Arbor, MI, USA) according to the manufacturer’s instructions. Lipid peroxidation was also estimated using DPPP, a fluorescent probe (Okimotoa et al., 2000). After cells were incubated with 5 mM of DPPP for 15 min in the dark, cells were treated with AgNPs. The DPPP fluorescence images were analyzed using a Zeiss Axiovert 200 inverted microscope at an excitation wavelength of 351 nm and an emission wavelength of 380 nm.
2.11. Protein carbonyl formation
The amount of carbonyl formation in protein was determined using an OxiselectTM protein
carbonyl ELISA kit purchased from Cell Biolabs (San Diego, CA, USA) according to the manufacturer’s instructions.
2.12. Nuclear staining with Hoechst 33342
Hoechst 33342, which is a DNA-specific fluorescent dye, was added to each well and incubated for 10 min at 37 ℃. The stained cells were visualized under a fluorescent microscope, equipped with a CoolSNAP-Pro color digital camera to examine the degree of nuclear condensation.
2.13. Detection of apoptotic sub-G1 hypodiploid cells
(Nicoletti et al., 1991). Cells were fixed in 1ml of 70% ethanol for 30 min at 4 ℃, then washed twice with PBS, and incubated for 30 min in the dark at 37 ℃ in 1 ml of PBS containing 100 mg of propidium iodide and 100 mg of RNase A. A flow cytometric analysis was performed using a FACSCalibur flow cytometery. The percentage of sub-G1 hypodiploid cells was
assessed based on the histograms generated by the Cell Quest and Mod-Fit computer programs.
2.14. DNA fragmentation
The level of cellular DNA fragmentation was assessed by analyzing cytoplasmic histone-associated DNA fragmentation using a kit from Roche Diagnostics (Portland, OR, USA) according to the manufacturer’s instructions.
2.15. Δψm analysis
Mitochondrial Δψ was analyzed using JC-1, a lipophilic cationic fluorescence dye. JC-1 was added to each well and incubated for an additional 30 min at 37 ℃. After washing with PBS, the stained cells were assayed using a flow cytometer. For image analysis of mitochondrial Δψ, the stained cells were mounted onto microscope slide in mounting medium.Microscopic images were collected using the Laser Scanning Microscope 5 PASCAL program on a confocal microscope (Cossarizza et al., 1993).
2.16. Transient transfection of siRNA
Cells were seeded at 1.5×10⁵ cells/well in a 24-well plate and allowed to reach approximately 50% confluence on the day of transfection. The siRNA constructs used were amismatched siRNA control and siRNA against JNK. Cells were transfected with 10-50 nM siRNA using lipofectamineTM 2000 (Invitrogen, Carlsbad, CA) based on the manufacturer’s
by either Western blot or MTT assay.
2.17. Statistical analysis
All measurements were made in triplicate and all values were expressed as the means±standard error of the mean (SEM). The results were subjected to an analysis of variance (ANOVA) using the Tukey test to analyze the difference. Values of p < 0.05 were considered significant.
3. RESULTS
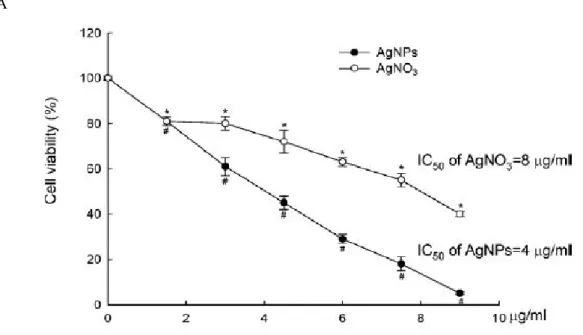
3.1. AgNPs induce cytotoxicity
AgNPs and AgNO3 showed cytotoxicity in a dose-dependent manner in human Chang liver
cells (Fig. 1A). AgNPs showed higher cytotoxicity compared to AgNO3 because the IC50
(concentration yielding 50% growth inhibition) of AgNPs and AgNO3 were about 4 and 8
mg/ml, respectively. The concentration of AgNPs corresponding to the IC50 (4 mg/ml) was used
as optimal concentration for further study. To determine AgNPs incorporation into cells, phase contrast inverted microscopy was utilized. As shown in Fig. 1B, AgNPs-treated cells were observed to have increased intracellular AgNPs concentrations compared to untreated cells (control).
A
Fig. 1. Cytotoxicity induced by AgNPs in human Chang liver cells. (A) Cells were treated with
AgNPs and AgNO3 at various concentrations for 24 h, and cytotoxicity was determined by the
MTT method. Calculated IC50 values are shown in the upper right corner of each curve. Data
represent mean±SEM. * and # denote significant differences from untreated cells of AgNPs and AgNO3, respectively (p < 0.05).
B
Fig. 1. continued. (B) Incorporation of AgNPs into cells was visualized by inverted
microscopy (magnification 100×).
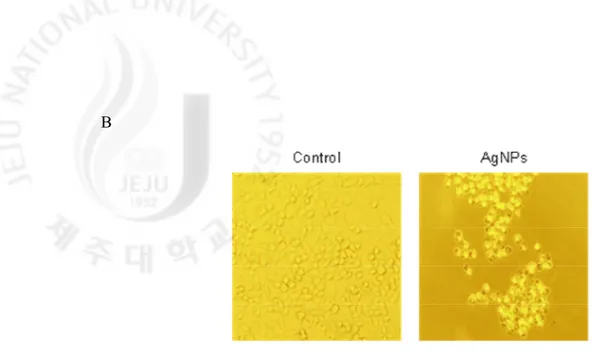
3.2. AgNPs induce ROS
Oxidative stress has been cited as one of the more important mechanisms of toxicity related to nanoparticle exposure (Nel et al., 2006). To investigate the potential role of oxidative stress induced by AgNPs, ROS generation was measured. As shown in Fig. 2A, the ROS levels generated in response to AgNPs were significantly maintained for 12 h, and AgNPs-induced ROS were suppressed by NAC, a synthetic antioxidant. This pattern was also confirmed byflowcytometric data that showing a fluorescence intensity of 341 in AgNPs-treated cells at 3 h compared to 146 in control cells (Fig. 2B). Confocal microscopy illustrated that the red fluorescence intensity of ROS was enhanced in AgNPs-treated cells compared to control cells (Fig. 2C). These results suggest that AgNPs results in the production of ROS.
A
B
Fig. 2. Generation of intracellular ROS in response to AgNPs. Generation of intracellular ROS
was detected by spectrofluorometry (A) and flow cytometry (B) after DCF-DA treatment. The values were expressed as means±SEM. *Significantly different from control (p < 0.05), and #significantly different from AgNPs-treated cells (p < 0.05). FI: fluorescence intensity of DCF-DA.
C
Fig.2. continued. (C) The representative confocal images illustrate the increase in red
fluorescence intensity of DCF produced by ROS in AgNPs-treated cells compared to the control (original magnification 400×).
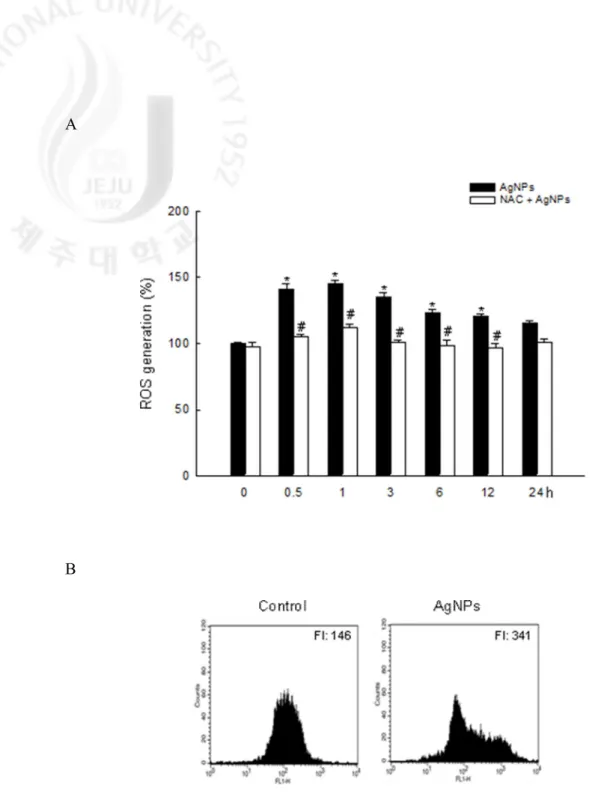
3.3. The effect of AgNPs on reduced glutathione
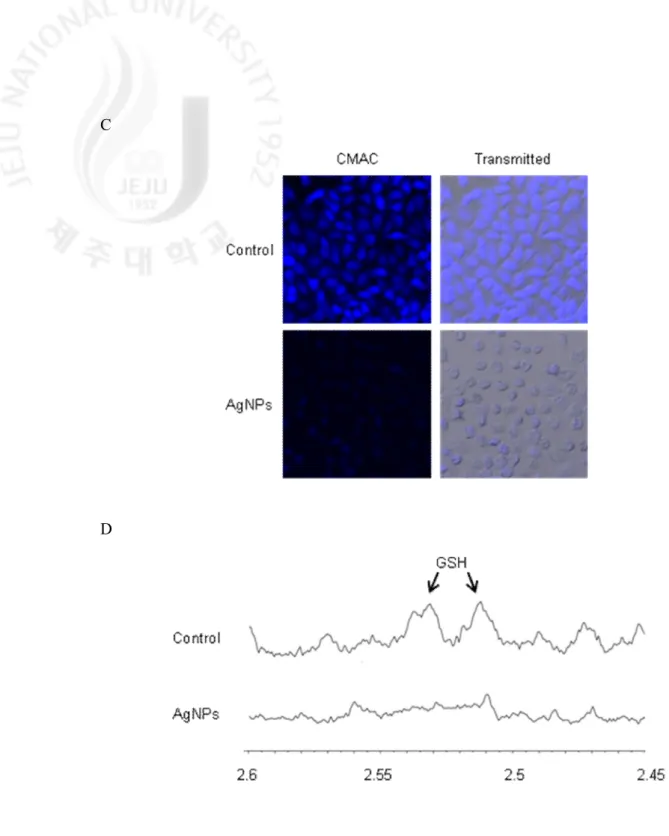
GSH is a sulfhydryl-containing molecule present in cells that is responsible for maintaining cellular oxidation–reduction homeostasis. Alterations in GSH level can be monitored as an indication of oxidative stress in cells. GSH is formed by γ-glutamate cystein ligase (γ-GCL) and GSS. The protein expression of the catalytically active subunit of γ-GCL (GCLC) and GSS was decreased by AgNPs treatment in time dependent manner (from 0.5 h to 24 h) (Fig. 3A). Similarly, AgNPs treatment decreased GSH levels as measured in colorimetric assay system in a timedependent manner, and NAC pretreatment in AgNPs-treated cells restored it via scavenging of ROS (Fig. 3B). The confocal microscopic data illustrated that the blue fluorescence intensity of cellular GSH was decreased in AgNPs-treated cells compared to
control cells (Fig. 3C). HR-MAS NMR can be used with bio-fluids, tissues and cells for the identification and quantification of metabolites (Bayet-Robert et al., 2010). GSH signals appear at δ 2.2 ppm (quartet), 2.5 ppm (multiplet), 2.9 ppm (multiplet) and 3.8 ppm (multiplet). The NMR spectra in our study detect GSH in the 2.51–2.55 ppm range and AgNPs treatment nearly depleted GSH levels (Fig. 3D). These results suggest that GSH levels depleted by AgNPs were due to decrease levels of GCLC and GSS and ultimately resulted in oxidative stress.
A
B
Fig. 3. Effects of AgNPs on cellular glutathione systems. (A) Cell lysates were electrophoresed
and GCLC and GSS proteins were detected using specific antibodies. Levels of GSH were detected using (B) a GSH content assay kit. The values were expressed as means±SEM. *Significantly different from control (p < 0.05), and #significantly different from AgNPs-treated cells (p < 0.05).
C
D
Fig. 3. continued. Levels of GSH were detected using (C) confocal microscopy after
fluorescent probe CMAC staining, and (D) HR-MAS NMR spectroscopy.
3.4. Oxidative stress induced by AgNPs damages cellular components
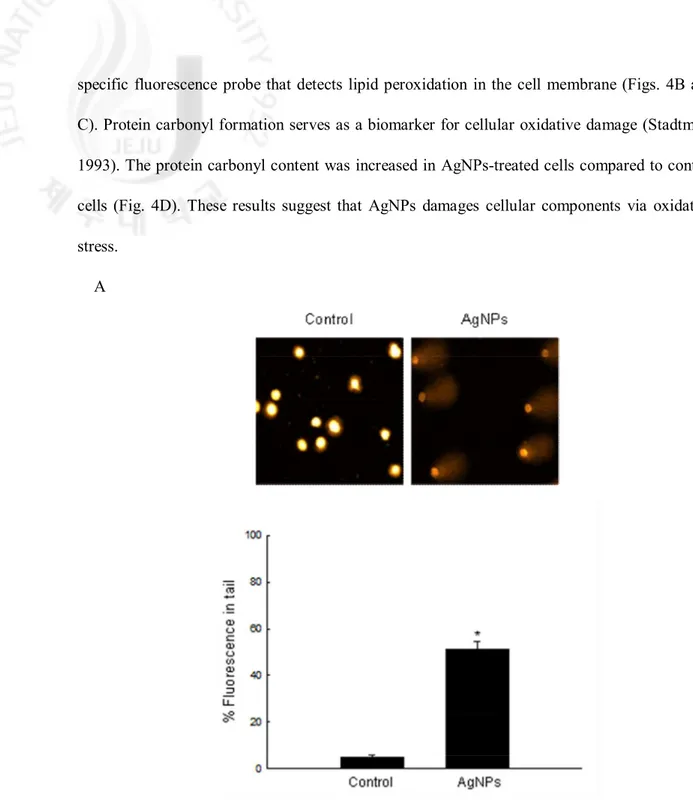
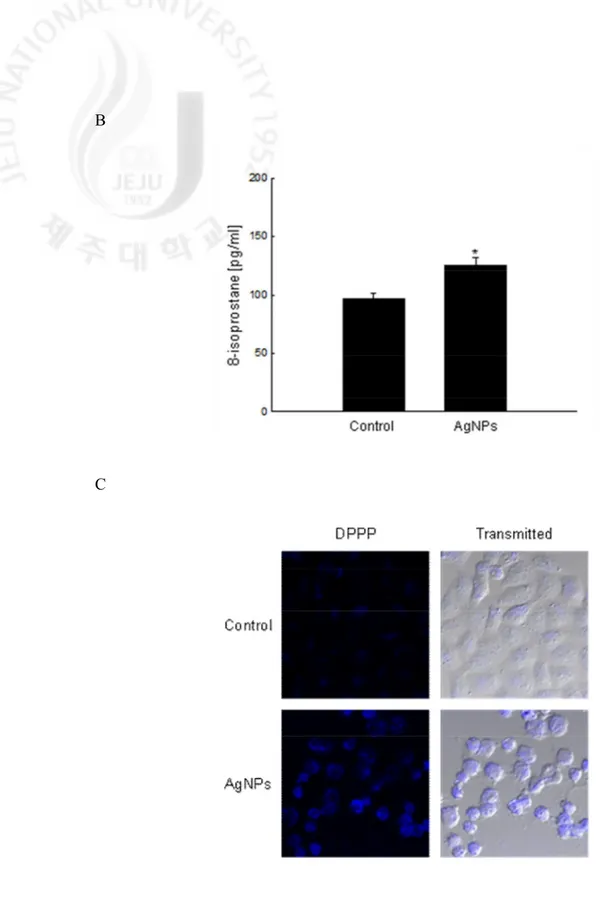
AgNPs treatment increased the tail length and percentage of DNA in the tails compared to control cells (Fig. 4A). AgNPs-treated cells showed increases in lipid peroxidation as measured by the levels of 8-isoprostane and by microscopic observation after staining with DPPP, a
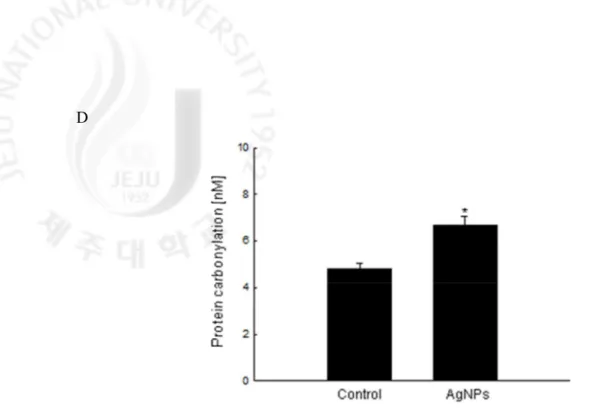
specific fluorescence probe that detects lipid peroxidation in the cell membrane (Figs. 4B and C). Protein carbonyl formation serves as a biomarker for cellular oxidative damage (Stadtman, 1993). The protein carbonyl content was increased in AgNPs-treated cells compared to control cells (Fig. 4D). These results suggest that AgNPs damages cellular components via oxidative stress.
A
Fig. 4. Oxidative stress-induced damage to cellular components by AgNPs. (A) Representative
images and percentage of cellular DNA damage were detected using an alkaline comet assay. The values are expressed as means±SEM. *Significantly different from control cells (p < 0.05).
B
C
Fig. 4. continued. Lipid peroxidation was assayed by (B) measuring the level of 8-isoprostane
and (C) detected using confocal microscopy after DPPP fluorescence staining. The values are expressed as means±SEM. *Significantly different from control cells (p < 0.05).
D
Fig. 4. continued. (D) Protein oxidation was assayed by measuring the amount of carbonyl
formation. The values are expressed as means±SEM. *Significantly different from control cells (p < 0.05).
3.5. AgNPs induce apoptosis via a mitochondria- and caspase-dependent pathway
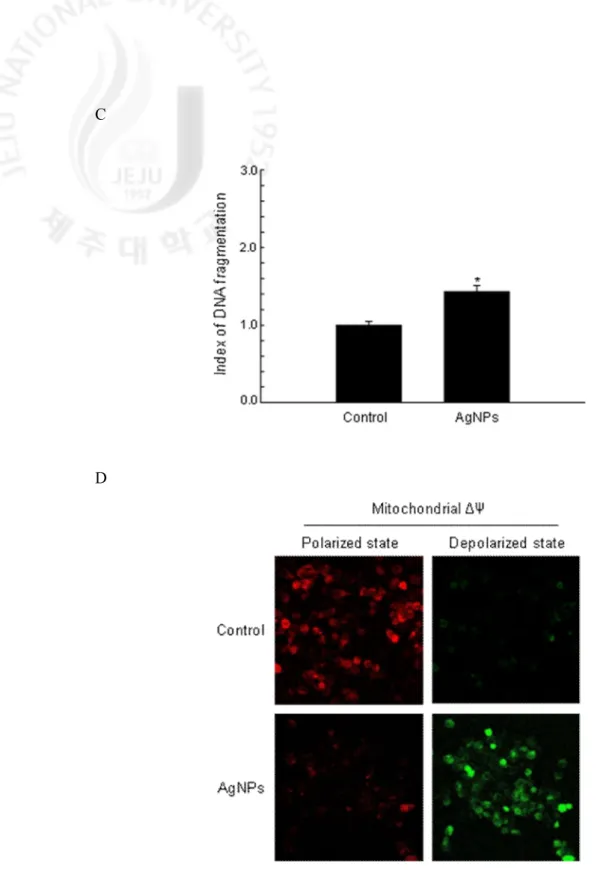
To evaluate the cytotoxic effects of AgNPs in terms of apoptosis, the cellular nuclei were stained with Hoechst 33342 and assessed by microscopy. The microscopic pictures in Fig. 5A revealed that the control cells had intact nuclei, while the AgNPs-treated cells showed significant nuclear fragmentation, which is indicative of apoptosis. However, NAC pretreatment in AgNPs-treated cells showed a decrease in nuclear fragmentation. An analysis of the apoptotic sub-G1 DNA content in the AgNPs-treated cells revealed a 28% increase compared to control
cells (Fig. 5B). In addition, AgNPs treatment increased the levels of cytoplasmic histone-associated DNA fragmentation (Fig. 5C). During the apoptotic process, the mitochondrial membrane pores are opened and Δψm was disrupted (Zamzami et al., 1996). As shown in Fig.
5D, JC-1 staining data showed that AgNPs-treated cells exhibited a decrease in red fluorescence (polarized state) and an increase in green fluorescence (depolarized state). Bcl-2 prevents the opening of the mitochondrial membrane pore and Bax accelerates it (Zamzami et al., 1995).
Pore opening results in the loss of Δψm, which induces the release of cytochrome c from
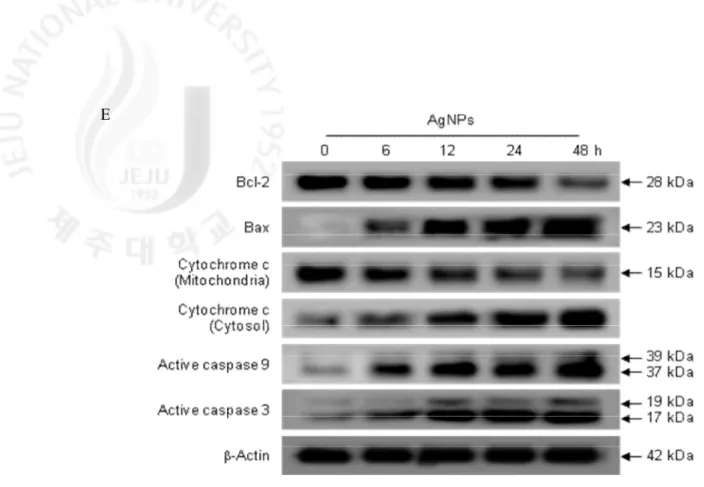
mitochondria (Zhivotovsky et al., 1998). As shown in Fig. 5E, AgNPs treatment resulted in a decrease in Bcl-2 expression and an increase in Bax expression in a time dependent manner; the Bax/Bcl-2 ratio was 1.0, 7.0, 9.5, 12.8 and 24.5 at 0 h, 6 h, 12 h, 24 h, and 48 h after AgNPs tratment, respectively. The change in the Bax/Bcl-2 ration led to the release cytochrome c from the mitochondria into the cytosol. AgNPs led to the active forms of caspase 9 and caspase 3 (a target of caspase 9) in time-dependent manner (from 6 h to 48 h), which are activated in response to mitochondrial membrane disruption. These results suggest that AgNPs-induced apoptosis signals through a caspase-dependent pathway with mitochondrial involvement.
A
B
Fig. 5. Apoptosis induced by AgNPs. (A) Apoptotic body formation was observed under a
fluorescent microscope after Hoechst 33342 staining. The apoptotic bodies are indicated with arrows. (B) The apoptotic sub-G1 DNA content was detected using flow cytometer after
C
D
Fig. 5. continued. (C) DNA fragmentation was quantified using an ELISA kit. The values are
expressed as means±SEM. *Significantly different from control cells (p < 0.05). (D) The Δψm
E
Fig. 5. continued. (E) Bcl-2, Bax, mitochondria and cytosol cytochrome c, caspase 9, and
caspase 3 were detected using specific antibodies.
3.6. AgNPs-induced apoptosis requires JNK activation
AgNPs induced JNK phosphorylation (the active form of JNK) in a time-dependent manner (from 1 h to 24 h) (Fig. 6A). Pretreatment with SP600125 attenuated AgNPs-induced cytotoxicity (Fig. 6B). Likewise, transfection with siRNA against JNK abolished AgNPs-induced death (Fig. 6C), suggesting that JNK is involved in AgNPs-mediated apoptosis.
A
Fig. 6. Activation of JNK by AgNPs. (A) Phospho JNK and JNK were detected using specific
B
C
Fig. 6. continued. (B) Cells were pre-incubated with SP600125 for 1 h, followed by
incubation with AgNPs for 24 h. Cell viability was measured using the MTT assay. (C) Cells were transfected with siControl and siJNK RNA. At 24 h after transfection, the cells were treated with AgNPs for 24 h and cell viability was measured using the MTT assay. *Significantly different from control (p < 0.05), and #significantly different from AgNPs-treated cells (p < 0.05).
4. Discussion
Our studies provided evidence for a molecular mechanism via which AgNPs induce cell damage via the generation of ROS and the induction of apoptosis. In our system, using phase contrast inverted microscopy, AgNPs-treated cells were observed to have increased intracellular AgNPs concentrations compared to cells without AgNPs treatment. Díaz et al. (2008) studied the uptake of 5 types of nanoparticles by human blood cells and tumor cell lines and observed the appearance of groups of nanoparticles inside the human monocyte as the nanoparticles were rapidly taken up by the cells. Uptake of AgNPs via micelles has been reported (Luoma, 2008); however, the pathway by which AgNPs enter cells has not been clearly identified. Therefore, more comprehensive observation of the cellular uptake of AgNPs will be addressed in future studies.
Consistent with previous reports that nano-materials provoke oxidative stress (Harhaji et al., 2007; Limbach et al., 2007; Lin and Beal, 2006), our results showed that AgNPs induced ROS generation. Moreover, ROS generation in AgNPs-treated cells was decreased by pre-treatment of cells with NAC. GSH acts directly as a scavenger of ROS and as a substrate for GSH peroxidase to reduce hydrogen peroxide (Habib et al., 2007; Peña-Llopis et al., 2003; Vairetti et al., 2001). GSH is the major endogenous antioxidant scavenger that protects cells from oxidative stress through its ability to bind to and reduce ROS. Thus, preserving the GSH-mediated antioxidant defense is critical for cell survival (Anderson et al., 2004; Dewanjee et al., 2009; Sies, 1999). GSH is formed by γ-GCL and GSS. γ-GCL catalyzes the first and rate-limiting step in the process that yields glutamylcysteine in cellular GSH biosynthesis. The final step is catalyzed by GSS and adds a glycine residue to form glutamylcysteinylglycine or glutathione. γ-GCL is a heterodimeric enzyme composed of a catalytically active subunit (GCLC) that possesses all of the substrate-binding sites and a modifier subunit (GCLM) that
regulates GCLC’s affinity for substrates and inhibitors (Cortes-Wanstreet et al., 2009). Our results showed that AgNPs decreased GSH levels through the inhibition of GSH synthesizing enzymes (GCLC and GSS), leading to the generation of ROS. However, GSH is not the only intracellular antioxidant defense. Therefore, it remains to be determined if the other intracellular antioxidant systems (e.g. superoxide dismutase, catalase) are also impaired by AgNPs.
Highly reactive hydroxyl radicals attack cellular components including DNA, lipids, and proteins to cause various kinds of oxidative damages (Denisova et al., 2001; Halliwell and Aruoma, 1991). AgNPs were found to increase the DNA tail length in a comet assay, which measures DNA strand breaks as well as alkali labile sites (Rajagopalan et al., 2003; Singh, 2000). Cell membrane lipids peroxidation by AgNPs was shown using the DPPP and 8-isoprostane assays. In addition, oxidative damage to amino acid residues in proteins results in the formation of carbonyl derivatives and can compromise cellular integrity (Hawkins and Davies, 2001). The protein carbonyl content in cells increased significantly in AgNPs-treated cells.DNAdamage, lipid peroxidation, and protein oxidation result from AgNPs-induced intracellular GSH depletion and ROS generation, leading to damage to cellular components.
Recently several studies have shown that AgNPs trigger apoptosis via ROS generation in in vitro systems (Ahamed et al., 2010a; Foldbjerg et al., 2009). However, the function of ROS in AgNPsinduced liver cells death is currently unclear. The time-dependent decrease in ROS shown in Fig. 2A is probably due to cell death. To explore the possible molecular mechanisms of AgNPs-mediated cell death, we measured changes in the levels of regulators involved in apoptosis. Mitochondria are important signaling centers during apoptosis, and the loss of mitochondrial integrity can be induced or inhibited by many regulators of apoptosis (Green and Reed, 1998; Kroemer et al., 1997). In many cases, oxidative stress induces caspase activation through cytochrome c release from the mitochondrial inter-membrane space into the cytosol (Green and Reed, 1998; Liu et al., 1996). In our study, AgNPs induced mitochondrial release of
cytochrome c and the loss of Δψm. During the apoptotic process, Bcl-2 prevents the opening of
the mitochondrial membrane pores, whereas Bax induces the opening of membrane pores (Zamzami et al., 1995).Weshowed in this study that loss of Δψm by AgNPs is a result of
down-regulation of Bcl-2, and up-down-regulation of Bax. Cytochrome c release initiates a cascade that leads to the activation of caspase 3 through Apaf-1 and caspase 9 (Li et al., 1997; Zou et al., 1997). Our results also demonstrated that cytochrome c was released from mitochondria into the cytoplasm, followed by caspase 9 and caspase 3 activation. Hsin et al. (2008) have reported that mitochondria are a major site for AgNPs-induced ROS generation. This suggests that AgNPs activates the intrinsic apoptotic pathway, which is characterized by modulation of Bax and Bcl-2 expressions, disruption of Δψm, and cytochrome c release from the mitochondria. The
apoptotic process is regulated by many intracellular signaling pathways, including the JNK pathway (Chang and Karin, 2001; Davis, 2000; Lin, 2003; Shaulian and Karin, 2002). Other studies have reported that JNK is involved in various oxidative stress-associated diseases (Czaja, 2003; Shen and Liu, 2006) and that ROS generation could result in sustained JNK activation (Kamata et al., 2005). Among the pro-apoptotic targets of JNK Bcl-2 regulates apoptotic initiation via the prevention of cytochrome c release from the mitochondria (Yang et al., 1997). JNK participates in apoptotic signaling via phosphorylation of Bcl-2, which results in Bcl-2 inactivation (Herr and Debatin, 2001; Srivastava et al., 1999).
In conclusion, AgNPs induced ROS generation and intracellular GSH depletion and led to damage to cellular components. Additionally, AgNPs led to apoptosis via mitochondria-dependent and caspase-mitochondria-dependent pathways mediated by JNK (Fig. 7).
Fig. 7. A proposed pathway for AgNPs-induced ROS generation and intracellular GSH
PART II
Silver nanoparticles down-regulate Nrf2-mediated 8-oxoguanine
DNA glycosylase 1 through inactivation of extracellular
regulated kinase and protein kinase B in human Chang liver cells
ABSTRACT
Recently, we reported that AgNPs induced ROS generation and the resultant oxidative stress contributes to the cell damage associated with AgNPs. 8-oxoG is sensitive marker of ROS-induced DNA damage. OGG1 is an important DNA repair enzyme that recognizes and excises 8-oxoG. The aim of the present study was to examine the effect of AgNPs-induced oxidative stress on OGG1 and to elucidate mechanisms underlying AgNPs toxicity. AgNPs decreased OGG1 mRNA and protein expression, resulting in decreased OGG1 activity. Decreased OGG1 activity in AgNPs-treated cells led to increased 8-oxoG levels. The transcription factor Nrf2 is an important factor in the inducible regulation of OGG1. AgNPs treatment decreased nuclear Nrf2 expression, translocation into nucleus, and transcriptional activity of Nrf2. ERK and AKT, which are upstream of Nrf2, contribute to OGG1 expression. AgNPs attenuated both active forms of ERK and AKT protein expression, resulting in suppression of Nrf2 and decrease of OGG1 expression. These studies demonstrate that down-regulation of Nrf2-mediated OGG1 in exposure to AgNPs occurs through ERK and AKT inactivation.
Keywords: Silver nanoparticles; 8-Oxoguanine DNA glycosylase 1; 8-Oxoguanine; NF-E2-related factor 2.
1. INTRODUCTION
AgNPs are an important class of nanomaterials for a wide range of industrial and medical applications. Despite their widespread use, AgNPs are toxic to a variety of organs, including the lung, liver, and brain (Ahamed et al., 2010b). Possible mechanisms of AgNPs toxicity include induction of ROS, oxidative stress, DNA damage and apoptosis (Ahamed et al., 2010b). It has been demonstrated, for example, that AgNPs enter fibroblasts and hepatocytes and cause DNA damage and apoptosis (Arora et al., 2009). We recently reported that AgNPs cause cytotoxicity by oxidative stress-induced apoptosis and damage to DNA, lipid and protein (Piao et al., 2011).
8-oxoG is one of the most commonly formed DNA lesions and is considered a cellular marker for both oxidative stress and DNA damage (Dizdaroglu et al., 2002). OGG1 is the first step and rate-limiting enzyme involved in the removal of 8-oxoG through the base excision repair (BER) pathway (Boiteux and Radicella, 2000; Klungland et al., 1999; de Souza-Pinto et al., 2001). The human OGG1 promoter contains a putative transcription factor Nrf2 binding site and Nrf2 leads to OGG1 transcription (Merrill et al., 2002; Dhénaut et al., 2000). Mitogen activated protein kinase (MAPK) and AKT are important signaling enzymes involved in the transduction of various signals from the cell surface to the nucleus. MAPK and AKT induce Nrf2 translocation or increased stability, which leads to increased Nrf2 activity (Zipper and Mulcahy, 2003; Wang et al., 2008).
In this study, we investigated whether AgNPs-mediated ROS induction can affect DNA base modification with respect to 8-oxoG and studied the mechanisms by which the 8-oxoG is achieved.
2. MATERIALS AND METHODS
2.1. Reagents
AgNPs were provided by professor Jinhee Choi of Seoul University (Seoul, Repubilc of Korea) and characterization of AgNPs was conducted as described previously (Eom and Choi, 2010). AgNPs had an even distribution, with individual particle sizes ranging from 5 to 10 nm. AgNPs tend to agglomerate when exposed to cells; the most of the AgNPs in the medium were of about 28-35 nm in size. Ag ions were estimated using a multitype inductively coupled plasma emission spectrometer (ICPE-9000, Shimadzu, Tokyo, Japan). The concentrations of AgNPs and Ag ions had equivalent Ag masses and measured prior to exposure of the compounds to cell culture media. The OGG1 promoter-luciferase construct was a generous gift from Professor Ho Jin You of Chosun University (Gwangju, Republic of Korea). OGG1 antibody was purchased from Abcam (Cambridge, MA, USA). ERK2, phospho ERK1/2, Nrf2, and β-actin antibodies were purchased from Santa Cruz Biotechnology (Santa Cruz, CA, USA). Phospho AKT (Ser 473) and AKT antibodies were purchased from Cell Signaling Technology (Beverly, MA, USA). Avidin-tetramethylrhodamine isothiocyanate (TRITC) conjugate was purchased from Sigma Chemical Company (St. Louis, MO, USA). Other chemicals and reagents were of analytical grade.
2.2. Cell culture
Human Chang liver cells were obtained from the American type culture collection (Rockville, MD, USA) and were maintained in an incubator with a humidified atmosphere of 5% CO2 at 37 ℃. Cells were cultured in RPMI-1640 medium containing 10% heat-inactivated
2.3. Transient transfection and OGG1 promoter luciferase assay
Cells were transiently transfected with a plasmid harboring the OGG1 promoter using the transfection reagent DOTAP according to the manufacturer’s instructions (Roche, Mannheim, Germany). After overnight transfection, cells were treated with AgNPs for 6-48 h. Cells were then lysed with reporter lysis buffer (Promega, Madison, WI, USA), and the lysate supernatant was mixed with the luciferase assay reagent. The mixture was placed in a luminometer to measure the light produced.
2.4. Reverse transcription-polymerase chain reaction (RT-PCR)
Total RNA was isolated from cells using Trizol (GibcoBRL, Grand Island, NY, USA). PCR conditions for OGG1 and for the housekeeping gene GAPDH were: 35 cycles of 94 ℃ for 2 min; 94 ℃ for 20 s; 58 ℃ for 30 s; 72 ℃ for 1 min; and 72 ℃ for 5 min. The primer pairs (Bionics, Seoul, Republic of Korea) were as follows (sense and antisense, respectively): human OGG1-sense CTGCCTTCTGGACAATCTTT-3' and human OGG1-antisense
5'-TAGCCCGCCCTGTTCTTC-3', and human GAPDH sense
5'-GCAGTGAGGGTCTCTCTCCT-3'; and human GAPDH antisense
5'-AAGGTCGGAGTCAACGGATT-3'. Amplified products were resolved by 1% agarose gel electrophoresis, stained with ethidium bromide, and photographed under ultraviolet light.
2.5. Western blot analysis
Cells were lysed on ice for 30 min in 100 ml of lysis buffer [120 mM NaCl, 40 mM Tris (pH 8), 0.1% NP 40] and centrifuged at 13,000 × g for 15 min. The supernatants were collected from the lysates and the protein concentrations were determined. Aliquots of the lysates (40 mg of protein) were boiled for 5 min and electrophoresed in a 10% SDS–polyacrylamide gel. The blots in the gels were transferred onto nitrocellulose membranes, and subsequently incubated
with primary antibodies. The membranes were further incubated with secondary anti-immunoglobulin-G-horseradish peroxidase conjugates (Pierce, Rockford, IL, USA), followed by exposure to X-ray film. The protein bands were detected using an enhanced chemiluminescence Western blotting detection kit (Amersham, Little Chalfont, Buckinghamshire, UK).
2.6. Transfection of cells with 8-oxoG-containing molecular beacon
Cells were seeded at 1 × 10⁵ cells/well in 24-well plates and treated with 4 μg/ml of AgNPs
for 24 h. An 8-oxoG-containing oligonucleotide with the sequence 5'- FAM-GCACTOAAGCGCCGCACGCCATGTCGACGCGCTTCAGTGC-DAB-3' (where O is 8-oxoG) was synthesized by Bioneer Corporation (Bioneer, Republic of Korea). The 5'-fluorophore (fluorescein amidite, FAM) is in close proximity to the 3'-quencher (4-(4'-dimethylaminophenylazo) benzoic acid, DAB). After being cut the beacon by OGG1, the fluorescent signal is liberated, forming the bases of detection of OGG1 activity. The beacon was dissolved in sodium chloride-tris-EDTA buffer to give a stock solution (100 pmol/μl). The beacon was heated for 5 min at 95 ℃, vortexed and then left to cool slowly to room temperature in the dark to permit the adoption of the correct stem-loop conformation of oligonucleotide. Prior to use, the beacon was diluted to 10 pmol/μl in distilled deionized water and 100 pmol beacon and 2 μl LipofectamineTM 2000 (Invitrogen, Carlsbad, CA, USA) were transfected to cells. Cells were then placed in a humidified chamber (37 ℃, 5% CO2) for 6 h.
The green foci and fluorescence intensity were examined by both confocal microscopy and flow cytometry, respectively.
2.7. Detection of 8-oxoG
16 h after plating. After incubation for an additional 24 h at 37 ℃, cellular DNA was isolated using DNAzol reagent (Life Technologies, Grand Island, NY, USA) and quantified using a spectrophotometer. The amount of hydroxy-2'- deoxyguanosine (OHdG, a nucleoside of 8-oxoG) in DNA was determined using 8-OHdG-EIATM kit from OXIS Health Products
(Portland, OR, USA) according to the manufacturer’s instructions. The amount of 8-oxoG was also estimated in a fluorescent binding assay (Struthers et al., 1998). Cells were fixed and permeabilized with ice-cold methanol for 15 min. 8-OxoG was visualized with avidin-conjugated TRITC under a fluorescence microscope.
2.8. Immunocytochemistry
Cells plated on coverslips were fixed with 4% paraformaldehyde for 30 min and permeabilized with 0.1% Triton X-100 in PBS for 2.5 min. Cells were then treated with blocking solution (3% bovine serum albumin in PBS) for 1 h and incubated with Nrf2 antibody diluted in blocking solution for 2 h. Immuno reacted primary Nrf2 antibody was detected by a 1:500 dilution of FITC-conjugated secondary antibody (Jackson Immuno Research Laboratories, West Grove, PA, USA) for 1 h. After washing with PBS, stained cells were mounted onto microscope slides in mounting medium with DAPI (Vector, Burlingame, CA, USA). Images were collected using the LSM 510 program on a Zeiss confocal microscope.
2.9. Chromatin immunoprecipitation (ChIP) assay
Cells were processed using the Simple ChIPTM enzymatic chromatin IP kit from Cell Signaling Technology according to the manufacturer’s instructions. Briefly, the procedure was initiated by cross-linking the proteins to DNA by adding 1% formaldehyde to the culture dishes for 10 min on a rocking platform at room temperature. The cross-linking was stopped with the addition of glycine solution. Cells were harvested and centrifuged for 10 min at 720 ×
g. Nrf2 antibody (2 μg each) was added to the pre-cleared chromatin in 0.65 ml siliconized tubes and incubated overnight on a rotator at 4 ℃. The oligonucleotide containing the Nrf2 binding site within the OGG1 promoter was obtained from Bioneer (Seoul, Republic of Korea). The ChIP procedure was analyzed using PCR with human OGG1 promoter-specific primers sense (−2192) 5'-CCTGGAAGAG-3' and antisense (–2078) 5'-AATGACTCTGGCG-3' and Platinum Taq High Fidelity (Invitrogen). The cycle parameters were as follows: first cycle at 95 ℃ for 5 min; 55 cycles at 95 ℃ for 30 s; 59 ℃ for 30 s; 72 ℃ for 30 s; and a final extension at 72 ℃ for 7 min. PCR products were resolved on a 1% agarose gel containing ethidium bromide, and visualized under UV illumination (Bartz et al., 2011).
2.10. Statistical analysis
All measurements were made in triplicate and all values are expressed as the means ± standard error of the mean (SEM). The results were subjected to an analysis of variance (ANOVA) using the Tukey test to analyze the significance of the difference. A probability of p < 0.05 was considered significant.
3. RESULTS
3.1. Effect of AgNPs on the transcriptional activity of the OGG1 promoter and on OGG1 mRNA and protein expression
The transcriptional activity of the OGG1 promoter was assessed using an OGG1 promoter linked to a luciferase reporter gene. AgNPs treatment (6-48 h) decreased the transcriptional activity of the OGG1 promoter in a time-dependent manner (Fig. 8A). The transcriptional activity of the OGG1 promoter in AgNPs-treated cells was consistent with the expression levels of OGG1 mRNA; AgNPs treatment decreased OGG1 mRNA levels in a time-dependent manner (6-48 h) (Fig. 8B). Similarly, the expression of OGG1 protein decreased in a time-dependent manner (6-48 h) in AgNPs-treated cells (Fig. 8C).
A
Fig. 8. Effect of AgNPs on transcriptional activity of OGG1 promoter, OGG1 mRNA
expression and protein expression. (A) The time course of transcriptional activity of OGG1 promoter was measured after treatment of AgNPs at 4 mg/ml. *Significantly different from control (p < 0.05).
B
C
Fig. 8. continued. (B) OGG1 mRNA expression was analyzed by RT-PCR. (C) Cell lysates
were electrophoresed and the expression of OGG1 protein was detected using an OGG1 specific antibody.
3.2. Effect of AgNPs on OGG1 activity
Confocal microscopic images showed that 8-oxoG-containing beacon-transfected control cells had fluorescence foci, indicating fluorescent cleavage bases containing 8-oxoG (Fig. 9A, right in upper panel). AgNPs treatment showed green fluorescence to be the inherent fluorescence of AgNPs in non-transfected control cells and 8-oxoG-containing beacon-transfected cells (Fig. 9A, left and right in lower panel). However, AgNPs treatment in 8-oxoG-containing beacon-transfected cells decreased the numbers of fluorescence foci compared to 8-oxoG-containing beacon-transfected control cells (Fig. 9A, right in lower and upper panel and histogram graph). The confocal microscopic data were consistent with the flow cytometric data (Fig. 9B).
A
Fig. 9. Effect of AgNPs on OGG1 activity. The 8-oxoG-containing beacon was trans-fected
into cells. (A) The fluorescence foci of the cleaved bases containing 8-oxoG were detected by confocal microscopy and counted. *Significantly different from control (p < 0.05).
B
Fig. 9. continued. (B) The fluorescence foci were detected by flow cytometry. *Significantly
different from control (p < 0.05).
3.3. Effect of AgNPs on the levels of 8-oxoG
The levels of 8-oxoG, a hallmark of oxidative stress-DNA base damage, were measured using an 8-OHdG detection kit and verified by immunochemistry. As shown in Fig. 10A, AgNPs increased the levels of 8-oxoG in DNA in a time-dependent manner (6-48 h). Condensed staining intensity of 8-oxoG was observed in AgNPs-treated cells (Fig. 10B). These results suggest that AgNPs increases the levels of 8-oxoG.
A
B
Fig. 10. Effect of AgNPs on 8-oxoG levels. (A) Cellular DNA was isolated using DNAzol
reagent and the amount of 8-oxoG in DNA quantified using the Bioxytech 8-OHdG-ELISA kit. *Significantly different from control (p < 0.05). (B) 8-OxoG detected by the binding of avidin-TRITC conjugate was visualized by fluorescence microscope.
3.4. Effect of AgNPs on the Nrf2 transcription factor
treatment resulted in decreased nuclear Nrf2 expression and translocation into the nucleus (Fig. 11A and B). As shown in Fig. 11B, AgNPs treatment changed the morphology of cells to round shape compared to control cells. In our previous report, AgNPs showed cytotoxicity via induction of apoptosis (Piao et al., 2011), suggesting that the morphological change in AgNPs-treated cells may be due to induction of apoptosis. Furthermore, AgNPs-AgNPs-treated cells exhibited almost no detectable Nrf2 binding to the sequence in OGG1 promoter (Fig. 11C).
A
B
Fig. 11. Effects of AgNPs on Nrf2 expression, translocalization into the nucleus, and binding
to OGG1 promoter. (A) Nuclear lysates were electrophoresed and the time-course of the effects of AgNPs on the expression of Nrf2 protein was detected using an Nrf2-specific antibody. (B) FITC-conjugated secondary antibody staining indi-cates the location of Nrf2 (green) by anti-Nrf2 antibody; DAPI staining indicates the location of the nucleus (blue); and the merged image indicates the nuclear location of Nrf2 protein.
C
Fig. 11. continued. (C) Nrf2 binding sequence in OGG1 promoter obtained by the ChIP
procedure was analyzed using PCR.
3.5. Effect of AgNPs on AKT and ERK
AKT and ERK1/2 are major signaling enzymes involved in cellular protection against oxidative stress and up-stream regulator of Nrf2. As shown in Fig. 12A and B, exposure to AgNPs caused a decrease in the phosphorylation (active form) of ERK1/2 and AKT in a time-dependent manner.
A
B
Fig. 12. Effect of AgNPs on the phosphorylation of AKT and ERK. Cell lysates were
electrophoresed, and (A) phospho ERK1/2 and ERK2, (B) phospho AKT and AKT were detected by using their respective specific antibodies.
4. DISCUSSION
Oxidative stress is caused by an imbalance between oxidants and antioxidants, and results in damage to membrane lipids, proteins and DNA, which leads to cell death (Toyokuni, 1999; Zimmerman, 1998; Ercal et al., 2001). Oxidative stress is an important mechanism mediating the toxicity of nanoparticles (Nel et al., 2006). For example, we recently reported that AgNPs induced ROS and damaged DNA, leading to apoptosis (Piao et al., 2011). 8-OxoG is known to be a sensitive marker of oxidative DNA damage (Shtarkman et al., 2008; Vadim et al., 2002), and is involved in mutagenesis, tissue/cell damage, and apoptosis (Hyun et al., 2000, 2003; Tsuzuki et al., 2007; Tsuruya et al., 2003). In the present study, AgNPs increased the levels of 8-oxoG in a time-dependent manner. This result demonstrated that oxidative stress induced by AgNPs causes DNA modification and leads to the accumulation of 8-oxoG in DNA.
OGG1 is a specific repair enzyme involved in the removal of 8-oxoG from DNA via the BER pathway in mammals, and plays an integral role in genomic maintenance. AgNPs decreased OGG1 activity, suggesting that inability of OGG1 to repair 8-oxoG leads to an increase of 8-oxoG in DNA. The inhibition of OGG1 activity by AgNPs could be the result of changes in gene transcription or translation. The transcriptional activity of OGG1 was decreased in AgNPs-treated cells and this led to a decrease in OGG1 mRNA expression. Similarly, OGG1 protein expression was decreased in AgNPs-treated cells. It has been suggested that the expression of OGG1 is affected by the redox status of the cell because a putative Nrf2 transcription factor binding site is present in the promoter of the human OGG1 (Dhénaut et al., 2000). In the present study, AgNPs down-regulated OGG1 expression by decreasing Nrf2 expression and Nrf2 binding to sequences present in the OGG1 gene promoter. Nrf2 is involved in the regulation of phase II xenobiotic metabolism and antioxidant genes, and is also an important factor in the inducible regulation of OGG1 (Cox, 2007). Structurally, Nrf2
is a basic leucine zipper transcription factor that under normal conditions remains sequestered in the cytosol (Moi et al., 1994; Venugopal and Jaiswal, 1998). Sequestration of Nrf2 is facilitated by interaction with its inhibitory partner, kelch-like protein 1 (Keap1) (Itoh et al., 1999; Dinkova-Kostova et al., 2002). Under basal conditions, Nrf2-Keap1 complexes are maintained in the cytosol tethered to the actin cytoskeleton where Nrf2 is continually targeted to the proteasome via an ubiquitin-dependent pathway (Nguyen et al., 2003). However, in the presence of ROS, xenobiotics or enzymatic activation, Nrf2 is released from Keap1 and translocates to the nucleus where it interacts with small Maf binding proteins. The final function of active Nrf2 is to interact with its cognate binding sequence in promoters and induce transcription (Itoh et al., 2004; Lee and Johnson, 2004; Nguyen et al., 2004). AgNPs decreases the nuclear level of Nrf2, its binding to its cognate sequence in the OGG1 promoter, and its transcriptional activity. The mechanisms leading to nuclear translocation of Nrf2 include its release from Keap1 in the cytosol. ERK and AKT phosphorylates Nrf2, which may facilitate the release of Nrf2 from the Keap1-Nrf2 complex, allowing activated Nrf2 to translocate into the nucleus where it forms a heterodimer with small Maf protein (Li et al., 2007; Chan et al., 2001; Kim et al., 2001; Kwak et al., 2002). Our data indicate that AgNPs act through down-regulation of ERK and AKT to down-regulate OGG1, resulting in the accumulation of oxidized DNA bases. The OGG1 promoter contains Nrf2 and stimulation protein-1 (SP-1) binding sites (Dhénaut et al., 2000). The AKT pathway regulates Nrf2 and SP-1 (Piantadosi et al., 2008; Sroka et al., 2007), and AKT up-regulation is involved in the resistance of cancer cells to gamma-ray via OGG1 induction (Ueta et al., 2008). ERK signaling regulates Nrf2 activation and ERK up-regulation involved in up-regulation of OGG1 against hyperoxic cytotoxicity (Papaiahgari et al., 2004; Kannan et al., 2006). Thus, the AKT and ERK pathways mediate up-regulation of OGG1. AKT and ERK have been implicated in the regulation of a variety of signal transduction pathways that mediate gene transcription, cell cycle events, cell
proliferation, DNA repair, and cell survival (Wanzel et al., 2005; Gao et al., 2004; Santos et al., 2001; Kandel et al., 2002; Yu et al., 2003; Ueta et al., 2008; Kannan et al., 2006).
In summary, 8-oxoG accumulation in AgNPs-treated cells occurs through decreased activities of ERK and AKT, decreased nuclear translocation of Nrf2, decreased Nrf2 binding to the OGG1 promoter, and down-regulation of OGG1 gene expression.